
Key Insights
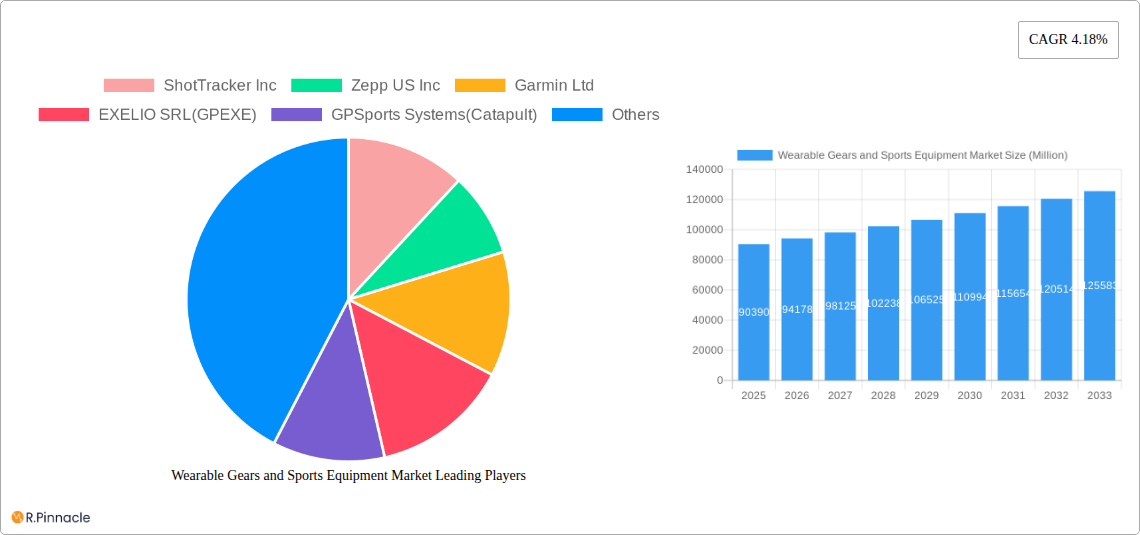
The global wearable gears and sports equipment market, valued at $90.39 billion in 2025, is projected to experience robust growth, driven by several key factors. The increasing popularity of fitness tracking and athletic performance optimization is a significant catalyst, fueling demand for sophisticated devices such as fitness trackers, smart clothing, and GPS trackers. Technological advancements, including improved sensor technology, longer battery life, and enhanced data analytics capabilities within these devices, further contribute to market expansion. The integration of wearable technology with mobile applications and cloud-based platforms provides users with personalized insights and training plans, adding to the market's appeal. Furthermore, the rising awareness of health and wellness, coupled with the increasing participation in sports and fitness activities across various demographics, significantly boosts market demand. Growth is expected to be particularly strong in regions with high disposable incomes and a growing adoption of technology, such as North America and parts of Asia-Pacific.
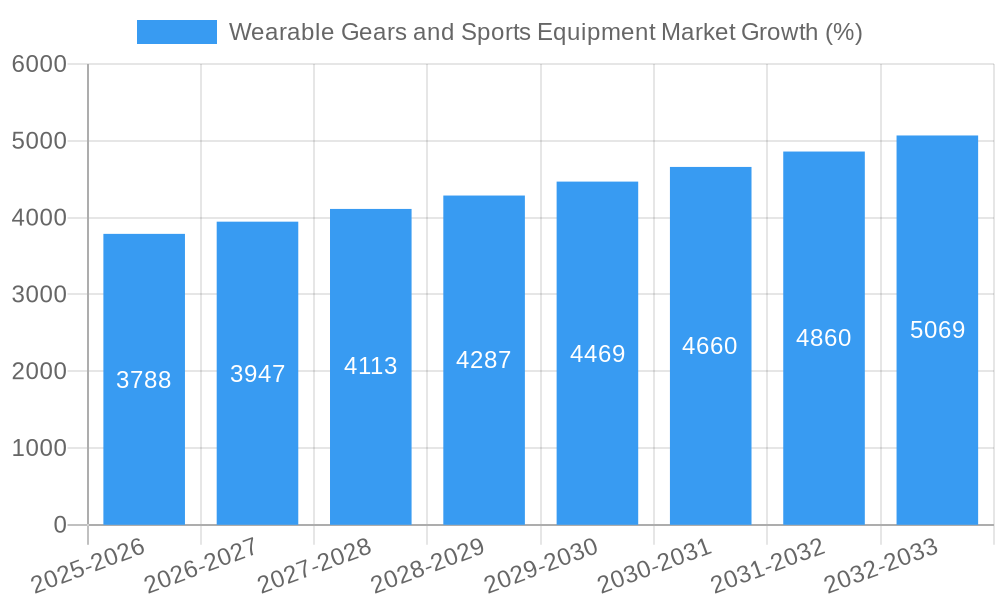
However, challenges remain. High initial costs of some advanced devices can limit market penetration, particularly in developing economies. Concerns regarding data privacy and security associated with wearable technology also pose a potential restraint. Competition among established players and emerging startups is intense, putting pressure on pricing and margins. To mitigate these challenges, manufacturers are increasingly focusing on developing affordable and user-friendly devices, incorporating robust security measures, and leveraging strategic partnerships to expand market reach. The market segmentation by device type (fitness & heart rate monitors, smart clothing, GPS trackers, and other devices) reflects the diverse applications of this technology, suggesting continued diversification and innovation within the industry. The forecast period (2025-2033) anticipates continued growth, with the CAGR of 4.18% indicating a steady expansion of the market throughout the projection period. This growth will be influenced by the success of companies like ShotTracker Inc, Zepp US Inc, Garmin Ltd, and others in innovating and meeting evolving consumer demands for more sophisticated and personalized fitness solutions.
Wearable Gears and Sports Equipment Market Report: 2019-2033
This comprehensive report provides an in-depth analysis of the Wearable Gears and Sports Equipment Market, offering invaluable insights for industry professionals, investors, and strategic decision-makers. With a detailed study period spanning 2019-2033 (Base Year: 2025, Estimated Year: 2025, Forecast Period: 2025-2033, Historical Period: 2019-2024), this report unveils the market's current state, future trajectory, and key players shaping its evolution. Expect detailed analysis of market size (in Millions), CAGR, and market penetration across various segments.
Wearable Gears and Sports Equipment Market Market Structure & Innovation Trends
This section analyzes the competitive landscape, innovation drivers, and regulatory factors influencing the Wearable Gears and Sports Equipment Market. We delve into market concentration, examining the market share held by key players like Garmin Ltd, ShotTracker Inc, Zepp US Inc, and others. The report also explores the impact of mergers and acquisitions (M&A) activities, providing insights into deal values and their influence on market dynamics. Innovation drivers such as technological advancements in sensor technology, data analytics, and materials science are examined, along with regulatory frameworks governing product safety and data privacy. The analysis also accounts for the impact of substitute products and evolving end-user demographics on market growth. The overall market structure is assessed, with metrics like market share and M&A deal values (in Millions) provided to illustrate market concentration and competitive dynamics. A thorough analysis of the market's evolutionary aspects will be discussed.
Wearable Gears and Sports Equipment Market Market Dynamics & Trends
This section explores the key market dynamics and trends shaping the Wearable Gears and Sports Equipment Market's growth. We analyze the factors driving market expansion, including rising consumer health awareness, increasing adoption of fitness tracking technologies, and the growing popularity of wearable fitness and sports equipment. We assess the influence of technological disruptions, including the development of advanced sensors, improved data processing capabilities, and the integration of artificial intelligence (AI) and machine learning (ML). Consumer preferences, such as demand for personalized fitness insights and seamless data integration with other health applications, are also examined. The competitive dynamics of the market are analyzed, taking into consideration factors like product differentiation, pricing strategies, and marketing efforts. Specific metrics like CAGR and market penetration rates are provided for a granular understanding of market evolution.
Dominant Regions & Segments in Wearable Gears and Sports Equipment Market
This section identifies the leading regions and segments within the Wearable Gears and Sports Equipment Market. A comprehensive dominance analysis is performed focusing on key geographical areas and device types (Fitness & Heart Rate Monitors, Smart Clothing, GPS Trackers, Other Devices). We explore the drivers of segment dominance, including economic policies, infrastructure development, and consumer behavior. For each dominant segment, a detailed analysis is conducted, explaining their superior market performance and future prospects.
- Key Drivers:
- Economic factors
- Technological advancements
- Government initiatives
- Consumer preferences
Wearable Gears and Sports Equipment Market Product Innovations
This section details recent product developments, exploring the applications and competitive advantages of new offerings. Technological trends like the incorporation of advanced sensors, improved battery life, and enhanced data analytics capabilities are discussed, along with their impact on market fit and consumer appeal. The focus is on how these innovations are shaping the competitive landscape and driving market growth.
Report Scope & Segmentation Analysis
This report segments the Wearable Gears and Sports Equipment Market by device type:
- Fitness & Heart Rate Monitors: This segment analysis includes market size (in Millions), growth projections, competitive dynamics, and key players.
- Smart Clothing: This section includes market size (in Millions), growth projections, competitive dynamics, and key players.
- GPS Trackers: This segment analysis includes market size (in Millions), growth projections, competitive dynamics, and key players.
- Other Devices (Cameras, etc.): This segment analysis includes market size (in Millions), growth projections, competitive dynamics, and key players.
Key Drivers of Wearable Gears and Sports Equipment Market Growth
This section identifies the key factors driving market growth, including advancements in sensor technology, increasing demand for personalized fitness tracking, and the rising popularity of sports and fitness activities. We also examine the role of government initiatives promoting health and wellness, and the expanding integration of wearable technology with health management platforms. The impact of these factors on market expansion is discussed with quantifiable examples and projections.
Challenges in the Wearable Gears and Sports Equipment Market Sector
This section analyzes the challenges facing the Wearable Gears and Sports Equipment Market. We address regulatory hurdles related to data privacy and product safety, supply chain disruptions affecting production and distribution, and intense competition from established and emerging players. The quantifiable impact of these challenges on market growth is assessed, providing valuable insights into potential risks and mitigation strategies.
Emerging Opportunities in Wearable Gears and Sports Equipment Market
This section identifies emerging trends and opportunities, such as the integration of wearable technology with other health platforms, the expansion into new markets, and the development of advanced data analytics capabilities. We also examine the potential for new product innovations and the rising adoption of wearable technology in niche applications. These opportunities are examined in terms of their market potential and contribution to future growth.
Leading Players in the Wearable Gears and Sports Equipment Market Market
- ShotTracker Inc
- Zepp US Inc
- Garmin Ltd
- EXELIO SRL(GPEXE)
- GPSports Systems(Catapult)
- STATSports Group
- Catapult Sports Pty Ltd
- Kinexon GmbH
- Sensoria Inc
Key Developments in Wearable Gears and Sports Equipment Market Industry
- June 2022: Garmin Ltd. launched the Forerunner 955 Solar, a running smartwatch with solar charging, offering extended battery life.
- August 2022: WHOOP partnered with Penn State Athletics to utilize WHOOP wearable technology for student-athlete wellness.
- January 2023: Garmin India introduced the Instinct Crossover and Instinct Crossover Solar smartwatches.
Future Outlook for Wearable Gears and Sports Equipment Market Market
This section provides a summary of the future market potential and strategic opportunities within the Wearable Gears and Sports Equipment Market. We project sustained growth driven by technological innovations, increasing health awareness, and expansion into new markets. The report highlights strategic opportunities for businesses to capitalize on emerging trends and gain a competitive advantage. The overall market outlook is positive, with substantial growth potential in the coming years.
Wearable Gears and Sports Equipment Market Segmentation
-
1. Device Type
- 1.1. Fitness & Heart Rate Monitors
- 1.2. Smart Clothing
- 1.3. GPS Trackers
- 1.4. Other Devices (Cameras, etc)
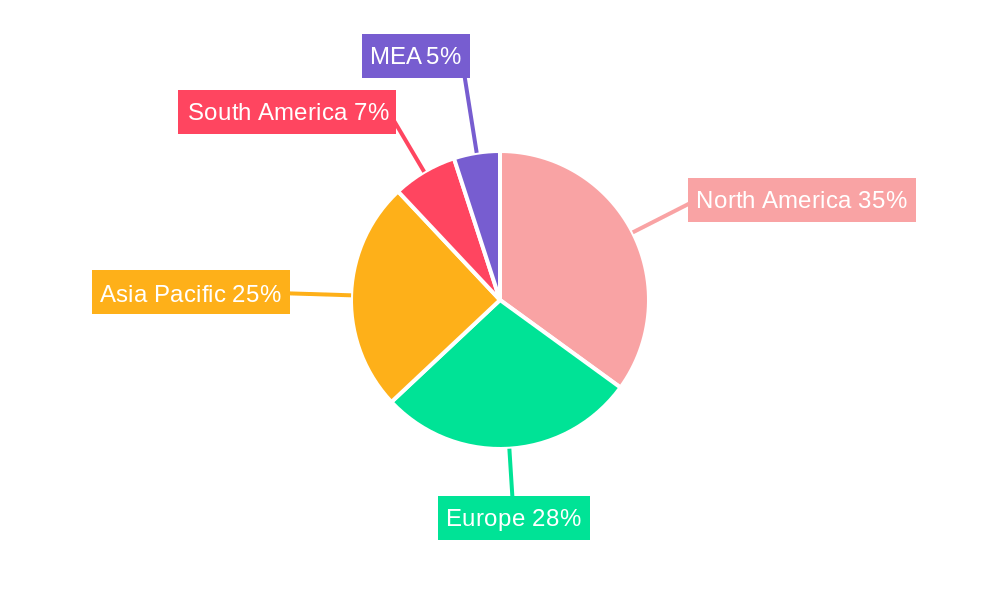
Wearable Gears and Sports Equipment Market Segmentation By Geography
- 1. North America
- 2. Europe
- 3. Asia
- 4. Australia and New Zealand
- 5. Latin America
Wearable Gears and Sports Equipment Market REPORT HIGHLIGHTS
| Aspects | Details |
|---|---|
| Study Period | 2019-2033 |
| Base Year | 2024 |
| Estimated Year | 2025 |
| Forecast Period | 2025-2033 |
| Historical Period | 2019-2024 |
| Growth Rate | CAGR of 4.18% from 2019-2033 |
| Segmentation |
|
Table of Contents
- 1. Introduction
- 1.1. Research Scope
- 1.2. Market Segmentation
- 1.3. Research Methodology
- 1.4. Definitions and Assumptions
- 2. Executive Summary
- 2.1. Introduction
- 3. Market Dynamics
- 3.1. Introduction
- 3.2. Market Drivers
- 3.2.1 Growing Demand for Data-Driven Decisions and Operations; Increasing Sports Events
- 3.2.2 Online and Offline; Portable and Convenient Usage
- 3.3. Market Restrains
- 3.3.1. High Initial Investment and Budget Constraints
- 3.4. Market Trends
- 3.4.1. Smart Clothing Device Type Segment is Expected to Hold Significant Market Share
- 4. Market Factor Analysis
- 4.1. Porters Five Forces
- 4.2. Supply/Value Chain
- 4.3. PESTEL analysis
- 4.4. Market Entropy
- 4.5. Patent/Trademark Analysis
- 5. Global Wearable Gears and Sports Equipment Market Analysis, Insights and Forecast, 2019-2031
- 5.1. Market Analysis, Insights and Forecast - by Device Type
- 5.1.1. Fitness & Heart Rate Monitors
- 5.1.2. Smart Clothing
- 5.1.3. GPS Trackers
- 5.1.4. Other Devices (Cameras, etc)
- 5.2. Market Analysis, Insights and Forecast - by Region
- 5.2.1. North America
- 5.2.2. Europe
- 5.2.3. Asia
- 5.2.4. Australia and New Zealand
- 5.2.5. Latin America
- 5.1. Market Analysis, Insights and Forecast - by Device Type
- 6. North America Wearable Gears and Sports Equipment Market Analysis, Insights and Forecast, 2019-2031
- 6.1. Market Analysis, Insights and Forecast - by Device Type
- 6.1.1. Fitness & Heart Rate Monitors
- 6.1.2. Smart Clothing
- 6.1.3. GPS Trackers
- 6.1.4. Other Devices (Cameras, etc)
- 6.1. Market Analysis, Insights and Forecast - by Device Type
- 7. Europe Wearable Gears and Sports Equipment Market Analysis, Insights and Forecast, 2019-2031
- 7.1. Market Analysis, Insights and Forecast - by Device Type
- 7.1.1. Fitness & Heart Rate Monitors
- 7.1.2. Smart Clothing
- 7.1.3. GPS Trackers
- 7.1.4. Other Devices (Cameras, etc)
- 7.1. Market Analysis, Insights and Forecast - by Device Type
- 8. Asia Wearable Gears and Sports Equipment Market Analysis, Insights and Forecast, 2019-2031
- 8.1. Market Analysis, Insights and Forecast - by Device Type
- 8.1.1. Fitness & Heart Rate Monitors
- 8.1.2. Smart Clothing
- 8.1.3. GPS Trackers
- 8.1.4. Other Devices (Cameras, etc)
- 8.1. Market Analysis, Insights and Forecast - by Device Type
- 9. Australia and New Zealand Wearable Gears and Sports Equipment Market Analysis, Insights and Forecast, 2019-2031
- 9.1. Market Analysis, Insights and Forecast - by Device Type
- 9.1.1. Fitness & Heart Rate Monitors
- 9.1.2. Smart Clothing
- 9.1.3. GPS Trackers
- 9.1.4. Other Devices (Cameras, etc)
- 9.1. Market Analysis, Insights and Forecast - by Device Type
- 10. Latin America Wearable Gears and Sports Equipment Market Analysis, Insights and Forecast, 2019-2031
- 10.1. Market Analysis, Insights and Forecast - by Device Type
- 10.1.1. Fitness & Heart Rate Monitors
- 10.1.2. Smart Clothing
- 10.1.3. GPS Trackers
- 10.1.4. Other Devices (Cameras, etc)
- 10.1. Market Analysis, Insights and Forecast - by Device Type
- 11. North America Wearable Gears and Sports Equipment Market Analysis, Insights and Forecast, 2019-2031
- 11.1. Market Analysis, Insights and Forecast - By Country/Sub-region
- 11.1.1 United States
- 11.1.2 Canada
- 11.1.3 Mexico
- 12. Europe Wearable Gears and Sports Equipment Market Analysis, Insights and Forecast, 2019-2031
- 12.1. Market Analysis, Insights and Forecast - By Country/Sub-region
- 12.1.1 Germany
- 12.1.2 United Kingdom
- 12.1.3 France
- 12.1.4 Spain
- 12.1.5 Italy
- 12.1.6 Spain
- 12.1.7 Belgium
- 12.1.8 Netherland
- 12.1.9 Nordics
- 12.1.10 Rest of Europe
- 13. Asia Pacific Wearable Gears and Sports Equipment Market Analysis, Insights and Forecast, 2019-2031
- 13.1. Market Analysis, Insights and Forecast - By Country/Sub-region
- 13.1.1 China
- 13.1.2 Japan
- 13.1.3 India
- 13.1.4 South Korea
- 13.1.5 Southeast Asia
- 13.1.6 Australia
- 13.1.7 Indonesia
- 13.1.8 Phillipes
- 13.1.9 Singapore
- 13.1.10 Thailandc
- 13.1.11 Rest of Asia Pacific
- 14. South America Wearable Gears and Sports Equipment Market Analysis, Insights and Forecast, 2019-2031
- 14.1. Market Analysis, Insights and Forecast - By Country/Sub-region
- 14.1.1 Brazil
- 14.1.2 Argentina
- 14.1.3 Peru
- 14.1.4 Chile
- 14.1.5 Colombia
- 14.1.6 Ecuador
- 14.1.7 Venezuela
- 14.1.8 Rest of South America
- 15. North America Wearable Gears and Sports Equipment Market Analysis, Insights and Forecast, 2019-2031
- 15.1. Market Analysis, Insights and Forecast - By Country/Sub-region
- 15.1.1 United States
- 15.1.2 Canada
- 15.1.3 Mexico
- 16. MEA Wearable Gears and Sports Equipment Market Analysis, Insights and Forecast, 2019-2031
- 16.1. Market Analysis, Insights and Forecast - By Country/Sub-region
- 16.1.1 United Arab Emirates
- 16.1.2 Saudi Arabia
- 16.1.3 South Africa
- 16.1.4 Rest of Middle East and Africa
- 17. Competitive Analysis
- 17.1. Global Market Share Analysis 2024
- 17.2. Company Profiles
- 17.2.1 ShotTracker Inc
- 17.2.1.1. Overview
- 17.2.1.2. Products
- 17.2.1.3. SWOT Analysis
- 17.2.1.4. Recent Developments
- 17.2.1.5. Financials (Based on Availability)
- 17.2.2 Zepp US Inc
- 17.2.2.1. Overview
- 17.2.2.2. Products
- 17.2.2.3. SWOT Analysis
- 17.2.2.4. Recent Developments
- 17.2.2.5. Financials (Based on Availability)
- 17.2.3 Garmin Ltd
- 17.2.3.1. Overview
- 17.2.3.2. Products
- 17.2.3.3. SWOT Analysis
- 17.2.3.4. Recent Developments
- 17.2.3.5. Financials (Based on Availability)
- 17.2.4 EXELIO SRL(GPEXE)
- 17.2.4.1. Overview
- 17.2.4.2. Products
- 17.2.4.3. SWOT Analysis
- 17.2.4.4. Recent Developments
- 17.2.4.5. Financials (Based on Availability)
- 17.2.5 GPSports Systems(Catapult)
- 17.2.5.1. Overview
- 17.2.5.2. Products
- 17.2.5.3. SWOT Analysis
- 17.2.5.4. Recent Developments
- 17.2.5.5. Financials (Based on Availability)
- 17.2.6 List not Exhaustive
- 17.2.6.1. Overview
- 17.2.6.2. Products
- 17.2.6.3. SWOT Analysis
- 17.2.6.4. Recent Developments
- 17.2.6.5. Financials (Based on Availability)
- 17.2.7 STATSports Group
- 17.2.7.1. Overview
- 17.2.7.2. Products
- 17.2.7.3. SWOT Analysis
- 17.2.7.4. Recent Developments
- 17.2.7.5. Financials (Based on Availability)
- 17.2.8 Catapult Sports Pty Ltd
- 17.2.8.1. Overview
- 17.2.8.2. Products
- 17.2.8.3. SWOT Analysis
- 17.2.8.4. Recent Developments
- 17.2.8.5. Financials (Based on Availability)
- 17.2.9 Kinexon GmbH
- 17.2.9.1. Overview
- 17.2.9.2. Products
- 17.2.9.3. SWOT Analysis
- 17.2.9.4. Recent Developments
- 17.2.9.5. Financials (Based on Availability)
- 17.2.10 Sensoria Inc
- 17.2.10.1. Overview
- 17.2.10.2. Products
- 17.2.10.3. SWOT Analysis
- 17.2.10.4. Recent Developments
- 17.2.10.5. Financials (Based on Availability)
- 17.2.1 ShotTracker Inc
List of Figures
- Figure 1: Global Wearable Gears and Sports Equipment Market Revenue Breakdown (Million, %) by Region 2024 & 2032
- Figure 2: Global Wearable Gears and Sports Equipment Market Volume Breakdown (K Unit, %) by Region 2024 & 2032
- Figure 3: North America Wearable Gears and Sports Equipment Market Revenue (Million), by Country 2024 & 2032
- Figure 4: North America Wearable Gears and Sports Equipment Market Volume (K Unit), by Country 2024 & 2032
- Figure 5: North America Wearable Gears and Sports Equipment Market Revenue Share (%), by Country 2024 & 2032
- Figure 6: North America Wearable Gears and Sports Equipment Market Volume Share (%), by Country 2024 & 2032
- Figure 7: Europe Wearable Gears and Sports Equipment Market Revenue (Million), by Country 2024 & 2032
- Figure 8: Europe Wearable Gears and Sports Equipment Market Volume (K Unit), by Country 2024 & 2032
- Figure 9: Europe Wearable Gears and Sports Equipment Market Revenue Share (%), by Country 2024 & 2032
- Figure 10: Europe Wearable Gears and Sports Equipment Market Volume Share (%), by Country 2024 & 2032
- Figure 11: Asia Pacific Wearable Gears and Sports Equipment Market Revenue (Million), by Country 2024 & 2032
- Figure 12: Asia Pacific Wearable Gears and Sports Equipment Market Volume (K Unit), by Country 2024 & 2032
- Figure 13: Asia Pacific Wearable Gears and Sports Equipment Market Revenue Share (%), by Country 2024 & 2032
- Figure 14: Asia Pacific Wearable Gears and Sports Equipment Market Volume Share (%), by Country 2024 & 2032
- Figure 15: South America Wearable Gears and Sports Equipment Market Revenue (Million), by Country 2024 & 2032
- Figure 16: South America Wearable Gears and Sports Equipment Market Volume (K Unit), by Country 2024 & 2032
- Figure 17: South America Wearable Gears and Sports Equipment Market Revenue Share (%), by Country 2024 & 2032
- Figure 18: South America Wearable Gears and Sports Equipment Market Volume Share (%), by Country 2024 & 2032
- Figure 19: North America Wearable Gears and Sports Equipment Market Revenue (Million), by Country 2024 & 2032
- Figure 20: North America Wearable Gears and Sports Equipment Market Volume (K Unit), by Country 2024 & 2032
- Figure 21: North America Wearable Gears and Sports Equipment Market Revenue Share (%), by Country 2024 & 2032
- Figure 22: North America Wearable Gears and Sports Equipment Market Volume Share (%), by Country 2024 & 2032
- Figure 23: MEA Wearable Gears and Sports Equipment Market Revenue (Million), by Country 2024 & 2032
- Figure 24: MEA Wearable Gears and Sports Equipment Market Volume (K Unit), by Country 2024 & 2032
- Figure 25: MEA Wearable Gears and Sports Equipment Market Revenue Share (%), by Country 2024 & 2032
- Figure 26: MEA Wearable Gears and Sports Equipment Market Volume Share (%), by Country 2024 & 2032
- Figure 27: North America Wearable Gears and Sports Equipment Market Revenue (Million), by Device Type 2024 & 2032
- Figure 28: North America Wearable Gears and Sports Equipment Market Volume (K Unit), by Device Type 2024 & 2032
- Figure 29: North America Wearable Gears and Sports Equipment Market Revenue Share (%), by Device Type 2024 & 2032
- Figure 30: North America Wearable Gears and Sports Equipment Market Volume Share (%), by Device Type 2024 & 2032
- Figure 31: North America Wearable Gears and Sports Equipment Market Revenue (Million), by Country 2024 & 2032
- Figure 32: North America Wearable Gears and Sports Equipment Market Volume (K Unit), by Country 2024 & 2032
- Figure 33: North America Wearable Gears and Sports Equipment Market Revenue Share (%), by Country 2024 & 2032
- Figure 34: North America Wearable Gears and Sports Equipment Market Volume Share (%), by Country 2024 & 2032
- Figure 35: Europe Wearable Gears and Sports Equipment Market Revenue (Million), by Device Type 2024 & 2032
- Figure 36: Europe Wearable Gears and Sports Equipment Market Volume (K Unit), by Device Type 2024 & 2032
- Figure 37: Europe Wearable Gears and Sports Equipment Market Revenue Share (%), by Device Type 2024 & 2032
- Figure 38: Europe Wearable Gears and Sports Equipment Market Volume Share (%), by Device Type 2024 & 2032
- Figure 39: Europe Wearable Gears and Sports Equipment Market Revenue (Million), by Country 2024 & 2032
- Figure 40: Europe Wearable Gears and Sports Equipment Market Volume (K Unit), by Country 2024 & 2032
- Figure 41: Europe Wearable Gears and Sports Equipment Market Revenue Share (%), by Country 2024 & 2032
- Figure 42: Europe Wearable Gears and Sports Equipment Market Volume Share (%), by Country 2024 & 2032
- Figure 43: Asia Wearable Gears and Sports Equipment Market Revenue (Million), by Device Type 2024 & 2032
- Figure 44: Asia Wearable Gears and Sports Equipment Market Volume (K Unit), by Device Type 2024 & 2032
- Figure 45: Asia Wearable Gears and Sports Equipment Market Revenue Share (%), by Device Type 2024 & 2032
- Figure 46: Asia Wearable Gears and Sports Equipment Market Volume Share (%), by Device Type 2024 & 2032
- Figure 47: Asia Wearable Gears and Sports Equipment Market Revenue (Million), by Country 2024 & 2032
- Figure 48: Asia Wearable Gears and Sports Equipment Market Volume (K Unit), by Country 2024 & 2032
- Figure 49: Asia Wearable Gears and Sports Equipment Market Revenue Share (%), by Country 2024 & 2032
- Figure 50: Asia Wearable Gears and Sports Equipment Market Volume Share (%), by Country 2024 & 2032
- Figure 51: Australia and New Zealand Wearable Gears and Sports Equipment Market Revenue (Million), by Device Type 2024 & 2032
- Figure 52: Australia and New Zealand Wearable Gears and Sports Equipment Market Volume (K Unit), by Device Type 2024 & 2032
- Figure 53: Australia and New Zealand Wearable Gears and Sports Equipment Market Revenue Share (%), by Device Type 2024 & 2032
- Figure 54: Australia and New Zealand Wearable Gears and Sports Equipment Market Volume Share (%), by Device Type 2024 & 2032
- Figure 55: Australia and New Zealand Wearable Gears and Sports Equipment Market Revenue (Million), by Country 2024 & 2032
- Figure 56: Australia and New Zealand Wearable Gears and Sports Equipment Market Volume (K Unit), by Country 2024 & 2032
- Figure 57: Australia and New Zealand Wearable Gears and Sports Equipment Market Revenue Share (%), by Country 2024 & 2032
- Figure 58: Australia and New Zealand Wearable Gears and Sports Equipment Market Volume Share (%), by Country 2024 & 2032
- Figure 59: Latin America Wearable Gears and Sports Equipment Market Revenue (Million), by Device Type 2024 & 2032
- Figure 60: Latin America Wearable Gears and Sports Equipment Market Volume (K Unit), by Device Type 2024 & 2032
- Figure 61: Latin America Wearable Gears and Sports Equipment Market Revenue Share (%), by Device Type 2024 & 2032
- Figure 62: Latin America Wearable Gears and Sports Equipment Market Volume Share (%), by Device Type 2024 & 2032
- Figure 63: Latin America Wearable Gears and Sports Equipment Market Revenue (Million), by Country 2024 & 2032
- Figure 64: Latin America Wearable Gears and Sports Equipment Market Volume (K Unit), by Country 2024 & 2032
- Figure 65: Latin America Wearable Gears and Sports Equipment Market Revenue Share (%), by Country 2024 & 2032
- Figure 66: Latin America Wearable Gears and Sports Equipment Market Volume Share (%), by Country 2024 & 2032
List of Tables
- Table 1: Global Wearable Gears and Sports Equipment Market Revenue Million Forecast, by Region 2019 & 2032
- Table 2: Global Wearable Gears and Sports Equipment Market Volume K Unit Forecast, by Region 2019 & 2032
- Table 3: Global Wearable Gears and Sports Equipment Market Revenue Million Forecast, by Device Type 2019 & 2032
- Table 4: Global Wearable Gears and Sports Equipment Market Volume K Unit Forecast, by Device Type 2019 & 2032
- Table 5: Global Wearable Gears and Sports Equipment Market Revenue Million Forecast, by Region 2019 & 2032
- Table 6: Global Wearable Gears and Sports Equipment Market Volume K Unit Forecast, by Region 2019 & 2032
- Table 7: Global Wearable Gears and Sports Equipment Market Revenue Million Forecast, by Country 2019 & 2032
- Table 8: Global Wearable Gears and Sports Equipment Market Volume K Unit Forecast, by Country 2019 & 2032
- Table 9: United States Wearable Gears and Sports Equipment Market Revenue (Million) Forecast, by Application 2019 & 2032
- Table 10: United States Wearable Gears and Sports Equipment Market Volume (K Unit) Forecast, by Application 2019 & 2032
- Table 11: Canada Wearable Gears and Sports Equipment Market Revenue (Million) Forecast, by Application 2019 & 2032
- Table 12: Canada Wearable Gears and Sports Equipment Market Volume (K Unit) Forecast, by Application 2019 & 2032
- Table 13: Mexico Wearable Gears and Sports Equipment Market Revenue (Million) Forecast, by Application 2019 & 2032
- Table 14: Mexico Wearable Gears and Sports Equipment Market Volume (K Unit) Forecast, by Application 2019 & 2032
- Table 15: Global Wearable Gears and Sports Equipment Market Revenue Million Forecast, by Country 2019 & 2032
- Table 16: Global Wearable Gears and Sports Equipment Market Volume K Unit Forecast, by Country 2019 & 2032
- Table 17: Germany Wearable Gears and Sports Equipment Market Revenue (Million) Forecast, by Application 2019 & 2032
- Table 18: Germany Wearable Gears and Sports Equipment Market Volume (K Unit) Forecast, by Application 2019 & 2032
- Table 19: United Kingdom Wearable Gears and Sports Equipment Market Revenue (Million) Forecast, by Application 2019 & 2032
- Table 20: United Kingdom Wearable Gears and Sports Equipment Market Volume (K Unit) Forecast, by Application 2019 & 2032
- Table 21: France Wearable Gears and Sports Equipment Market Revenue (Million) Forecast, by Application 2019 & 2032
- Table 22: France Wearable Gears and Sports Equipment Market Volume (K Unit) Forecast, by Application 2019 & 2032
- Table 23: Spain Wearable Gears and Sports Equipment Market Revenue (Million) Forecast, by Application 2019 & 2032
- Table 24: Spain Wearable Gears and Sports Equipment Market Volume (K Unit) Forecast, by Application 2019 & 2032
- Table 25: Italy Wearable Gears and Sports Equipment Market Revenue (Million) Forecast, by Application 2019 & 2032
- Table 26: Italy Wearable Gears and Sports Equipment Market Volume (K Unit) Forecast, by Application 2019 & 2032
- Table 27: Spain Wearable Gears and Sports Equipment Market Revenue (Million) Forecast, by Application 2019 & 2032
- Table 28: Spain Wearable Gears and Sports Equipment Market Volume (K Unit) Forecast, by Application 2019 & 2032
- Table 29: Belgium Wearable Gears and Sports Equipment Market Revenue (Million) Forecast, by Application 2019 & 2032
- Table 30: Belgium Wearable Gears and Sports Equipment Market Volume (K Unit) Forecast, by Application 2019 & 2032
- Table 31: Netherland Wearable Gears and Sports Equipment Market Revenue (Million) Forecast, by Application 2019 & 2032
- Table 32: Netherland Wearable Gears and Sports Equipment Market Volume (K Unit) Forecast, by Application 2019 & 2032
- Table 33: Nordics Wearable Gears and Sports Equipment Market Revenue (Million) Forecast, by Application 2019 & 2032
- Table 34: Nordics Wearable Gears and Sports Equipment Market Volume (K Unit) Forecast, by Application 2019 & 2032
- Table 35: Rest of Europe Wearable Gears and Sports Equipment Market Revenue (Million) Forecast, by Application 2019 & 2032
- Table 36: Rest of Europe Wearable Gears and Sports Equipment Market Volume (K Unit) Forecast, by Application 2019 & 2032
- Table 37: Global Wearable Gears and Sports Equipment Market Revenue Million Forecast, by Country 2019 & 2032
- Table 38: Global Wearable Gears and Sports Equipment Market Volume K Unit Forecast, by Country 2019 & 2032
- Table 39: China Wearable Gears and Sports Equipment Market Revenue (Million) Forecast, by Application 2019 & 2032
- Table 40: China Wearable Gears and Sports Equipment Market Volume (K Unit) Forecast, by Application 2019 & 2032
- Table 41: Japan Wearable Gears and Sports Equipment Market Revenue (Million) Forecast, by Application 2019 & 2032
- Table 42: Japan Wearable Gears and Sports Equipment Market Volume (K Unit) Forecast, by Application 2019 & 2032
- Table 43: India Wearable Gears and Sports Equipment Market Revenue (Million) Forecast, by Application 2019 & 2032
- Table 44: India Wearable Gears and Sports Equipment Market Volume (K Unit) Forecast, by Application 2019 & 2032
- Table 45: South Korea Wearable Gears and Sports Equipment Market Revenue (Million) Forecast, by Application 2019 & 2032
- Table 46: South Korea Wearable Gears and Sports Equipment Market Volume (K Unit) Forecast, by Application 2019 & 2032
- Table 47: Southeast Asia Wearable Gears and Sports Equipment Market Revenue (Million) Forecast, by Application 2019 & 2032
- Table 48: Southeast Asia Wearable Gears and Sports Equipment Market Volume (K Unit) Forecast, by Application 2019 & 2032
- Table 49: Australia Wearable Gears and Sports Equipment Market Revenue (Million) Forecast, by Application 2019 & 2032
- Table 50: Australia Wearable Gears and Sports Equipment Market Volume (K Unit) Forecast, by Application 2019 & 2032
- Table 51: Indonesia Wearable Gears and Sports Equipment Market Revenue (Million) Forecast, by Application 2019 & 2032
- Table 52: Indonesia Wearable Gears and Sports Equipment Market Volume (K Unit) Forecast, by Application 2019 & 2032
- Table 53: Phillipes Wearable Gears and Sports Equipment Market Revenue (Million) Forecast, by Application 2019 & 2032
- Table 54: Phillipes Wearable Gears and Sports Equipment Market Volume (K Unit) Forecast, by Application 2019 & 2032
- Table 55: Singapore Wearable Gears and Sports Equipment Market Revenue (Million) Forecast, by Application 2019 & 2032
- Table 56: Singapore Wearable Gears and Sports Equipment Market Volume (K Unit) Forecast, by Application 2019 & 2032
- Table 57: Thailandc Wearable Gears and Sports Equipment Market Revenue (Million) Forecast, by Application 2019 & 2032
- Table 58: Thailandc Wearable Gears and Sports Equipment Market Volume (K Unit) Forecast, by Application 2019 & 2032
- Table 59: Rest of Asia Pacific Wearable Gears and Sports Equipment Market Revenue (Million) Forecast, by Application 2019 & 2032
- Table 60: Rest of Asia Pacific Wearable Gears and Sports Equipment Market Volume (K Unit) Forecast, by Application 2019 & 2032
- Table 61: Global Wearable Gears and Sports Equipment Market Revenue Million Forecast, by Country 2019 & 2032
- Table 62: Global Wearable Gears and Sports Equipment Market Volume K Unit Forecast, by Country 2019 & 2032
- Table 63: Brazil Wearable Gears and Sports Equipment Market Revenue (Million) Forecast, by Application 2019 & 2032
- Table 64: Brazil Wearable Gears and Sports Equipment Market Volume (K Unit) Forecast, by Application 2019 & 2032
- Table 65: Argentina Wearable Gears and Sports Equipment Market Revenue (Million) Forecast, by Application 2019 & 2032
- Table 66: Argentina Wearable Gears and Sports Equipment Market Volume (K Unit) Forecast, by Application 2019 & 2032
- Table 67: Peru Wearable Gears and Sports Equipment Market Revenue (Million) Forecast, by Application 2019 & 2032
- Table 68: Peru Wearable Gears and Sports Equipment Market Volume (K Unit) Forecast, by Application 2019 & 2032
- Table 69: Chile Wearable Gears and Sports Equipment Market Revenue (Million) Forecast, by Application 2019 & 2032
- Table 70: Chile Wearable Gears and Sports Equipment Market Volume (K Unit) Forecast, by Application 2019 & 2032
- Table 71: Colombia Wearable Gears and Sports Equipment Market Revenue (Million) Forecast, by Application 2019 & 2032
- Table 72: Colombia Wearable Gears and Sports Equipment Market Volume (K Unit) Forecast, by Application 2019 & 2032
- Table 73: Ecuador Wearable Gears and Sports Equipment Market Revenue (Million) Forecast, by Application 2019 & 2032
- Table 74: Ecuador Wearable Gears and Sports Equipment Market Volume (K Unit) Forecast, by Application 2019 & 2032
- Table 75: Venezuela Wearable Gears and Sports Equipment Market Revenue (Million) Forecast, by Application 2019 & 2032
- Table 76: Venezuela Wearable Gears and Sports Equipment Market Volume (K Unit) Forecast, by Application 2019 & 2032
- Table 77: Rest of South America Wearable Gears and Sports Equipment Market Revenue (Million) Forecast, by Application 2019 & 2032
- Table 78: Rest of South America Wearable Gears and Sports Equipment Market Volume (K Unit) Forecast, by Application 2019 & 2032
- Table 79: Global Wearable Gears and Sports Equipment Market Revenue Million Forecast, by Country 2019 & 2032
- Table 80: Global Wearable Gears and Sports Equipment Market Volume K Unit Forecast, by Country 2019 & 2032
- Table 81: United States Wearable Gears and Sports Equipment Market Revenue (Million) Forecast, by Application 2019 & 2032
- Table 82: United States Wearable Gears and Sports Equipment Market Volume (K Unit) Forecast, by Application 2019 & 2032
- Table 83: Canada Wearable Gears and Sports Equipment Market Revenue (Million) Forecast, by Application 2019 & 2032
- Table 84: Canada Wearable Gears and Sports Equipment Market Volume (K Unit) Forecast, by Application 2019 & 2032
- Table 85: Mexico Wearable Gears and Sports Equipment Market Revenue (Million) Forecast, by Application 2019 & 2032
- Table 86: Mexico Wearable Gears and Sports Equipment Market Volume (K Unit) Forecast, by Application 2019 & 2032
- Table 87: Global Wearable Gears and Sports Equipment Market Revenue Million Forecast, by Country 2019 & 2032
- Table 88: Global Wearable Gears and Sports Equipment Market Volume K Unit Forecast, by Country 2019 & 2032
- Table 89: United Arab Emirates Wearable Gears and Sports Equipment Market Revenue (Million) Forecast, by Application 2019 & 2032
- Table 90: United Arab Emirates Wearable Gears and Sports Equipment Market Volume (K Unit) Forecast, by Application 2019 & 2032
- Table 91: Saudi Arabia Wearable Gears and Sports Equipment Market Revenue (Million) Forecast, by Application 2019 & 2032
- Table 92: Saudi Arabia Wearable Gears and Sports Equipment Market Volume (K Unit) Forecast, by Application 2019 & 2032
- Table 93: South Africa Wearable Gears and Sports Equipment Market Revenue (Million) Forecast, by Application 2019 & 2032
- Table 94: South Africa Wearable Gears and Sports Equipment Market Volume (K Unit) Forecast, by Application 2019 & 2032
- Table 95: Rest of Middle East and Africa Wearable Gears and Sports Equipment Market Revenue (Million) Forecast, by Application 2019 & 2032
- Table 96: Rest of Middle East and Africa Wearable Gears and Sports Equipment Market Volume (K Unit) Forecast, by Application 2019 & 2032
- Table 97: Global Wearable Gears and Sports Equipment Market Revenue Million Forecast, by Device Type 2019 & 2032
- Table 98: Global Wearable Gears and Sports Equipment Market Volume K Unit Forecast, by Device Type 2019 & 2032
- Table 99: Global Wearable Gears and Sports Equipment Market Revenue Million Forecast, by Country 2019 & 2032
- Table 100: Global Wearable Gears and Sports Equipment Market Volume K Unit Forecast, by Country 2019 & 2032
- Table 101: Global Wearable Gears and Sports Equipment Market Revenue Million Forecast, by Device Type 2019 & 2032
- Table 102: Global Wearable Gears and Sports Equipment Market Volume K Unit Forecast, by Device Type 2019 & 2032
- Table 103: Global Wearable Gears and Sports Equipment Market Revenue Million Forecast, by Country 2019 & 2032
- Table 104: Global Wearable Gears and Sports Equipment Market Volume K Unit Forecast, by Country 2019 & 2032
- Table 105: Global Wearable Gears and Sports Equipment Market Revenue Million Forecast, by Device Type 2019 & 2032
- Table 106: Global Wearable Gears and Sports Equipment Market Volume K Unit Forecast, by Device Type 2019 & 2032
- Table 107: Global Wearable Gears and Sports Equipment Market Revenue Million Forecast, by Country 2019 & 2032
- Table 108: Global Wearable Gears and Sports Equipment Market Volume K Unit Forecast, by Country 2019 & 2032
- Table 109: Global Wearable Gears and Sports Equipment Market Revenue Million Forecast, by Device Type 2019 & 2032
- Table 110: Global Wearable Gears and Sports Equipment Market Volume K Unit Forecast, by Device Type 2019 & 2032
- Table 111: Global Wearable Gears and Sports Equipment Market Revenue Million Forecast, by Country 2019 & 2032
- Table 112: Global Wearable Gears and Sports Equipment Market Volume K Unit Forecast, by Country 2019 & 2032
- Table 113: Global Wearable Gears and Sports Equipment Market Revenue Million Forecast, by Device Type 2019 & 2032
- Table 114: Global Wearable Gears and Sports Equipment Market Volume K Unit Forecast, by Device Type 2019 & 2032
- Table 115: Global Wearable Gears and Sports Equipment Market Revenue Million Forecast, by Country 2019 & 2032
- Table 116: Global Wearable Gears and Sports Equipment Market Volume K Unit Forecast, by Country 2019 & 2032
Frequently Asked Questions
1. What is the projected Compound Annual Growth Rate (CAGR) of the Wearable Gears and Sports Equipment Market?
The projected CAGR is approximately 4.18%.
2. Which companies are prominent players in the Wearable Gears and Sports Equipment Market?
Key companies in the market include ShotTracker Inc, Zepp US Inc, Garmin Ltd, EXELIO SRL(GPEXE), GPSports Systems(Catapult), List not Exhaustive, STATSports Group, Catapult Sports Pty Ltd, Kinexon GmbH, Sensoria Inc.
3. What are the main segments of the Wearable Gears and Sports Equipment Market?
The market segments include Device Type.
4. Can you provide details about the market size?
The market size is estimated to be USD 90.39 Million as of 2022.
5. What are some drivers contributing to market growth?
Growing Demand for Data-Driven Decisions and Operations; Increasing Sports Events. Online and Offline; Portable and Convenient Usage.
6. What are the notable trends driving market growth?
Smart Clothing Device Type Segment is Expected to Hold Significant Market Share.
7. Are there any restraints impacting market growth?
High Initial Investment and Budget Constraints.
8. Can you provide examples of recent developments in the market?
January 2023: Garmin India, a unit of Garmin Ltd., announced the introduction of the Instinct Crossover and Instinct Crossover Solar in India, the newest and most innovative additions to the popular Instinct series of durable, purpose-built GPS multisport smartwatches.
9. What pricing options are available for accessing the report?
Pricing options include single-user, multi-user, and enterprise licenses priced at USD 4750, USD 5250, and USD 8750 respectively.
10. Is the market size provided in terms of value or volume?
The market size is provided in terms of value, measured in Million and volume, measured in K Unit.
11. Are there any specific market keywords associated with the report?
Yes, the market keyword associated with the report is "Wearable Gears and Sports Equipment Market," which aids in identifying and referencing the specific market segment covered.
12. How do I determine which pricing option suits my needs best?
The pricing options vary based on user requirements and access needs. Individual users may opt for single-user licenses, while businesses requiring broader access may choose multi-user or enterprise licenses for cost-effective access to the report.
13. Are there any additional resources or data provided in the Wearable Gears and Sports Equipment Market report?
While the report offers comprehensive insights, it's advisable to review the specific contents or supplementary materials provided to ascertain if additional resources or data are available.
14. How can I stay updated on further developments or reports in the Wearable Gears and Sports Equipment Market?
To stay informed about further developments, trends, and reports in the Wearable Gears and Sports Equipment Market, consider subscribing to industry newsletters, following relevant companies and organizations, or regularly checking reputable industry news sources and publications.
Methodology
Step 1 - Identification of Relevant Samples Size from Population Database


Step 2 - Approaches for Defining Global Market Size (Value, Volume* & Price*)

Note*: In applicable scenarios
Step 3 - Data Sources
Primary Research
- Web Analytics
- Survey Reports
- Research Institute
- Latest Research Reports
- Opinion Leaders
Secondary Research
- Annual Reports
- White Paper
- Latest Press Release
- Industry Association
- Paid Database
- Investor Presentations

Step 4 - Data Triangulation
Involves using different sources of information in order to increase the validity of a study
These sources are likely to be stakeholders in a program - participants, other researchers, program staff, other community members, and so on.
Then we put all data in single framework & apply various statistical tools to find out the dynamic on the market.
During the analysis stage, feedback from the stakeholder groups would be compared to determine areas of agreement as well as areas of divergence


