
Key Insights
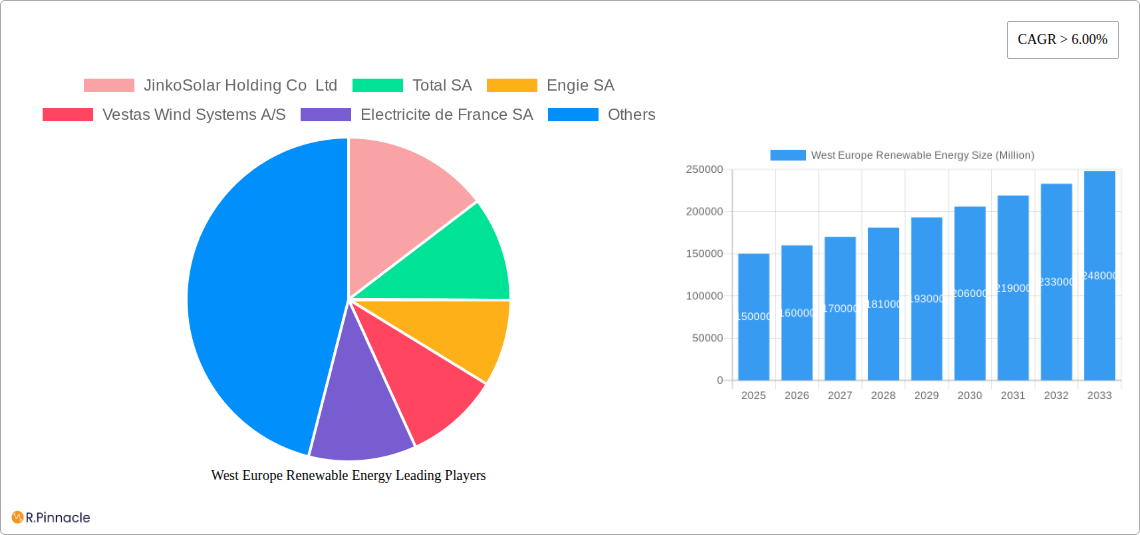
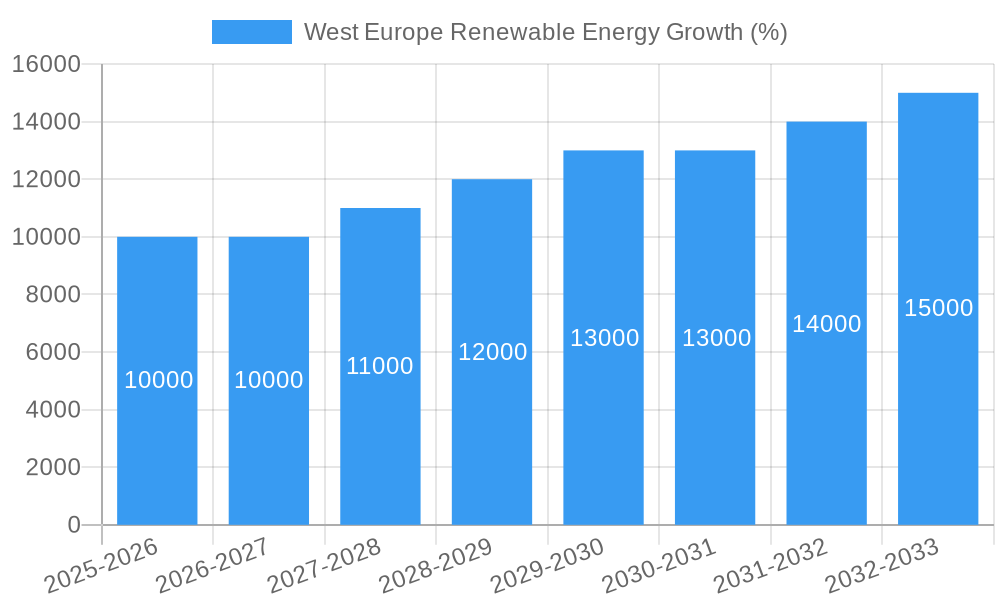
The West European renewable energy market, encompassing solar, wind, bioenergy, and other sources, is experiencing robust growth, projected to maintain a Compound Annual Growth Rate (CAGR) exceeding 6% from 2025 to 2033. This expansion is fueled by several key drivers. Stringent environmental regulations across the region are pushing a transition away from fossil fuels, incentivizing investment in cleaner energy solutions. Furthermore, increasing energy prices and concerns about energy security are boosting the appeal of renewable energy sources. Technological advancements, particularly in solar panel efficiency and wind turbine capacity, are also contributing to lower costs and increased adoption. Germany, France, and the United Kingdom remain the largest markets within West Europe, driven by substantial government support programs, significant investments in renewable infrastructure, and ambitious renewable energy targets. However, the market faces challenges, including intermittent energy supply from sources like solar and wind, requiring further investment in smart grids and energy storage solutions. Land-use constraints and public acceptance in certain areas may also pose restraints on future expansion. The diverse range of renewable energy sources and the spread of innovation across multiple countries indicate a dynamic and continuously evolving market.
The market segmentation reveals strong performance across all major sources. Wind energy is likely to remain a significant contributor due to substantial offshore wind potential and established onshore capacity. Solar power is expected to experience rapid growth driven by decreasing installation costs and supportive policies. Bioenergy, while a smaller segment, contributes to diversification and energy security. The "Other Sources" category encompasses emerging technologies like geothermal and tidal power, which although currently smaller, have the potential to significantly contribute to long-term growth. Considering the geographic distribution, Germany's strong commitment to renewable energy, coupled with its technological prowess, likely positions it as a leading market within the region. The UK and France are anticipated to follow closely, with substantial growth also predicted across other West European nations as policies and technology continue to develop. The competitive landscape includes major international players like Total, Engie, Vestas, and Siemens Gamesa, alongside regional companies specialized in renewable energy development and installation. These companies, driven by the market's growth potential, continue to invest in research and development, project development, and market expansion within the region.
West Europe Renewable Energy Market Report: 2019-2033
This comprehensive report provides an in-depth analysis of the West Europe renewable energy market, covering the period from 2019 to 2033. It offers invaluable insights for industry professionals, investors, and policymakers seeking to understand the market's dynamics, growth drivers, and future potential. With a focus on key segments like solar, wind, bioenergy, and other sources across the UK, Germany, France, Ireland, and the rest of West Europe, this report delivers actionable intelligence for strategic decision-making.
West Europe Renewable Energy Market Structure & Innovation Trends
This section analyzes the competitive landscape of the West Europe renewable energy market, examining market concentration, innovation drivers, regulatory frameworks, and M&A activities from 2019-2024. We delve into the market share of key players like JinkoSolar Holding Co Ltd, Total SA, Engie SA, and others, and quantify M&A deal values, revealing the key trends shaping the market structure.
- Market Concentration: Analysis of market share held by top 5 players, revealing the level of competition and potential for consolidation. (xx% market share for top 5 players in 2024).
- Innovation Drivers: Examination of factors driving innovation, including government policies, technological advancements, and consumer demand for sustainable energy.
- Regulatory Frameworks: Assessment of the impact of policies and regulations on market growth and investment in renewable energy technologies.
- Product Substitutes: Analysis of substitute energy sources and their impact on the renewable energy market.
- End-User Demographics: Understanding the diverse end-users of renewable energy and their influence on market demand.
- M&A Activities: Review of mergers and acquisitions in the sector, highlighting deal values and strategic implications (xx Million in M&A deal value in 2024).
West Europe Renewable Energy Market Dynamics & Trends
This section explores the key market dynamics and trends influencing the West Europe renewable energy market's growth trajectory from 2019-2033. We analyze market growth drivers, technological disruptions, consumer preferences, and competitive dynamics, supported by detailed metrics such as the Compound Annual Growth Rate (CAGR) and market penetration rates.
This in-depth analysis examines the interplay of factors such as governmental incentives, technological breakthroughs (e.g., advancements in solar panel efficiency, wind turbine technology), shifting consumer attitudes toward sustainability, and the increasing competitiveness within the industry driving market expansion and innovation. Specific projections regarding market penetration and CAGR for various technologies and segments are included, providing a comprehensive overview of the market's anticipated trajectory. (Projected CAGR of xx% from 2025-2033).
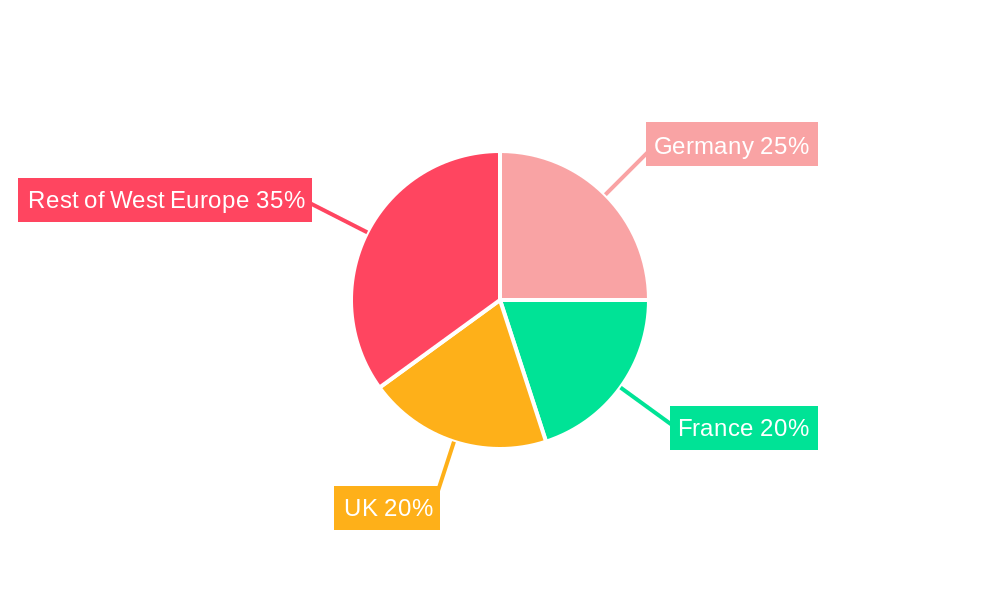
Dominant Regions & Segments in West Europe Renewable Energy
This section identifies the leading regions and segments within the West Europe renewable energy market, examining the factors that have contributed to their dominance. Analysis includes a detailed examination of the UK, Germany, France, Ireland, and the rest of West Europe, broken down by renewable energy source (solar, wind, bioenergy, and other).
Leading Region: Germany (projected to maintain its lead due to strong policy support and established infrastructure).
Dominant Segment: Wind energy (expected to dominate due to significant offshore wind capacity and supportive government initiatives).
Key Drivers (Germany): Strong government support for renewable energy through subsidies and feed-in tariffs; well-established grid infrastructure; and a large industrial base.
Key Drivers (UK): Focus on offshore wind development; government targets for renewable energy generation; and robust investment in renewable energy projects.
Key Drivers (France): Growing focus on offshore wind; strong government support for renewable energy development; and government tenders for new wind farms (e.g., the 2.5 GW tender announced in December 2022).
West Europe Renewable Energy Product Innovations
This section summarizes recent product developments, applications, and competitive advantages within the West Europe renewable energy market, emphasizing technological advancements and their impact on market competitiveness. This overview focuses on emerging technologies that are enhancing efficiency, reducing costs, and improving the overall sustainability of renewable energy systems.
Report Scope & Segmentation Analysis
This report segments the West Europe renewable energy market by source (Solar, Wind, Bioenergy, Other Sources) and geography (The United Kingdom, Germany, France, Ireland, Rest of West Europe). Each segment's growth projections, market size (in Millions), and competitive dynamics are detailed, offering a granular understanding of the market's composition and future trajectory. The analysis includes projections for market size and growth for each segment for the forecast period (2025-2033). (e.g., Solar energy market in Germany projected to reach xx Million by 2033).
Key Drivers of West Europe Renewable Energy Growth
This section outlines the key factors driving the growth of the West Europe renewable energy market. It focuses on technological advancements (e.g., improved efficiency of solar panels and wind turbines), supportive government policies and regulations (e.g., subsidies, tax incentives, renewable portfolio standards), and increasing consumer demand for sustainable energy.
Challenges in the West Europe Renewable Energy Sector
This section discusses the key barriers and restraints facing the West Europe renewable energy sector. It addresses challenges such as intermittency issues, grid infrastructure limitations, regulatory hurdles, supply chain disruptions, and land-use constraints. The analysis also quantifies the impact of these challenges on market growth and investment.
Emerging Opportunities in West Europe Renewable Energy
This section highlights emerging opportunities within the West Europe renewable energy market. It focuses on growth areas such as offshore wind, energy storage solutions, green hydrogen production, and the integration of renewable energy into smart grids. The analysis considers factors such as technological innovation, policy changes, and evolving consumer preferences.
Leading Players in the West Europe Renewable Energy Market
- JinkoSolar Holding Co Ltd
- Total SA
- Engie SA
- Vestas Wind Systems A/S
- Electricite de France SA
- Siemens Gamesa Renewable Energy SA
- Renewable Energy Systems Ltd
- Ecotricity Group Ltd
- General Electric Company
Key Developments in West Europe Renewable Energy Industry
- December 2022: France launched tenders for two new offshore wind farms with a combined capacity of 2.5 GW. This signifies significant investment in offshore wind and strengthens France's commitment to renewable energy.
- April 2022: Voltalia commenced construction of the 3.7 MW Montclar solar power plant in France, highlighting the ongoing expansion of solar capacity in the region.
Future Outlook for West Europe Renewable Energy Market
The West Europe renewable energy market is poised for significant growth over the next decade, driven by supportive government policies, technological advancements, and increasing consumer demand for sustainable energy. The market is expected to experience substantial expansion, with opportunities arising in offshore wind, energy storage, and the integration of renewable energy into smart grids. The continued growth in the renewable energy sector will offer lucrative opportunities for investors and businesses involved in the industry.
West Europe Renewable Energy Segmentation
-
1. Source
- 1.1. Solar
- 1.2. Wind
- 1.3. Bioenergy
- 1.4. Other Sources
-
2. Geogrpahy
- 2.1. The United Kingdom
- 2.2. Germany
- 2.3. France
- 2.4. Ireland
- 2.5. Rest of West Europe
West Europe Renewable Energy Segmentation By Geography
-
1. North America
- 1.1. United States
- 1.2. Canada
- 1.3. Mexico
-
2. South America
- 2.1. Brazil
- 2.2. Argentina
- 2.3. Rest of South America
-
3. Europe
- 3.1. United Kingdom
- 3.2. Germany
- 3.3. France
- 3.4. Italy
- 3.5. Spain
- 3.6. Russia
- 3.7. Benelux
- 3.8. Nordics
- 3.9. Rest of Europe
-
4. Middle East & Africa
- 4.1. Turkey
- 4.2. Israel
- 4.3. GCC
- 4.4. North Africa
- 4.5. South Africa
- 4.6. Rest of Middle East & Africa
-
5. Asia Pacific
- 5.1. China
- 5.2. India
- 5.3. Japan
- 5.4. South Korea
- 5.5. ASEAN
- 5.6. Oceania
- 5.7. Rest of Asia Pacific
West Europe Renewable Energy REPORT HIGHLIGHTS
| Aspects | Details |
|---|---|
| Study Period | 2019-2033 |
| Base Year | 2024 |
| Estimated Year | 2025 |
| Forecast Period | 2025-2033 |
| Historical Period | 2019-2024 |
| Growth Rate | CAGR of > 6.00% from 2019-2033 |
| Segmentation |
|
Table of Contents
- 1. Introduction
- 1.1. Research Scope
- 1.2. Market Segmentation
- 1.3. Research Methodology
- 1.4. Definitions and Assumptions
- 2. Executive Summary
- 2.1. Introduction
- 3. Market Dynamics
- 3.1. Introduction
- 3.2. Market Drivers
- 3.2.1. 4.; Demand for Solar Photovoltaic Installations4.; Growing Investments
- 3.3. Market Restrains
- 3.3.1. 4.; Increasing Wind Energy Installations
- 3.4. Market Trends
- 3.4.1. Wind Energy to Witness Significant Growth
- 4. Market Factor Analysis
- 4.1. Porters Five Forces
- 4.2. Supply/Value Chain
- 4.3. PESTEL analysis
- 4.4. Market Entropy
- 4.5. Patent/Trademark Analysis
- 5. Global West Europe Renewable Energy Analysis, Insights and Forecast, 2019-2031
- 5.1. Market Analysis, Insights and Forecast - by Source
- 5.1.1. Solar
- 5.1.2. Wind
- 5.1.3. Bioenergy
- 5.1.4. Other Sources
- 5.2. Market Analysis, Insights and Forecast - by Geogrpahy
- 5.2.1. The United Kingdom
- 5.2.2. Germany
- 5.2.3. France
- 5.2.4. Ireland
- 5.2.5. Rest of West Europe
- 5.3. Market Analysis, Insights and Forecast - by Region
- 5.3.1. North America
- 5.3.2. South America
- 5.3.3. Europe
- 5.3.4. Middle East & Africa
- 5.3.5. Asia Pacific
- 5.1. Market Analysis, Insights and Forecast - by Source
- 6. North America West Europe Renewable Energy Analysis, Insights and Forecast, 2019-2031
- 6.1. Market Analysis, Insights and Forecast - by Source
- 6.1.1. Solar
- 6.1.2. Wind
- 6.1.3. Bioenergy
- 6.1.4. Other Sources
- 6.2. Market Analysis, Insights and Forecast - by Geogrpahy
- 6.2.1. The United Kingdom
- 6.2.2. Germany
- 6.2.3. France
- 6.2.4. Ireland
- 6.2.5. Rest of West Europe
- 6.1. Market Analysis, Insights and Forecast - by Source
- 7. South America West Europe Renewable Energy Analysis, Insights and Forecast, 2019-2031
- 7.1. Market Analysis, Insights and Forecast - by Source
- 7.1.1. Solar
- 7.1.2. Wind
- 7.1.3. Bioenergy
- 7.1.4. Other Sources
- 7.2. Market Analysis, Insights and Forecast - by Geogrpahy
- 7.2.1. The United Kingdom
- 7.2.2. Germany
- 7.2.3. France
- 7.2.4. Ireland
- 7.2.5. Rest of West Europe
- 7.1. Market Analysis, Insights and Forecast - by Source
- 8. Europe West Europe Renewable Energy Analysis, Insights and Forecast, 2019-2031
- 8.1. Market Analysis, Insights and Forecast - by Source
- 8.1.1. Solar
- 8.1.2. Wind
- 8.1.3. Bioenergy
- 8.1.4. Other Sources
- 8.2. Market Analysis, Insights and Forecast - by Geogrpahy
- 8.2.1. The United Kingdom
- 8.2.2. Germany
- 8.2.3. France
- 8.2.4. Ireland
- 8.2.5. Rest of West Europe
- 8.1. Market Analysis, Insights and Forecast - by Source
- 9. Middle East & Africa West Europe Renewable Energy Analysis, Insights and Forecast, 2019-2031
- 9.1. Market Analysis, Insights and Forecast - by Source
- 9.1.1. Solar
- 9.1.2. Wind
- 9.1.3. Bioenergy
- 9.1.4. Other Sources
- 9.2. Market Analysis, Insights and Forecast - by Geogrpahy
- 9.2.1. The United Kingdom
- 9.2.2. Germany
- 9.2.3. France
- 9.2.4. Ireland
- 9.2.5. Rest of West Europe
- 9.1. Market Analysis, Insights and Forecast - by Source
- 10. Asia Pacific West Europe Renewable Energy Analysis, Insights and Forecast, 2019-2031
- 10.1. Market Analysis, Insights and Forecast - by Source
- 10.1.1. Solar
- 10.1.2. Wind
- 10.1.3. Bioenergy
- 10.1.4. Other Sources
- 10.2. Market Analysis, Insights and Forecast - by Geogrpahy
- 10.2.1. The United Kingdom
- 10.2.2. Germany
- 10.2.3. France
- 10.2.4. Ireland
- 10.2.5. Rest of West Europe
- 10.1. Market Analysis, Insights and Forecast - by Source
- 11. Germany West Europe Renewable Energy Analysis, Insights and Forecast, 2019-2031
- 12. France West Europe Renewable Energy Analysis, Insights and Forecast, 2019-2031
- 13. Italy West Europe Renewable Energy Analysis, Insights and Forecast, 2019-2031
- 14. United Kingdom West Europe Renewable Energy Analysis, Insights and Forecast, 2019-2031
- 15. Netherlands West Europe Renewable Energy Analysis, Insights and Forecast, 2019-2031
- 16. Sweden West Europe Renewable Energy Analysis, Insights and Forecast, 2019-2031
- 17. Rest of Europe West Europe Renewable Energy Analysis, Insights and Forecast, 2019-2031
- 18. Competitive Analysis
- 18.1. Global Market Share Analysis 2024
- 18.2. Company Profiles
- 18.2.1 JinkoSolar Holding Co Ltd
- 18.2.1.1. Overview
- 18.2.1.2. Products
- 18.2.1.3. SWOT Analysis
- 18.2.1.4. Recent Developments
- 18.2.1.5. Financials (Based on Availability)
- 18.2.2 Total SA
- 18.2.2.1. Overview
- 18.2.2.2. Products
- 18.2.2.3. SWOT Analysis
- 18.2.2.4. Recent Developments
- 18.2.2.5. Financials (Based on Availability)
- 18.2.3 Engie SA
- 18.2.3.1. Overview
- 18.2.3.2. Products
- 18.2.3.3. SWOT Analysis
- 18.2.3.4. Recent Developments
- 18.2.3.5. Financials (Based on Availability)
- 18.2.4 Vestas Wind Systems A/S
- 18.2.4.1. Overview
- 18.2.4.2. Products
- 18.2.4.3. SWOT Analysis
- 18.2.4.4. Recent Developments
- 18.2.4.5. Financials (Based on Availability)
- 18.2.5 Electricite de France SA
- 18.2.5.1. Overview
- 18.2.5.2. Products
- 18.2.5.3. SWOT Analysis
- 18.2.5.4. Recent Developments
- 18.2.5.5. Financials (Based on Availability)
- 18.2.6 Siemens Gamesa Renewable Energy SA
- 18.2.6.1. Overview
- 18.2.6.2. Products
- 18.2.6.3. SWOT Analysis
- 18.2.6.4. Recent Developments
- 18.2.6.5. Financials (Based on Availability)
- 18.2.7 Renewable Energy Systems Ltd
- 18.2.7.1. Overview
- 18.2.7.2. Products
- 18.2.7.3. SWOT Analysis
- 18.2.7.4. Recent Developments
- 18.2.7.5. Financials (Based on Availability)
- 18.2.8 Ecotricity Group Ltd
- 18.2.8.1. Overview
- 18.2.8.2. Products
- 18.2.8.3. SWOT Analysis
- 18.2.8.4. Recent Developments
- 18.2.8.5. Financials (Based on Availability)
- 18.2.9 General Electric Company
- 18.2.9.1. Overview
- 18.2.9.2. Products
- 18.2.9.3. SWOT Analysis
- 18.2.9.4. Recent Developments
- 18.2.9.5. Financials (Based on Availability)
- 18.2.1 JinkoSolar Holding Co Ltd
List of Figures
- Figure 1: Global West Europe Renewable Energy Revenue Breakdown (Million, %) by Region 2024 & 2032
- Figure 2: Global West Europe Renewable Energy Volume Breakdown (Gigawatte, %) by Region 2024 & 2032
- Figure 3: Europe West Europe Renewable Energy Revenue (Million), by Country 2024 & 2032
- Figure 4: Europe West Europe Renewable Energy Volume (Gigawatte), by Country 2024 & 2032
- Figure 5: Europe West Europe Renewable Energy Revenue Share (%), by Country 2024 & 2032
- Figure 6: Europe West Europe Renewable Energy Volume Share (%), by Country 2024 & 2032
- Figure 7: North America West Europe Renewable Energy Revenue (Million), by Source 2024 & 2032
- Figure 8: North America West Europe Renewable Energy Volume (Gigawatte), by Source 2024 & 2032
- Figure 9: North America West Europe Renewable Energy Revenue Share (%), by Source 2024 & 2032
- Figure 10: North America West Europe Renewable Energy Volume Share (%), by Source 2024 & 2032
- Figure 11: North America West Europe Renewable Energy Revenue (Million), by Geogrpahy 2024 & 2032
- Figure 12: North America West Europe Renewable Energy Volume (Gigawatte), by Geogrpahy 2024 & 2032
- Figure 13: North America West Europe Renewable Energy Revenue Share (%), by Geogrpahy 2024 & 2032
- Figure 14: North America West Europe Renewable Energy Volume Share (%), by Geogrpahy 2024 & 2032
- Figure 15: North America West Europe Renewable Energy Revenue (Million), by Country 2024 & 2032
- Figure 16: North America West Europe Renewable Energy Volume (Gigawatte), by Country 2024 & 2032
- Figure 17: North America West Europe Renewable Energy Revenue Share (%), by Country 2024 & 2032
- Figure 18: North America West Europe Renewable Energy Volume Share (%), by Country 2024 & 2032
- Figure 19: South America West Europe Renewable Energy Revenue (Million), by Source 2024 & 2032
- Figure 20: South America West Europe Renewable Energy Volume (Gigawatte), by Source 2024 & 2032
- Figure 21: South America West Europe Renewable Energy Revenue Share (%), by Source 2024 & 2032
- Figure 22: South America West Europe Renewable Energy Volume Share (%), by Source 2024 & 2032
- Figure 23: South America West Europe Renewable Energy Revenue (Million), by Geogrpahy 2024 & 2032
- Figure 24: South America West Europe Renewable Energy Volume (Gigawatte), by Geogrpahy 2024 & 2032
- Figure 25: South America West Europe Renewable Energy Revenue Share (%), by Geogrpahy 2024 & 2032
- Figure 26: South America West Europe Renewable Energy Volume Share (%), by Geogrpahy 2024 & 2032
- Figure 27: South America West Europe Renewable Energy Revenue (Million), by Country 2024 & 2032
- Figure 28: South America West Europe Renewable Energy Volume (Gigawatte), by Country 2024 & 2032
- Figure 29: South America West Europe Renewable Energy Revenue Share (%), by Country 2024 & 2032
- Figure 30: South America West Europe Renewable Energy Volume Share (%), by Country 2024 & 2032
- Figure 31: Europe West Europe Renewable Energy Revenue (Million), by Source 2024 & 2032
- Figure 32: Europe West Europe Renewable Energy Volume (Gigawatte), by Source 2024 & 2032
- Figure 33: Europe West Europe Renewable Energy Revenue Share (%), by Source 2024 & 2032
- Figure 34: Europe West Europe Renewable Energy Volume Share (%), by Source 2024 & 2032
- Figure 35: Europe West Europe Renewable Energy Revenue (Million), by Geogrpahy 2024 & 2032
- Figure 36: Europe West Europe Renewable Energy Volume (Gigawatte), by Geogrpahy 2024 & 2032
- Figure 37: Europe West Europe Renewable Energy Revenue Share (%), by Geogrpahy 2024 & 2032
- Figure 38: Europe West Europe Renewable Energy Volume Share (%), by Geogrpahy 2024 & 2032
- Figure 39: Europe West Europe Renewable Energy Revenue (Million), by Country 2024 & 2032
- Figure 40: Europe West Europe Renewable Energy Volume (Gigawatte), by Country 2024 & 2032
- Figure 41: Europe West Europe Renewable Energy Revenue Share (%), by Country 2024 & 2032
- Figure 42: Europe West Europe Renewable Energy Volume Share (%), by Country 2024 & 2032
- Figure 43: Middle East & Africa West Europe Renewable Energy Revenue (Million), by Source 2024 & 2032
- Figure 44: Middle East & Africa West Europe Renewable Energy Volume (Gigawatte), by Source 2024 & 2032
- Figure 45: Middle East & Africa West Europe Renewable Energy Revenue Share (%), by Source 2024 & 2032
- Figure 46: Middle East & Africa West Europe Renewable Energy Volume Share (%), by Source 2024 & 2032
- Figure 47: Middle East & Africa West Europe Renewable Energy Revenue (Million), by Geogrpahy 2024 & 2032
- Figure 48: Middle East & Africa West Europe Renewable Energy Volume (Gigawatte), by Geogrpahy 2024 & 2032
- Figure 49: Middle East & Africa West Europe Renewable Energy Revenue Share (%), by Geogrpahy 2024 & 2032
- Figure 50: Middle East & Africa West Europe Renewable Energy Volume Share (%), by Geogrpahy 2024 & 2032
- Figure 51: Middle East & Africa West Europe Renewable Energy Revenue (Million), by Country 2024 & 2032
- Figure 52: Middle East & Africa West Europe Renewable Energy Volume (Gigawatte), by Country 2024 & 2032
- Figure 53: Middle East & Africa West Europe Renewable Energy Revenue Share (%), by Country 2024 & 2032
- Figure 54: Middle East & Africa West Europe Renewable Energy Volume Share (%), by Country 2024 & 2032
- Figure 55: Asia Pacific West Europe Renewable Energy Revenue (Million), by Source 2024 & 2032
- Figure 56: Asia Pacific West Europe Renewable Energy Volume (Gigawatte), by Source 2024 & 2032
- Figure 57: Asia Pacific West Europe Renewable Energy Revenue Share (%), by Source 2024 & 2032
- Figure 58: Asia Pacific West Europe Renewable Energy Volume Share (%), by Source 2024 & 2032
- Figure 59: Asia Pacific West Europe Renewable Energy Revenue (Million), by Geogrpahy 2024 & 2032
- Figure 60: Asia Pacific West Europe Renewable Energy Volume (Gigawatte), by Geogrpahy 2024 & 2032
- Figure 61: Asia Pacific West Europe Renewable Energy Revenue Share (%), by Geogrpahy 2024 & 2032
- Figure 62: Asia Pacific West Europe Renewable Energy Volume Share (%), by Geogrpahy 2024 & 2032
- Figure 63: Asia Pacific West Europe Renewable Energy Revenue (Million), by Country 2024 & 2032
- Figure 64: Asia Pacific West Europe Renewable Energy Volume (Gigawatte), by Country 2024 & 2032
- Figure 65: Asia Pacific West Europe Renewable Energy Revenue Share (%), by Country 2024 & 2032
- Figure 66: Asia Pacific West Europe Renewable Energy Volume Share (%), by Country 2024 & 2032
List of Tables
- Table 1: Global West Europe Renewable Energy Revenue Million Forecast, by Region 2019 & 2032
- Table 2: Global West Europe Renewable Energy Volume Gigawatte Forecast, by Region 2019 & 2032
- Table 3: Global West Europe Renewable Energy Revenue Million Forecast, by Source 2019 & 2032
- Table 4: Global West Europe Renewable Energy Volume Gigawatte Forecast, by Source 2019 & 2032
- Table 5: Global West Europe Renewable Energy Revenue Million Forecast, by Geogrpahy 2019 & 2032
- Table 6: Global West Europe Renewable Energy Volume Gigawatte Forecast, by Geogrpahy 2019 & 2032
- Table 7: Global West Europe Renewable Energy Revenue Million Forecast, by Region 2019 & 2032
- Table 8: Global West Europe Renewable Energy Volume Gigawatte Forecast, by Region 2019 & 2032
- Table 9: Global West Europe Renewable Energy Revenue Million Forecast, by Country 2019 & 2032
- Table 10: Global West Europe Renewable Energy Volume Gigawatte Forecast, by Country 2019 & 2032
- Table 11: Germany West Europe Renewable Energy Revenue (Million) Forecast, by Application 2019 & 2032
- Table 12: Germany West Europe Renewable Energy Volume (Gigawatte) Forecast, by Application 2019 & 2032
- Table 13: France West Europe Renewable Energy Revenue (Million) Forecast, by Application 2019 & 2032
- Table 14: France West Europe Renewable Energy Volume (Gigawatte) Forecast, by Application 2019 & 2032
- Table 15: Italy West Europe Renewable Energy Revenue (Million) Forecast, by Application 2019 & 2032
- Table 16: Italy West Europe Renewable Energy Volume (Gigawatte) Forecast, by Application 2019 & 2032
- Table 17: United Kingdom West Europe Renewable Energy Revenue (Million) Forecast, by Application 2019 & 2032
- Table 18: United Kingdom West Europe Renewable Energy Volume (Gigawatte) Forecast, by Application 2019 & 2032
- Table 19: Netherlands West Europe Renewable Energy Revenue (Million) Forecast, by Application 2019 & 2032
- Table 20: Netherlands West Europe Renewable Energy Volume (Gigawatte) Forecast, by Application 2019 & 2032
- Table 21: Sweden West Europe Renewable Energy Revenue (Million) Forecast, by Application 2019 & 2032
- Table 22: Sweden West Europe Renewable Energy Volume (Gigawatte) Forecast, by Application 2019 & 2032
- Table 23: Rest of Europe West Europe Renewable Energy Revenue (Million) Forecast, by Application 2019 & 2032
- Table 24: Rest of Europe West Europe Renewable Energy Volume (Gigawatte) Forecast, by Application 2019 & 2032
- Table 25: Global West Europe Renewable Energy Revenue Million Forecast, by Source 2019 & 2032
- Table 26: Global West Europe Renewable Energy Volume Gigawatte Forecast, by Source 2019 & 2032
- Table 27: Global West Europe Renewable Energy Revenue Million Forecast, by Geogrpahy 2019 & 2032
- Table 28: Global West Europe Renewable Energy Volume Gigawatte Forecast, by Geogrpahy 2019 & 2032
- Table 29: Global West Europe Renewable Energy Revenue Million Forecast, by Country 2019 & 2032
- Table 30: Global West Europe Renewable Energy Volume Gigawatte Forecast, by Country 2019 & 2032
- Table 31: United States West Europe Renewable Energy Revenue (Million) Forecast, by Application 2019 & 2032
- Table 32: United States West Europe Renewable Energy Volume (Gigawatte) Forecast, by Application 2019 & 2032
- Table 33: Canada West Europe Renewable Energy Revenue (Million) Forecast, by Application 2019 & 2032
- Table 34: Canada West Europe Renewable Energy Volume (Gigawatte) Forecast, by Application 2019 & 2032
- Table 35: Mexico West Europe Renewable Energy Revenue (Million) Forecast, by Application 2019 & 2032
- Table 36: Mexico West Europe Renewable Energy Volume (Gigawatte) Forecast, by Application 2019 & 2032
- Table 37: Global West Europe Renewable Energy Revenue Million Forecast, by Source 2019 & 2032
- Table 38: Global West Europe Renewable Energy Volume Gigawatte Forecast, by Source 2019 & 2032
- Table 39: Global West Europe Renewable Energy Revenue Million Forecast, by Geogrpahy 2019 & 2032
- Table 40: Global West Europe Renewable Energy Volume Gigawatte Forecast, by Geogrpahy 2019 & 2032
- Table 41: Global West Europe Renewable Energy Revenue Million Forecast, by Country 2019 & 2032
- Table 42: Global West Europe Renewable Energy Volume Gigawatte Forecast, by Country 2019 & 2032
- Table 43: Brazil West Europe Renewable Energy Revenue (Million) Forecast, by Application 2019 & 2032
- Table 44: Brazil West Europe Renewable Energy Volume (Gigawatte) Forecast, by Application 2019 & 2032
- Table 45: Argentina West Europe Renewable Energy Revenue (Million) Forecast, by Application 2019 & 2032
- Table 46: Argentina West Europe Renewable Energy Volume (Gigawatte) Forecast, by Application 2019 & 2032
- Table 47: Rest of South America West Europe Renewable Energy Revenue (Million) Forecast, by Application 2019 & 2032
- Table 48: Rest of South America West Europe Renewable Energy Volume (Gigawatte) Forecast, by Application 2019 & 2032
- Table 49: Global West Europe Renewable Energy Revenue Million Forecast, by Source 2019 & 2032
- Table 50: Global West Europe Renewable Energy Volume Gigawatte Forecast, by Source 2019 & 2032
- Table 51: Global West Europe Renewable Energy Revenue Million Forecast, by Geogrpahy 2019 & 2032
- Table 52: Global West Europe Renewable Energy Volume Gigawatte Forecast, by Geogrpahy 2019 & 2032
- Table 53: Global West Europe Renewable Energy Revenue Million Forecast, by Country 2019 & 2032
- Table 54: Global West Europe Renewable Energy Volume Gigawatte Forecast, by Country 2019 & 2032
- Table 55: United Kingdom West Europe Renewable Energy Revenue (Million) Forecast, by Application 2019 & 2032
- Table 56: United Kingdom West Europe Renewable Energy Volume (Gigawatte) Forecast, by Application 2019 & 2032
- Table 57: Germany West Europe Renewable Energy Revenue (Million) Forecast, by Application 2019 & 2032
- Table 58: Germany West Europe Renewable Energy Volume (Gigawatte) Forecast, by Application 2019 & 2032
- Table 59: France West Europe Renewable Energy Revenue (Million) Forecast, by Application 2019 & 2032
- Table 60: France West Europe Renewable Energy Volume (Gigawatte) Forecast, by Application 2019 & 2032
- Table 61: Italy West Europe Renewable Energy Revenue (Million) Forecast, by Application 2019 & 2032
- Table 62: Italy West Europe Renewable Energy Volume (Gigawatte) Forecast, by Application 2019 & 2032
- Table 63: Spain West Europe Renewable Energy Revenue (Million) Forecast, by Application 2019 & 2032
- Table 64: Spain West Europe Renewable Energy Volume (Gigawatte) Forecast, by Application 2019 & 2032
- Table 65: Russia West Europe Renewable Energy Revenue (Million) Forecast, by Application 2019 & 2032
- Table 66: Russia West Europe Renewable Energy Volume (Gigawatte) Forecast, by Application 2019 & 2032
- Table 67: Benelux West Europe Renewable Energy Revenue (Million) Forecast, by Application 2019 & 2032
- Table 68: Benelux West Europe Renewable Energy Volume (Gigawatte) Forecast, by Application 2019 & 2032
- Table 69: Nordics West Europe Renewable Energy Revenue (Million) Forecast, by Application 2019 & 2032
- Table 70: Nordics West Europe Renewable Energy Volume (Gigawatte) Forecast, by Application 2019 & 2032
- Table 71: Rest of Europe West Europe Renewable Energy Revenue (Million) Forecast, by Application 2019 & 2032
- Table 72: Rest of Europe West Europe Renewable Energy Volume (Gigawatte) Forecast, by Application 2019 & 2032
- Table 73: Global West Europe Renewable Energy Revenue Million Forecast, by Source 2019 & 2032
- Table 74: Global West Europe Renewable Energy Volume Gigawatte Forecast, by Source 2019 & 2032
- Table 75: Global West Europe Renewable Energy Revenue Million Forecast, by Geogrpahy 2019 & 2032
- Table 76: Global West Europe Renewable Energy Volume Gigawatte Forecast, by Geogrpahy 2019 & 2032
- Table 77: Global West Europe Renewable Energy Revenue Million Forecast, by Country 2019 & 2032
- Table 78: Global West Europe Renewable Energy Volume Gigawatte Forecast, by Country 2019 & 2032
- Table 79: Turkey West Europe Renewable Energy Revenue (Million) Forecast, by Application 2019 & 2032
- Table 80: Turkey West Europe Renewable Energy Volume (Gigawatte) Forecast, by Application 2019 & 2032
- Table 81: Israel West Europe Renewable Energy Revenue (Million) Forecast, by Application 2019 & 2032
- Table 82: Israel West Europe Renewable Energy Volume (Gigawatte) Forecast, by Application 2019 & 2032
- Table 83: GCC West Europe Renewable Energy Revenue (Million) Forecast, by Application 2019 & 2032
- Table 84: GCC West Europe Renewable Energy Volume (Gigawatte) Forecast, by Application 2019 & 2032
- Table 85: North Africa West Europe Renewable Energy Revenue (Million) Forecast, by Application 2019 & 2032
- Table 86: North Africa West Europe Renewable Energy Volume (Gigawatte) Forecast, by Application 2019 & 2032
- Table 87: South Africa West Europe Renewable Energy Revenue (Million) Forecast, by Application 2019 & 2032
- Table 88: South Africa West Europe Renewable Energy Volume (Gigawatte) Forecast, by Application 2019 & 2032
- Table 89: Rest of Middle East & Africa West Europe Renewable Energy Revenue (Million) Forecast, by Application 2019 & 2032
- Table 90: Rest of Middle East & Africa West Europe Renewable Energy Volume (Gigawatte) Forecast, by Application 2019 & 2032
- Table 91: Global West Europe Renewable Energy Revenue Million Forecast, by Source 2019 & 2032
- Table 92: Global West Europe Renewable Energy Volume Gigawatte Forecast, by Source 2019 & 2032
- Table 93: Global West Europe Renewable Energy Revenue Million Forecast, by Geogrpahy 2019 & 2032
- Table 94: Global West Europe Renewable Energy Volume Gigawatte Forecast, by Geogrpahy 2019 & 2032
- Table 95: Global West Europe Renewable Energy Revenue Million Forecast, by Country 2019 & 2032
- Table 96: Global West Europe Renewable Energy Volume Gigawatte Forecast, by Country 2019 & 2032
- Table 97: China West Europe Renewable Energy Revenue (Million) Forecast, by Application 2019 & 2032
- Table 98: China West Europe Renewable Energy Volume (Gigawatte) Forecast, by Application 2019 & 2032
- Table 99: India West Europe Renewable Energy Revenue (Million) Forecast, by Application 2019 & 2032
- Table 100: India West Europe Renewable Energy Volume (Gigawatte) Forecast, by Application 2019 & 2032
- Table 101: Japan West Europe Renewable Energy Revenue (Million) Forecast, by Application 2019 & 2032
- Table 102: Japan West Europe Renewable Energy Volume (Gigawatte) Forecast, by Application 2019 & 2032
- Table 103: South Korea West Europe Renewable Energy Revenue (Million) Forecast, by Application 2019 & 2032
- Table 104: South Korea West Europe Renewable Energy Volume (Gigawatte) Forecast, by Application 2019 & 2032
- Table 105: ASEAN West Europe Renewable Energy Revenue (Million) Forecast, by Application 2019 & 2032
- Table 106: ASEAN West Europe Renewable Energy Volume (Gigawatte) Forecast, by Application 2019 & 2032
- Table 107: Oceania West Europe Renewable Energy Revenue (Million) Forecast, by Application 2019 & 2032
- Table 108: Oceania West Europe Renewable Energy Volume (Gigawatte) Forecast, by Application 2019 & 2032
- Table 109: Rest of Asia Pacific West Europe Renewable Energy Revenue (Million) Forecast, by Application 2019 & 2032
- Table 110: Rest of Asia Pacific West Europe Renewable Energy Volume (Gigawatte) Forecast, by Application 2019 & 2032
Frequently Asked Questions
1. What is the projected Compound Annual Growth Rate (CAGR) of the West Europe Renewable Energy?
The projected CAGR is approximately > 6.00%.
2. Which companies are prominent players in the West Europe Renewable Energy?
Key companies in the market include JinkoSolar Holding Co Ltd, Total SA, Engie SA, Vestas Wind Systems A/S, Electricite de France SA, Siemens Gamesa Renewable Energy SA, Renewable Energy Systems Ltd, Ecotricity Group Ltd, General Electric Company.
3. What are the main segments of the West Europe Renewable Energy?
The market segments include Source, Geogrpahy.
4. Can you provide details about the market size?
The market size is estimated to be USD XX Million as of 2022.
5. What are some drivers contributing to market growth?
4.; Demand for Solar Photovoltaic Installations4.; Growing Investments.
6. What are the notable trends driving market growth?
Wind Energy to Witness Significant Growth.
7. Are there any restraints impacting market growth?
4.; Increasing Wind Energy Installations.
8. Can you provide examples of recent developments in the market?
December 2022: France launched tenders for two new offshore wind farms, which are bottom-fixed and were expected to have a total capacity of 2.5 GW. The first wind farm was expected to be 35 km off Oléron Island in the Atlantic (Nouvelle-Aquitaine) with a capacity of about 1 GW. The second wind farm was expected to be 38 km off the coast of Normandy, with a capacity of approximately 1.5 GW. The projects were to be awarded at the end of 2023 or early 2024.
9. What pricing options are available for accessing the report?
Pricing options include single-user, multi-user, and enterprise licenses priced at USD 4750, USD 5250, and USD 8750 respectively.
10. Is the market size provided in terms of value or volume?
The market size is provided in terms of value, measured in Million and volume, measured in Gigawatte.
11. Are there any specific market keywords associated with the report?
Yes, the market keyword associated with the report is "West Europe Renewable Energy," which aids in identifying and referencing the specific market segment covered.
12. How do I determine which pricing option suits my needs best?
The pricing options vary based on user requirements and access needs. Individual users may opt for single-user licenses, while businesses requiring broader access may choose multi-user or enterprise licenses for cost-effective access to the report.
13. Are there any additional resources or data provided in the West Europe Renewable Energy report?
While the report offers comprehensive insights, it's advisable to review the specific contents or supplementary materials provided to ascertain if additional resources or data are available.
14. How can I stay updated on further developments or reports in the West Europe Renewable Energy?
To stay informed about further developments, trends, and reports in the West Europe Renewable Energy, consider subscribing to industry newsletters, following relevant companies and organizations, or regularly checking reputable industry news sources and publications.
Methodology
Step 1 - Identification of Relevant Samples Size from Population Database


Step 2 - Approaches for Defining Global Market Size (Value, Volume* & Price*)

Note*: In applicable scenarios
Step 3 - Data Sources
Primary Research
- Web Analytics
- Survey Reports
- Research Institute
- Latest Research Reports
- Opinion Leaders
Secondary Research
- Annual Reports
- White Paper
- Latest Press Release
- Industry Association
- Paid Database
- Investor Presentations

Step 4 - Data Triangulation
Involves using different sources of information in order to increase the validity of a study
These sources are likely to be stakeholders in a program - participants, other researchers, program staff, other community members, and so on.
Then we put all data in single framework & apply various statistical tools to find out the dynamic on the market.
During the analysis stage, feedback from the stakeholder groups would be compared to determine areas of agreement as well as areas of divergence


