
Key Insights
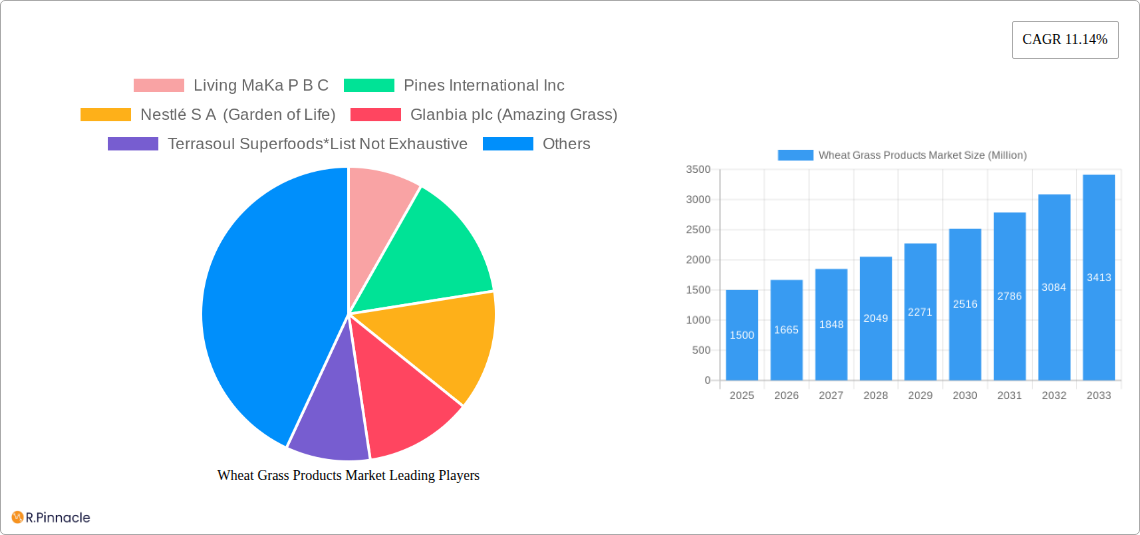
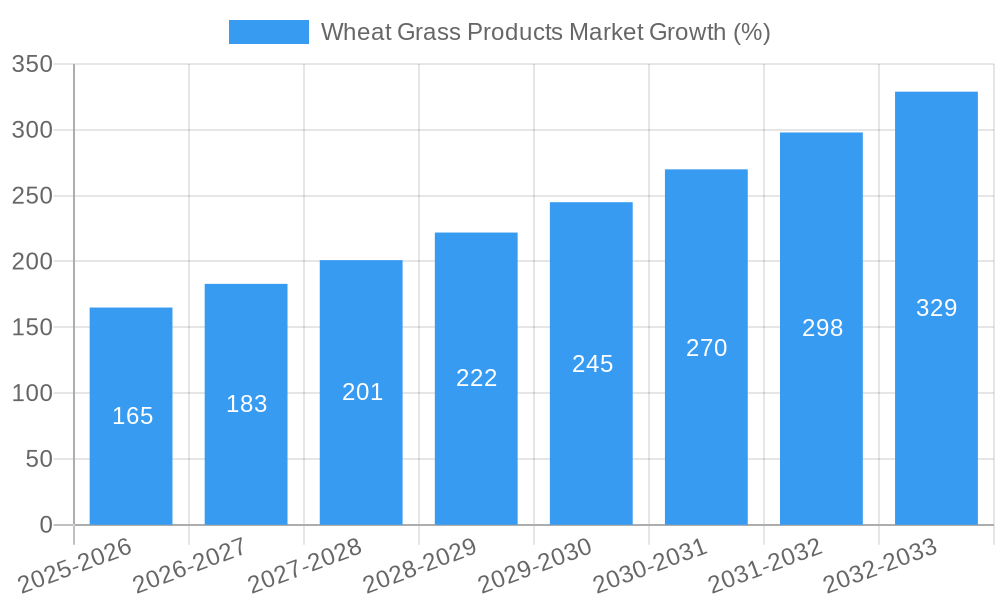
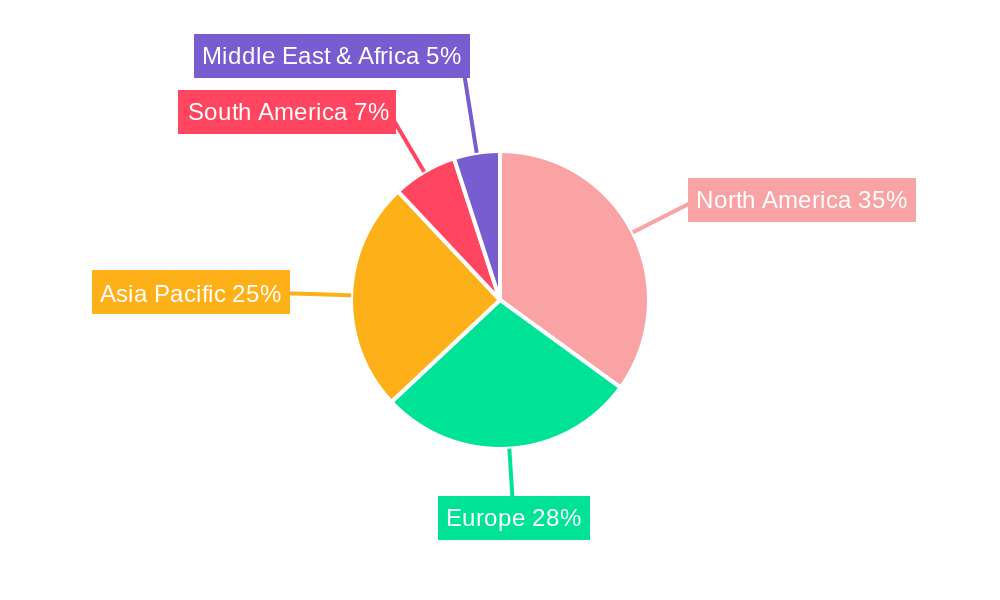
The global wheat grass products market is experiencing robust growth, driven by increasing consumer awareness of its health benefits and the rising popularity of functional foods and beverages. The market's compound annual growth rate (CAGR) of 11.14% from 2019 to 2024 suggests a significant expansion, projected to continue through 2033. This growth is fueled by several factors, including the increasing prevalence of chronic diseases, a growing preference for natural and organic products, and the rising adoption of plant-based diets. The diverse product formats available—juice, powder, and pills—cater to various consumer preferences and lifestyles, further driving market penetration. Distribution channels are diversifying, with online retail stores experiencing significant growth alongside traditional supermarket and specialist retailer channels. Key players like Living MaKa, Pines International, Nestlé (Garden of Life), Glanbia (Amazing Grass), and NOW Foods are actively shaping the market through product innovation and strategic expansion. The North American market currently holds a significant share, largely due to high consumer awareness and established distribution networks, but Asia-Pacific is projected to witness substantial growth in the coming years driven by increasing disposable incomes and rising health consciousness.
The market faces certain restraints, primarily related to the high cost of production and potential seasonal variations in wheat grass yield. However, the overall positive outlook is strengthened by the continuous efforts of market players to address these challenges through sustainable farming practices and cost-effective processing technologies. Furthermore, the increasing integration of wheat grass into various food and beverage products, such as smoothies and protein bars, is broadening the market's appeal and contributing to its expansion. The market segmentation by product type and distribution channel provides valuable insights for companies looking to effectively target consumer segments and maximize their market share. The forecast period, spanning 2025-2033, promises continued growth, with opportunities for innovation and expansion across different regions and product offerings.
Wheat Grass Products Market Report: 2019-2033
This comprehensive report provides a detailed analysis of the Wheat Grass Products Market, offering invaluable insights for industry professionals, investors, and strategic decision-makers. With a study period spanning 2019-2033, a base year of 2025, and a forecast period of 2025-2033, this report offers a complete understanding of past performance, current market dynamics, and future growth projections. The market is valued at xx Million in 2025 and is projected to reach xx Million by 2033, exhibiting a CAGR of xx%.
Wheat Grass Products Market Structure & Innovation Trends
This section analyzes the competitive landscape of the Wheat Grass Products Market, examining market concentration, innovation drivers, regulatory frameworks, and key industry trends. We delve into the impact of mergers and acquisitions (M&A) activities, assessing deal values and their influence on market share distribution. Leading players such as Living MaKa P B C, Pines International Inc, Nestlé S A (Garden of Life), Glanbia plc (Amazing Grass), Terrasoul Superfoods, NOW Foods, AquaBella Organic Solutions LLC (Unleash Organics), Baidyanath Group, Jivo Wellness Pvt Ltd, and Naturya Limited are profiled, analyzing their market share and strategic initiatives. The report also explores the impact of substitutes, end-user demographics and regulatory changes. For example, the xx% market share held by Nestlé S A (Garden of Life) highlights its significant influence, while the xx Million value of recent M&A deals reflects the dynamic nature of the market.
Wheat Grass Products Market Market Dynamics & Trends
This section provides a detailed analysis of the key drivers and challenges shaping the Wheat Grass Products Market. We examine market growth drivers, technological advancements, evolving consumer preferences, and competitive dynamics. Specific metrics, including the Compound Annual Growth Rate (CAGR) and market penetration rates for different product types and distribution channels are included. Factors influencing market growth such as increased consumer awareness of health benefits, rising demand for functional foods, and the expanding e-commerce sector are analyzed in depth. We also explore the impact of technological disruptions, such as advancements in processing and packaging technologies, on market trends. The competitive landscape is analyzed, assessing the strategies employed by key players to maintain market share and attract new customers.
Dominant Regions & Segments in Wheat Grass Products Market
This section identifies the leading regions and segments within the Wheat Grass Products Market. We analyze the dominance of specific geographical locations and product types (Juice, Powder, Pills) and distribution channels (Supermarket/Hypermarket, Specialist Retailers, Online Retail Stores, Other Distribution Channels). The analysis includes a detailed examination of the key drivers influencing market growth in these dominant regions and segments.
- Leading Region: [Insert leading region, e.g., North America] - Key drivers include [explain using paragraphs, e.g., high disposable income, strong health consciousness, established distribution networks].
- Dominant Product Type: [Insert dominant product type, e.g., Juice] - Key drivers include [explain using paragraphs, e.g., convenience, perceived freshness, readily available].
- Leading Distribution Channel: [Insert dominant distribution channel, e.g., Online Retail Stores] – Key drivers include [explain using paragraphs, e.g., growing e-commerce penetration, convenience for consumers].
Wheat Grass Products Market Product Innovations
This section summarizes recent product developments, highlighting innovative applications and competitive advantages. We focus on technological advancements in processing, packaging, and formulation that are driving market growth and shaping consumer preferences. For example, the emergence of ready-to-drink wheatgrass beverages reflects a significant trend towards convenience and portability.
Report Scope & Segmentation Analysis
This report segments the Wheat Grass Products Market by product type (Juice, Powder, Pills) and distribution channel (Supermarket/Hypermarket, Specialist Retailers, Online Retail Stores, Other Distribution Channels). Each segment is analyzed in detail, providing insights into its market size, growth projections, and competitive dynamics. For example, the Juice segment is expected to witness significant growth driven by consumer preference for convenience, while Online Retail Stores are expected to expand their market share due to increased e-commerce adoption.
Key Drivers of Wheat Grass Products Market Growth
Several factors contribute to the growth of the Wheat Grass Products Market. These include increasing consumer awareness of health benefits, rising demand for functional foods, and the expanding e-commerce sector. Technological advancements in processing and packaging also play a crucial role. Government regulations supporting the health food industry also contribute positively to market growth.
Challenges in the Wheat Grass Products Market Sector
The Wheat Grass Products Market faces certain challenges. These include maintaining product quality and freshness, managing supply chain complexities, and navigating fluctuating raw material prices. The competitive landscape also presents significant hurdles for smaller players. The xx% increase in raw material prices in 2022 negatively impacted profitability for many companies.
Emerging Opportunities in Wheat Grass Products Market
Several emerging opportunities exist in the Wheat Grass Products Market. These include expanding into new geographical markets, developing innovative product formulations, and exploring new distribution channels. The increasing popularity of organic and sustainably sourced products presents an additional opportunity for growth.
Leading Players in the Wheat Grass Products Market Market
- Living MaKa P B C
- Pines International Inc
- Nestlé S A (Garden of Life)
- Glanbia plc (Amazing Grass)
- Terrasoul Superfoods
- NOW Foods
- AquaBella Organic Solutions LLC (Unleash Organics)
- Baidyanath Group
- Jivo Wellness Pvt Ltd
- Naturya Limited
Key Developments in Wheat Grass Products Market Industry
- February 2021: Living MaKa launched its first line of ready-to-drink wheatgrass beverages, expanding distribution through partnerships with UNFI and KeHE in July 2022. This move significantly increased product accessibility and market reach.
- March 2021: JIVO Wellness introduced a new line of wheatgrass products, including a summer drink, leveraging e-commerce platforms and superstores for wider distribution. This strategic partnership broadened its market reach and customer base.
- December 2021: Wheatgrass Juice Bar opened a second location and launched a new app to enhance customer experience and streamline ordering, contributing to increased brand awareness and convenience.
Future Outlook for Wheat Grass Products Market Market
The Wheat Grass Products Market is poised for continued growth, driven by sustained consumer demand for healthy and functional foods. Innovation in product development and expanding distribution channels will play key roles in shaping the market's future. Strategic partnerships and acquisitions will likely continue to reshape the competitive landscape. The market is predicted to experience significant growth in the coming years, with expansion into new geographical regions expected to play a major part.
Wheat Grass Products Market Segmentation
-
1. Product Type
- 1.1. Juice
- 1.2. Powder
- 1.3. Pills
-
2. Distribution Channel
- 2.1. Supermarket/Hypermarket
- 2.2. Specialist Retailers
- 2.3. Online Retail Stores
- 2.4. Other Distribution Channels
Wheat Grass Products Market Segmentation By Geography
-
1. North America
- 1.1. United States
- 1.2. Canada
- 1.3. Mexico
- 1.4. Rest of North America
-
2. Europe
- 2.1. United Kingdom
- 2.2. Germany
- 2.3. France
- 2.4. Russia
- 2.5. Italy
- 2.6. Spain
- 2.7. Rest of Europe
-
3. Asia Pacific
- 3.1. India
- 3.2. China
- 3.3. Japan
- 3.4. Australia
- 3.5. Rest of Asia Pacific
-
4. South America
- 4.1. Brazil
- 4.2. Argentina
- 4.3. Rest of South America
- 5. Middle East
-
6. South Africa
- 6.1. Saudi Arabia
- 6.2. Rest of Middle East
Wheat Grass Products Market REPORT HIGHLIGHTS
| Aspects | Details |
|---|---|
| Study Period | 2019-2033 |
| Base Year | 2024 |
| Estimated Year | 2025 |
| Forecast Period | 2025-2033 |
| Historical Period | 2019-2024 |
| Growth Rate | CAGR of 11.14% from 2019-2033 |
| Segmentation |
|
Table of Contents
- 1. Introduction
- 1.1. Research Scope
- 1.2. Market Segmentation
- 1.3. Research Methodology
- 1.4. Definitions and Assumptions
- 2. Executive Summary
- 2.1. Introduction
- 3. Market Dynamics
- 3.1. Introduction
- 3.2. Market Drivers
- 3.2.1. Wide Applications and Functionality; Low Price and Easy Availability of Synthetic Phenethyl Alcohol
- 3.3. Market Restrains
- 3.3.1. Availability of Substitutes
- 3.4. Market Trends
- 3.4.1. Surge in Demand for Superfoods
- 4. Market Factor Analysis
- 4.1. Porters Five Forces
- 4.2. Supply/Value Chain
- 4.3. PESTEL analysis
- 4.4. Market Entropy
- 4.5. Patent/Trademark Analysis
- 5. Global Wheat Grass Products Market Analysis, Insights and Forecast, 2019-2031
- 5.1. Market Analysis, Insights and Forecast - by Product Type
- 5.1.1. Juice
- 5.1.2. Powder
- 5.1.3. Pills
- 5.2. Market Analysis, Insights and Forecast - by Distribution Channel
- 5.2.1. Supermarket/Hypermarket
- 5.2.2. Specialist Retailers
- 5.2.3. Online Retail Stores
- 5.2.4. Other Distribution Channels
- 5.3. Market Analysis, Insights and Forecast - by Region
- 5.3.1. North America
- 5.3.2. Europe
- 5.3.3. Asia Pacific
- 5.3.4. South America
- 5.3.5. Middle East
- 5.3.6. South Africa
- 5.1. Market Analysis, Insights and Forecast - by Product Type
- 6. North America Wheat Grass Products Market Analysis, Insights and Forecast, 2019-2031
- 6.1. Market Analysis, Insights and Forecast - by Product Type
- 6.1.1. Juice
- 6.1.2. Powder
- 6.1.3. Pills
- 6.2. Market Analysis, Insights and Forecast - by Distribution Channel
- 6.2.1. Supermarket/Hypermarket
- 6.2.2. Specialist Retailers
- 6.2.3. Online Retail Stores
- 6.2.4. Other Distribution Channels
- 6.1. Market Analysis, Insights and Forecast - by Product Type
- 7. Europe Wheat Grass Products Market Analysis, Insights and Forecast, 2019-2031
- 7.1. Market Analysis, Insights and Forecast - by Product Type
- 7.1.1. Juice
- 7.1.2. Powder
- 7.1.3. Pills
- 7.2. Market Analysis, Insights and Forecast - by Distribution Channel
- 7.2.1. Supermarket/Hypermarket
- 7.2.2. Specialist Retailers
- 7.2.3. Online Retail Stores
- 7.2.4. Other Distribution Channels
- 7.1. Market Analysis, Insights and Forecast - by Product Type
- 8. Asia Pacific Wheat Grass Products Market Analysis, Insights and Forecast, 2019-2031
- 8.1. Market Analysis, Insights and Forecast - by Product Type
- 8.1.1. Juice
- 8.1.2. Powder
- 8.1.3. Pills
- 8.2. Market Analysis, Insights and Forecast - by Distribution Channel
- 8.2.1. Supermarket/Hypermarket
- 8.2.2. Specialist Retailers
- 8.2.3. Online Retail Stores
- 8.2.4. Other Distribution Channels
- 8.1. Market Analysis, Insights and Forecast - by Product Type
- 9. South America Wheat Grass Products Market Analysis, Insights and Forecast, 2019-2031
- 9.1. Market Analysis, Insights and Forecast - by Product Type
- 9.1.1. Juice
- 9.1.2. Powder
- 9.1.3. Pills
- 9.2. Market Analysis, Insights and Forecast - by Distribution Channel
- 9.2.1. Supermarket/Hypermarket
- 9.2.2. Specialist Retailers
- 9.2.3. Online Retail Stores
- 9.2.4. Other Distribution Channels
- 9.1. Market Analysis, Insights and Forecast - by Product Type
- 10. Middle East Wheat Grass Products Market Analysis, Insights and Forecast, 2019-2031
- 10.1. Market Analysis, Insights and Forecast - by Product Type
- 10.1.1. Juice
- 10.1.2. Powder
- 10.1.3. Pills
- 10.2. Market Analysis, Insights and Forecast - by Distribution Channel
- 10.2.1. Supermarket/Hypermarket
- 10.2.2. Specialist Retailers
- 10.2.3. Online Retail Stores
- 10.2.4. Other Distribution Channels
- 10.1. Market Analysis, Insights and Forecast - by Product Type
- 11. South Africa Wheat Grass Products Market Analysis, Insights and Forecast, 2019-2031
- 11.1. Market Analysis, Insights and Forecast - by Product Type
- 11.1.1. Juice
- 11.1.2. Powder
- 11.1.3. Pills
- 11.2. Market Analysis, Insights and Forecast - by Distribution Channel
- 11.2.1. Supermarket/Hypermarket
- 11.2.2. Specialist Retailers
- 11.2.3. Online Retail Stores
- 11.2.4. Other Distribution Channels
- 11.1. Market Analysis, Insights and Forecast - by Product Type
- 12. North America Wheat Grass Products Market Analysis, Insights and Forecast, 2019-2031
- 12.1. Market Analysis, Insights and Forecast - By Country/Sub-region
- 12.1.1 United States
- 12.1.2 Canada
- 12.1.3 Mexico
- 12.1.4 Rest of North America
- 13. Europe Wheat Grass Products Market Analysis, Insights and Forecast, 2019-2031
- 13.1. Market Analysis, Insights and Forecast - By Country/Sub-region
- 13.1.1 United Kingdom
- 13.1.2 Germany
- 13.1.3 France
- 13.1.4 Russia
- 13.1.5 Italy
- 13.1.6 Spain
- 13.1.7 Rest of Europe
- 14. Asia Pacific Wheat Grass Products Market Analysis, Insights and Forecast, 2019-2031
- 14.1. Market Analysis, Insights and Forecast - By Country/Sub-region
- 14.1.1 India
- 14.1.2 China
- 14.1.3 Japan
- 14.1.4 Australia
- 14.1.5 Rest of Asia Pacific
- 15. South America Wheat Grass Products Market Analysis, Insights and Forecast, 2019-2031
- 15.1. Market Analysis, Insights and Forecast - By Country/Sub-region
- 15.1.1 Brazil
- 15.1.2 Argentina
- 15.1.3 Rest of South America
- 16. Middle East & Africa Wheat Grass Products Market Analysis, Insights and Forecast, 2019-2031
- 16.1. Market Analysis, Insights and Forecast - By Country/Sub-region
- 16.1.1 UAE
- 16.1.2 South Africa
- 16.1.3 Saudi Arabia
- 16.1.4 Rest of MEA
- 17. South Africa Wheat Grass Products Market Analysis, Insights and Forecast, 2019-2031
- 17.1. Market Analysis, Insights and Forecast - By Country/Sub-region
- 17.1.1 Saudi Arabia
- 17.1.2 Rest of Middle East
- 18. Competitive Analysis
- 18.1. Global Market Share Analysis 2024
- 18.2. Company Profiles
- 18.2.1 Living MaKa P B C
- 18.2.1.1. Overview
- 18.2.1.2. Products
- 18.2.1.3. SWOT Analysis
- 18.2.1.4. Recent Developments
- 18.2.1.5. Financials (Based on Availability)
- 18.2.2 Pines International Inc
- 18.2.2.1. Overview
- 18.2.2.2. Products
- 18.2.2.3. SWOT Analysis
- 18.2.2.4. Recent Developments
- 18.2.2.5. Financials (Based on Availability)
- 18.2.3 Nestlé S A (Garden of Life)
- 18.2.3.1. Overview
- 18.2.3.2. Products
- 18.2.3.3. SWOT Analysis
- 18.2.3.4. Recent Developments
- 18.2.3.5. Financials (Based on Availability)
- 18.2.4 Glanbia plc (Amazing Grass)
- 18.2.4.1. Overview
- 18.2.4.2. Products
- 18.2.4.3. SWOT Analysis
- 18.2.4.4. Recent Developments
- 18.2.4.5. Financials (Based on Availability)
- 18.2.5 Terrasoul Superfoods*List Not Exhaustive
- 18.2.5.1. Overview
- 18.2.5.2. Products
- 18.2.5.3. SWOT Analysis
- 18.2.5.4. Recent Developments
- 18.2.5.5. Financials (Based on Availability)
- 18.2.6 NOW Foods
- 18.2.6.1. Overview
- 18.2.6.2. Products
- 18.2.6.3. SWOT Analysis
- 18.2.6.4. Recent Developments
- 18.2.6.5. Financials (Based on Availability)
- 18.2.7 AquaBella Organic Solutions LLC (Unleash Organics )
- 18.2.7.1. Overview
- 18.2.7.2. Products
- 18.2.7.3. SWOT Analysis
- 18.2.7.4. Recent Developments
- 18.2.7.5. Financials (Based on Availability)
- 18.2.8 Baidyanath Group
- 18.2.8.1. Overview
- 18.2.8.2. Products
- 18.2.8.3. SWOT Analysis
- 18.2.8.4. Recent Developments
- 18.2.8.5. Financials (Based on Availability)
- 18.2.9 Jivo Wellness Pvt Ltd
- 18.2.9.1. Overview
- 18.2.9.2. Products
- 18.2.9.3. SWOT Analysis
- 18.2.9.4. Recent Developments
- 18.2.9.5. Financials (Based on Availability)
- 18.2.10 Naturya Limited
- 18.2.10.1. Overview
- 18.2.10.2. Products
- 18.2.10.3. SWOT Analysis
- 18.2.10.4. Recent Developments
- 18.2.10.5. Financials (Based on Availability)
- 18.2.1 Living MaKa P B C
List of Figures
- Figure 1: Global Wheat Grass Products Market Revenue Breakdown (Million, %) by Region 2024 & 2032
- Figure 2: North America Wheat Grass Products Market Revenue (Million), by Country 2024 & 2032
- Figure 3: North America Wheat Grass Products Market Revenue Share (%), by Country 2024 & 2032
- Figure 4: Europe Wheat Grass Products Market Revenue (Million), by Country 2024 & 2032
- Figure 5: Europe Wheat Grass Products Market Revenue Share (%), by Country 2024 & 2032
- Figure 6: Asia Pacific Wheat Grass Products Market Revenue (Million), by Country 2024 & 2032
- Figure 7: Asia Pacific Wheat Grass Products Market Revenue Share (%), by Country 2024 & 2032
- Figure 8: South America Wheat Grass Products Market Revenue (Million), by Country 2024 & 2032
- Figure 9: South America Wheat Grass Products Market Revenue Share (%), by Country 2024 & 2032
- Figure 10: Middle East & Africa Wheat Grass Products Market Revenue (Million), by Country 2024 & 2032
- Figure 11: Middle East & Africa Wheat Grass Products Market Revenue Share (%), by Country 2024 & 2032
- Figure 12: South Africa Wheat Grass Products Market Revenue (Million), by Country 2024 & 2032
- Figure 13: South Africa Wheat Grass Products Market Revenue Share (%), by Country 2024 & 2032
- Figure 14: North America Wheat Grass Products Market Revenue (Million), by Product Type 2024 & 2032
- Figure 15: North America Wheat Grass Products Market Revenue Share (%), by Product Type 2024 & 2032
- Figure 16: North America Wheat Grass Products Market Revenue (Million), by Distribution Channel 2024 & 2032
- Figure 17: North America Wheat Grass Products Market Revenue Share (%), by Distribution Channel 2024 & 2032
- Figure 18: North America Wheat Grass Products Market Revenue (Million), by Country 2024 & 2032
- Figure 19: North America Wheat Grass Products Market Revenue Share (%), by Country 2024 & 2032
- Figure 20: Europe Wheat Grass Products Market Revenue (Million), by Product Type 2024 & 2032
- Figure 21: Europe Wheat Grass Products Market Revenue Share (%), by Product Type 2024 & 2032
- Figure 22: Europe Wheat Grass Products Market Revenue (Million), by Distribution Channel 2024 & 2032
- Figure 23: Europe Wheat Grass Products Market Revenue Share (%), by Distribution Channel 2024 & 2032
- Figure 24: Europe Wheat Grass Products Market Revenue (Million), by Country 2024 & 2032
- Figure 25: Europe Wheat Grass Products Market Revenue Share (%), by Country 2024 & 2032
- Figure 26: Asia Pacific Wheat Grass Products Market Revenue (Million), by Product Type 2024 & 2032
- Figure 27: Asia Pacific Wheat Grass Products Market Revenue Share (%), by Product Type 2024 & 2032
- Figure 28: Asia Pacific Wheat Grass Products Market Revenue (Million), by Distribution Channel 2024 & 2032
- Figure 29: Asia Pacific Wheat Grass Products Market Revenue Share (%), by Distribution Channel 2024 & 2032
- Figure 30: Asia Pacific Wheat Grass Products Market Revenue (Million), by Country 2024 & 2032
- Figure 31: Asia Pacific Wheat Grass Products Market Revenue Share (%), by Country 2024 & 2032
- Figure 32: South America Wheat Grass Products Market Revenue (Million), by Product Type 2024 & 2032
- Figure 33: South America Wheat Grass Products Market Revenue Share (%), by Product Type 2024 & 2032
- Figure 34: South America Wheat Grass Products Market Revenue (Million), by Distribution Channel 2024 & 2032
- Figure 35: South America Wheat Grass Products Market Revenue Share (%), by Distribution Channel 2024 & 2032
- Figure 36: South America Wheat Grass Products Market Revenue (Million), by Country 2024 & 2032
- Figure 37: South America Wheat Grass Products Market Revenue Share (%), by Country 2024 & 2032
- Figure 38: Middle East Wheat Grass Products Market Revenue (Million), by Product Type 2024 & 2032
- Figure 39: Middle East Wheat Grass Products Market Revenue Share (%), by Product Type 2024 & 2032
- Figure 40: Middle East Wheat Grass Products Market Revenue (Million), by Distribution Channel 2024 & 2032
- Figure 41: Middle East Wheat Grass Products Market Revenue Share (%), by Distribution Channel 2024 & 2032
- Figure 42: Middle East Wheat Grass Products Market Revenue (Million), by Country 2024 & 2032
- Figure 43: Middle East Wheat Grass Products Market Revenue Share (%), by Country 2024 & 2032
- Figure 44: South Africa Wheat Grass Products Market Revenue (Million), by Product Type 2024 & 2032
- Figure 45: South Africa Wheat Grass Products Market Revenue Share (%), by Product Type 2024 & 2032
- Figure 46: South Africa Wheat Grass Products Market Revenue (Million), by Distribution Channel 2024 & 2032
- Figure 47: South Africa Wheat Grass Products Market Revenue Share (%), by Distribution Channel 2024 & 2032
- Figure 48: South Africa Wheat Grass Products Market Revenue (Million), by Country 2024 & 2032
- Figure 49: South Africa Wheat Grass Products Market Revenue Share (%), by Country 2024 & 2032
List of Tables
- Table 1: Global Wheat Grass Products Market Revenue Million Forecast, by Region 2019 & 2032
- Table 2: Global Wheat Grass Products Market Revenue Million Forecast, by Product Type 2019 & 2032
- Table 3: Global Wheat Grass Products Market Revenue Million Forecast, by Distribution Channel 2019 & 2032
- Table 4: Global Wheat Grass Products Market Revenue Million Forecast, by Region 2019 & 2032
- Table 5: Global Wheat Grass Products Market Revenue Million Forecast, by Country 2019 & 2032
- Table 6: United States Wheat Grass Products Market Revenue (Million) Forecast, by Application 2019 & 2032
- Table 7: Canada Wheat Grass Products Market Revenue (Million) Forecast, by Application 2019 & 2032
- Table 8: Mexico Wheat Grass Products Market Revenue (Million) Forecast, by Application 2019 & 2032
- Table 9: Rest of North America Wheat Grass Products Market Revenue (Million) Forecast, by Application 2019 & 2032
- Table 10: Global Wheat Grass Products Market Revenue Million Forecast, by Country 2019 & 2032
- Table 11: United Kingdom Wheat Grass Products Market Revenue (Million) Forecast, by Application 2019 & 2032
- Table 12: Germany Wheat Grass Products Market Revenue (Million) Forecast, by Application 2019 & 2032
- Table 13: France Wheat Grass Products Market Revenue (Million) Forecast, by Application 2019 & 2032
- Table 14: Russia Wheat Grass Products Market Revenue (Million) Forecast, by Application 2019 & 2032
- Table 15: Italy Wheat Grass Products Market Revenue (Million) Forecast, by Application 2019 & 2032
- Table 16: Spain Wheat Grass Products Market Revenue (Million) Forecast, by Application 2019 & 2032
- Table 17: Rest of Europe Wheat Grass Products Market Revenue (Million) Forecast, by Application 2019 & 2032
- Table 18: Global Wheat Grass Products Market Revenue Million Forecast, by Country 2019 & 2032
- Table 19: India Wheat Grass Products Market Revenue (Million) Forecast, by Application 2019 & 2032
- Table 20: China Wheat Grass Products Market Revenue (Million) Forecast, by Application 2019 & 2032
- Table 21: Japan Wheat Grass Products Market Revenue (Million) Forecast, by Application 2019 & 2032
- Table 22: Australia Wheat Grass Products Market Revenue (Million) Forecast, by Application 2019 & 2032
- Table 23: Rest of Asia Pacific Wheat Grass Products Market Revenue (Million) Forecast, by Application 2019 & 2032
- Table 24: Global Wheat Grass Products Market Revenue Million Forecast, by Country 2019 & 2032
- Table 25: Brazil Wheat Grass Products Market Revenue (Million) Forecast, by Application 2019 & 2032
- Table 26: Argentina Wheat Grass Products Market Revenue (Million) Forecast, by Application 2019 & 2032
- Table 27: Rest of South America Wheat Grass Products Market Revenue (Million) Forecast, by Application 2019 & 2032
- Table 28: Global Wheat Grass Products Market Revenue Million Forecast, by Country 2019 & 2032
- Table 29: UAE Wheat Grass Products Market Revenue (Million) Forecast, by Application 2019 & 2032
- Table 30: South Africa Wheat Grass Products Market Revenue (Million) Forecast, by Application 2019 & 2032
- Table 31: Saudi Arabia Wheat Grass Products Market Revenue (Million) Forecast, by Application 2019 & 2032
- Table 32: Rest of MEA Wheat Grass Products Market Revenue (Million) Forecast, by Application 2019 & 2032
- Table 33: Global Wheat Grass Products Market Revenue Million Forecast, by Country 2019 & 2032
- Table 34: Saudi Arabia Wheat Grass Products Market Revenue (Million) Forecast, by Application 2019 & 2032
- Table 35: Rest of Middle East Wheat Grass Products Market Revenue (Million) Forecast, by Application 2019 & 2032
- Table 36: Global Wheat Grass Products Market Revenue Million Forecast, by Product Type 2019 & 2032
- Table 37: Global Wheat Grass Products Market Revenue Million Forecast, by Distribution Channel 2019 & 2032
- Table 38: Global Wheat Grass Products Market Revenue Million Forecast, by Country 2019 & 2032
- Table 39: United States Wheat Grass Products Market Revenue (Million) Forecast, by Application 2019 & 2032
- Table 40: Canada Wheat Grass Products Market Revenue (Million) Forecast, by Application 2019 & 2032
- Table 41: Mexico Wheat Grass Products Market Revenue (Million) Forecast, by Application 2019 & 2032
- Table 42: Rest of North America Wheat Grass Products Market Revenue (Million) Forecast, by Application 2019 & 2032
- Table 43: Global Wheat Grass Products Market Revenue Million Forecast, by Product Type 2019 & 2032
- Table 44: Global Wheat Grass Products Market Revenue Million Forecast, by Distribution Channel 2019 & 2032
- Table 45: Global Wheat Grass Products Market Revenue Million Forecast, by Country 2019 & 2032
- Table 46: United Kingdom Wheat Grass Products Market Revenue (Million) Forecast, by Application 2019 & 2032
- Table 47: Germany Wheat Grass Products Market Revenue (Million) Forecast, by Application 2019 & 2032
- Table 48: France Wheat Grass Products Market Revenue (Million) Forecast, by Application 2019 & 2032
- Table 49: Russia Wheat Grass Products Market Revenue (Million) Forecast, by Application 2019 & 2032
- Table 50: Italy Wheat Grass Products Market Revenue (Million) Forecast, by Application 2019 & 2032
- Table 51: Spain Wheat Grass Products Market Revenue (Million) Forecast, by Application 2019 & 2032
- Table 52: Rest of Europe Wheat Grass Products Market Revenue (Million) Forecast, by Application 2019 & 2032
- Table 53: Global Wheat Grass Products Market Revenue Million Forecast, by Product Type 2019 & 2032
- Table 54: Global Wheat Grass Products Market Revenue Million Forecast, by Distribution Channel 2019 & 2032
- Table 55: Global Wheat Grass Products Market Revenue Million Forecast, by Country 2019 & 2032
- Table 56: India Wheat Grass Products Market Revenue (Million) Forecast, by Application 2019 & 2032
- Table 57: China Wheat Grass Products Market Revenue (Million) Forecast, by Application 2019 & 2032
- Table 58: Japan Wheat Grass Products Market Revenue (Million) Forecast, by Application 2019 & 2032
- Table 59: Australia Wheat Grass Products Market Revenue (Million) Forecast, by Application 2019 & 2032
- Table 60: Rest of Asia Pacific Wheat Grass Products Market Revenue (Million) Forecast, by Application 2019 & 2032
- Table 61: Global Wheat Grass Products Market Revenue Million Forecast, by Product Type 2019 & 2032
- Table 62: Global Wheat Grass Products Market Revenue Million Forecast, by Distribution Channel 2019 & 2032
- Table 63: Global Wheat Grass Products Market Revenue Million Forecast, by Country 2019 & 2032
- Table 64: Brazil Wheat Grass Products Market Revenue (Million) Forecast, by Application 2019 & 2032
- Table 65: Argentina Wheat Grass Products Market Revenue (Million) Forecast, by Application 2019 & 2032
- Table 66: Rest of South America Wheat Grass Products Market Revenue (Million) Forecast, by Application 2019 & 2032
- Table 67: Global Wheat Grass Products Market Revenue Million Forecast, by Product Type 2019 & 2032
- Table 68: Global Wheat Grass Products Market Revenue Million Forecast, by Distribution Channel 2019 & 2032
- Table 69: Global Wheat Grass Products Market Revenue Million Forecast, by Country 2019 & 2032
- Table 70: Global Wheat Grass Products Market Revenue Million Forecast, by Product Type 2019 & 2032
- Table 71: Global Wheat Grass Products Market Revenue Million Forecast, by Distribution Channel 2019 & 2032
- Table 72: Global Wheat Grass Products Market Revenue Million Forecast, by Country 2019 & 2032
- Table 73: Saudi Arabia Wheat Grass Products Market Revenue (Million) Forecast, by Application 2019 & 2032
- Table 74: Rest of Middle East Wheat Grass Products Market Revenue (Million) Forecast, by Application 2019 & 2032
Frequently Asked Questions
1. What is the projected Compound Annual Growth Rate (CAGR) of the Wheat Grass Products Market?
The projected CAGR is approximately 11.14%.
2. Which companies are prominent players in the Wheat Grass Products Market?
Key companies in the market include Living MaKa P B C, Pines International Inc, Nestlé S A (Garden of Life), Glanbia plc (Amazing Grass), Terrasoul Superfoods*List Not Exhaustive, NOW Foods, AquaBella Organic Solutions LLC (Unleash Organics ), Baidyanath Group, Jivo Wellness Pvt Ltd, Naturya Limited.
3. What are the main segments of the Wheat Grass Products Market?
The market segments include Product Type, Distribution Channel.
4. Can you provide details about the market size?
The market size is estimated to be USD XX Million as of 2022.
5. What are some drivers contributing to market growth?
Wide Applications and Functionality; Low Price and Easy Availability of Synthetic Phenethyl Alcohol.
6. What are the notable trends driving market growth?
Surge in Demand for Superfoods.
7. Are there any restraints impacting market growth?
Availability of Substitutes.
8. Can you provide examples of recent developments in the market?
December 2021: Wheatgrass Juice Bar has expanded its presence by opening a second location in the Wesleyan Park Plaza, right beside Pure Barre. To enhance the customer experience, the company has launched a new app that streamlines the ordering process and makes it more convenient for customers.
9. What pricing options are available for accessing the report?
Pricing options include single-user, multi-user, and enterprise licenses priced at USD 4750, USD 5250, and USD 8750 respectively.
10. Is the market size provided in terms of value or volume?
The market size is provided in terms of value, measured in Million.
11. Are there any specific market keywords associated with the report?
Yes, the market keyword associated with the report is "Wheat Grass Products Market," which aids in identifying and referencing the specific market segment covered.
12. How do I determine which pricing option suits my needs best?
The pricing options vary based on user requirements and access needs. Individual users may opt for single-user licenses, while businesses requiring broader access may choose multi-user or enterprise licenses for cost-effective access to the report.
13. Are there any additional resources or data provided in the Wheat Grass Products Market report?
While the report offers comprehensive insights, it's advisable to review the specific contents or supplementary materials provided to ascertain if additional resources or data are available.
14. How can I stay updated on further developments or reports in the Wheat Grass Products Market?
To stay informed about further developments, trends, and reports in the Wheat Grass Products Market, consider subscribing to industry newsletters, following relevant companies and organizations, or regularly checking reputable industry news sources and publications.
Methodology
Step 1 - Identification of Relevant Samples Size from Population Database


Step 2 - Approaches for Defining Global Market Size (Value, Volume* & Price*)

Note*: In applicable scenarios
Step 3 - Data Sources
Primary Research
- Web Analytics
- Survey Reports
- Research Institute
- Latest Research Reports
- Opinion Leaders
Secondary Research
- Annual Reports
- White Paper
- Latest Press Release
- Industry Association
- Paid Database
- Investor Presentations

Step 4 - Data Triangulation
Involves using different sources of information in order to increase the validity of a study
These sources are likely to be stakeholders in a program - participants, other researchers, program staff, other community members, and so on.
Then we put all data in single framework & apply various statistical tools to find out the dynamic on the market.
During the analysis stage, feedback from the stakeholder groups would be compared to determine areas of agreement as well as areas of divergence


