
Key Insights
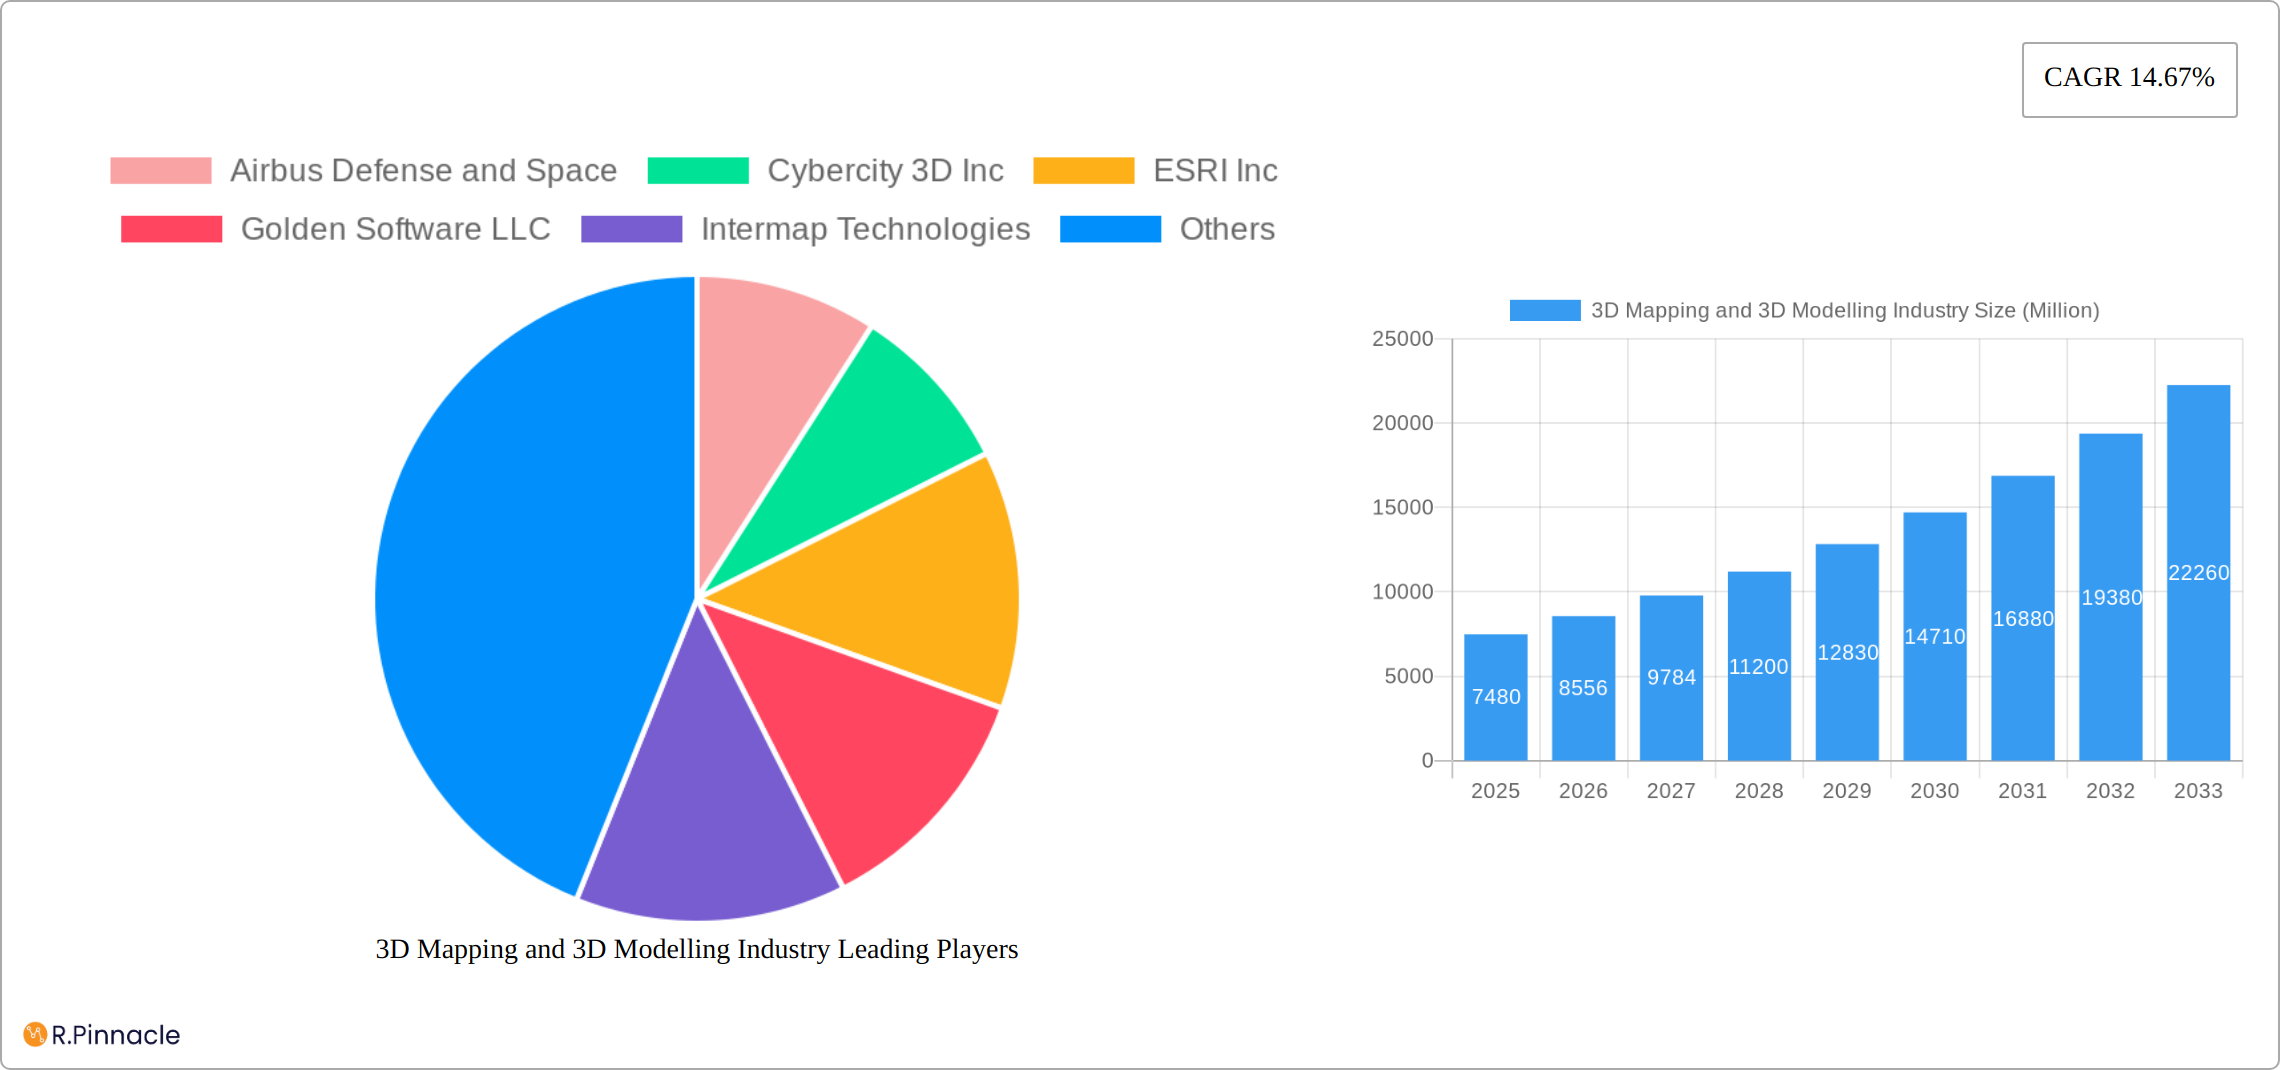
The 3D mapping and 3D modeling market is experiencing robust growth, projected to reach a substantial size with a Compound Annual Growth Rate (CAGR) of 14.67% from 2025 to 2033. This expansion is driven by several key factors. The increasing adoption of digital twins across various sectors, including automotive, healthcare, and building and construction, is fueling demand for accurate and detailed 3D models. Furthermore, advancements in sensor technology, particularly LiDAR and photogrammetry, are enabling the creation of higher-resolution and more accurate 3D maps, enhancing applications like autonomous navigation and precise urban planning. The integration of artificial intelligence (AI) and machine learning (ML) is further accelerating progress by automating data processing and analysis, leading to faster and more efficient 3D model generation. Growth is also spurred by the rising need for immersive experiences in entertainment and media, fostering demand for advanced 3D mapping and modeling techniques for virtual and augmented reality applications.
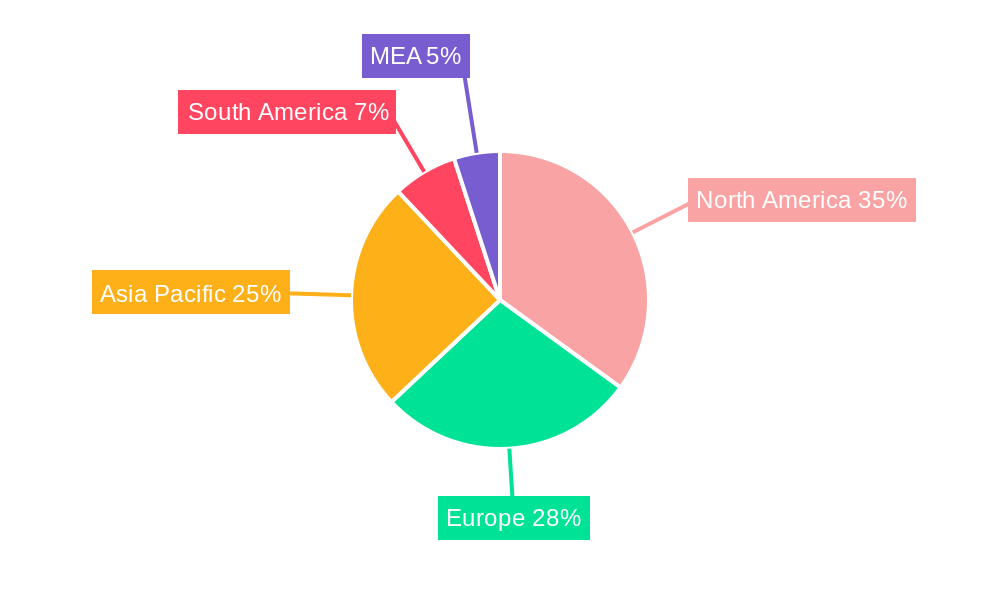
The market is segmented by type (3D mapping and 3D modeling), application (projection mapping, texture mapping, maps and navigation, and other applications), and end-user vertical (entertainment and media, automotive, healthcare, building and construction, defense, transportation, and others). North America currently holds a significant market share, driven by early adoption of technologies and a strong presence of key players. However, Asia-Pacific is expected to witness substantial growth in the coming years, fueled by rapid infrastructure development and increasing investments in technological advancements. While the market faces challenges such as high initial investment costs and the need for skilled professionals, the overall growth trajectory remains positive, indicating significant opportunities for businesses involved in the development and implementation of 3D mapping and modeling solutions. The continued innovation in software and hardware, along with the expanding applications of 3D models across various industries, ensures sustained market growth in the long term.
3D Mapping and 3D Modeling Market Report: 2019-2033
This comprehensive report provides an in-depth analysis of the global 3D Mapping and 3D Modeling market, offering valuable insights for industry professionals, investors, and strategic decision-makers. With a focus on market structure, innovation trends, and future growth projections, this report covers the period from 2019 to 2033, with a base year of 2025 and a forecast period of 2025-2033. The report projects a market valuation exceeding $XX Million by 2033, showcasing significant growth potential.
3D Mapping and 3D Modelling Industry Market Structure & Innovation Trends
The 3D mapping and 3D modeling market is characterized by a moderately concentrated landscape with several key players holding significant market share. Airbus Defense and Space, ESRI Inc, Autodesk Inc, Trimble Inc, and Bentley Systems Inc are amongst the leading companies, collectively accounting for an estimated XX% of the global market share in 2025. The market is driven by continuous innovation in software, hardware, and data acquisition techniques, fueled by advancements in areas like AI, machine learning, and cloud computing. Regulatory frameworks, particularly concerning data privacy and security, significantly influence market dynamics. The presence of substitute technologies, such as traditional 2D mapping, presents a competitive challenge, but the increasing demand for immersive and realistic visualizations is driving adoption of 3D solutions. End-user demographics, with a shift toward younger, tech-savvy professionals, also shapes market demand. M&A activity in the sector is noteworthy, with several deals exceeding $XX Million in value over the historical period (2019-2024), indicating a trend of consolidation and expansion.
- Market Concentration: Moderately concentrated, with top 5 players holding XX% market share (2025).
- Innovation Drivers: AI, Machine Learning, Cloud Computing, improved sensor technologies.
- Regulatory Frameworks: Data privacy regulations, geographic data acquisition policies.
- M&A Activity: Significant activity observed, with deals exceeding $XX Million recorded between 2019-2024.
3D Mapping and 3D Modelling Industry Market Dynamics & Trends
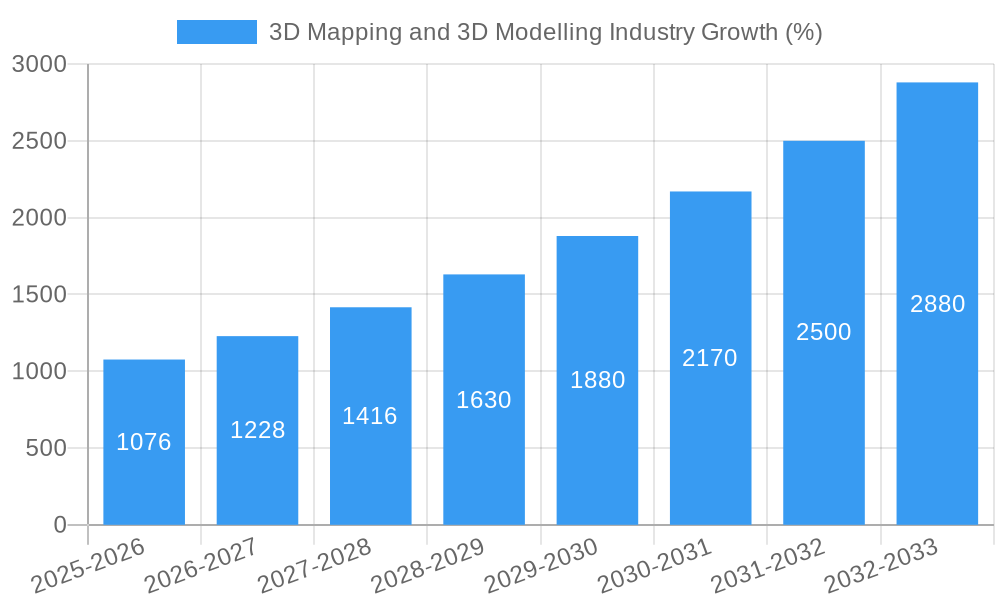
The 3D mapping and 3D modeling market is experiencing robust growth, driven by several key factors. The increasing adoption of 3D technologies across diverse sectors, including automotive, building and construction, and healthcare, is a major catalyst. Technological advancements, such as the development of high-resolution sensors and improved processing capabilities, are significantly enhancing the quality and accessibility of 3D data. Consumer preference is shifting towards immersive experiences and data visualization, further boosting market demand. Competitive dynamics are shaped by the continuous innovation and product launches of leading players, leading to price competition and the development of niche applications. The market is projected to witness a Compound Annual Growth Rate (CAGR) of XX% during the forecast period (2025-2033), with market penetration expected to reach XX% by 2033.
Dominant Regions & Segments in 3D Mapping and 3D Modelling Industry
North America currently holds the largest market share in the 3D mapping and 3D modeling industry, driven by high technological advancements, robust infrastructure, and substantial investment in research and development. Europe and Asia-Pacific are also significant markets, exhibiting strong growth potential.
By Type: The 3D modeling segment currently dominates, owing to its wider applications in various industries, while 3D mapping is projected to experience faster growth due to rising demand for location-based services.
By Application: Maps and Navigation, followed by Building and Construction, are the dominant application segments. Projection Mapping and Texture Mapping are rapidly expanding segments fueled by the Entertainment and Media industry.
By End-user Vertical: Building and Construction is the leading end-user vertical, driven by the growing need for accurate 3D models for planning and execution of construction projects. The Automotive and Healthcare sectors are also showing strong growth.
Key Drivers (by Region):
- North America: Strong R&D investment, advanced infrastructure.
- Europe: High adoption in automotive and building & construction.
- Asia-Pacific: Rapid urbanization, growing infrastructure spending.
3D Mapping and 3D Modelling Industry Product Innovations
Recent product innovations focus on improving the accuracy, efficiency, and accessibility of 3D mapping and modeling solutions. The integration of AI and machine learning algorithms is enabling automated data processing and analysis, while advancements in cloud computing are facilitating collaborative workflows and data sharing. The market is witnessing the emergence of specialized software and hardware solutions tailored to specific industry needs, increasing the market fit and competitive advantages of various offerings.
Report Scope & Segmentation Analysis
This report segments the 3D mapping and 3D modeling market by Type (3D Mapping, 3D Modeling), Application (Projection Mapping, Texture Mapping, Maps and Navigation, Other Applications), and End-user Vertical (Entertainment and Media, Automotive, Healthcare, Building and Construction, Defense, Transportation, Other End-user Verticals). Each segment’s growth trajectory, market size, and competitive landscape are analyzed individually, providing a granular understanding of the market structure and its dynamics. Growth projections for each segment vary based on market adoption rates and technological advancements.
Key Drivers of 3D Mapping and 3D Modelling Industry Growth
The growth of the 3D mapping and 3D modeling market is primarily driven by the increasing demand for precise and accurate spatial data across various sectors. This is fueled by technological advancements in sensor technology, computing power, and data processing techniques. Economic factors, such as rising investments in infrastructure projects and the expansion of urban areas, also contribute significantly. Finally, supportive government regulations and policies that promote the adoption of digital technologies are vital in driving market expansion.
Challenges in the 3D Mapping and 3D Modelling Industry Sector
Key challenges facing the industry include the high initial investment costs associated with acquiring advanced hardware and software. Data security and privacy concerns, particularly regarding the handling of sensitive geographic information, present significant regulatory hurdles. Moreover, the complex integration of various data sources and software platforms can present technical challenges, potentially leading to errors and inconsistencies. The competitive landscape also presents ongoing challenges, particularly around pricing and the rapid innovation in the industry.
Emerging Opportunities in 3D Mapping and 3D Modelling Industry
Emerging opportunities lie in the integration of 3D technologies with other digital platforms, such as the Internet of Things (IoT) and augmented reality (AR). The development of specialized 3D modeling solutions for specific industry verticals (e.g., precision agriculture, environmental monitoring) presents significant growth potential. Furthermore, the increasing adoption of cloud-based solutions and the expansion into new geographic markets, particularly in developing economies, offers significant expansion opportunities.
Leading Players in the 3D Mapping and 3D Modelling Industry Market
- Airbus Defense and Space
- Cybercity 3D Inc
- ESRI Inc
- Golden Software LLC
- Intermap Technologies
- The Foundry Visionmongers Ltd
- Autodesk Inc
- Topcon Positioning Systems Inc
- Trimble Inc
- Bentley Systems Inc
- Saab AB
Key Developments in 3D Mapping and 3D Modelling Industry Industry
- January 2023: Autodesk releases updated software with enhanced AI capabilities for 3D modeling.
- June 2022: Trimble announces a strategic partnership with a leading sensor manufacturer for improved data acquisition.
- October 2021: Acquisition of a smaller 3D mapping company by ESRI for $XX Million.
Future Outlook for 3D Mapping and 3D Modelling Industry Market
The future of the 3D mapping and 3D modeling market is promising, with continued growth driven by technological advancements, increasing industry adoption, and supportive regulatory environments. The integration of 3D technologies across various sectors promises significant expansion, while continuous innovation in software and hardware is expected to enhance efficiency, accuracy, and accessibility. Strategic partnerships and acquisitions will likely further shape the market landscape. The market’s robust growth potential is expected to attract significant investment in research and development, further accelerating its progress.
3D Mapping and 3D Modelling Industry Segmentation
-
1. Type
- 1.1. 3D Mapping
- 1.2. 3D Modeling
-
2. Application
- 2.1. Projection Mapping
- 2.2. Texture Mapping
- 2.3. Maps and Navigation
- 2.4. Other Applications
-
3. End-user Vertical
- 3.1. Entertainment and Media
- 3.2. Automotive
- 3.3. Healthcare
- 3.4. Building and Construction
- 3.5. Defense
- 3.6. Transportation
- 3.7. Other End-user Verticals
3D Mapping and 3D Modelling Industry Segmentation By Geography
- 1. North America
- 2. Europe
- 3. Asia
- 4. Australia and New Zealand
- 5. Latin America
- 6. Middle East and Africa
3D Mapping and 3D Modelling Industry REPORT HIGHLIGHTS
| Aspects | Details |
|---|---|
| Study Period | 2019-2033 |
| Base Year | 2024 |
| Estimated Year | 2025 |
| Forecast Period | 2025-2033 |
| Historical Period | 2019-2024 |
| Growth Rate | CAGR of 14.67% from 2019-2033 |
| Segmentation |
|
Table of Contents
- 1. Introduction
- 1.1. Research Scope
- 1.2. Market Segmentation
- 1.3. Research Methodology
- 1.4. Definitions and Assumptions
- 2. Executive Summary
- 2.1. Introduction
- 3. Market Dynamics
- 3.1. Introduction
- 3.2. Market Drivers
- 3.2.1 Advent of 3D-enabled Display Devices; Advancement of 3D Scanners
- 3.2.2 3D Sensors
- 3.2.3 and Other Acquisition Devices
- 3.3. Market Restrains
- 3.3.1. High Initial Investments
- 3.4. Market Trends
- 3.4.1. Entertainment and Media Segment would Contribute Significantly to the Market Growth
- 4. Market Factor Analysis
- 4.1. Porters Five Forces
- 4.2. Supply/Value Chain
- 4.3. PESTEL analysis
- 4.4. Market Entropy
- 4.5. Patent/Trademark Analysis
- 5. Global 3D Mapping and 3D Modelling Industry Analysis, Insights and Forecast, 2019-2031
- 5.1. Market Analysis, Insights and Forecast - by Type
- 5.1.1. 3D Mapping
- 5.1.2. 3D Modeling
- 5.2. Market Analysis, Insights and Forecast - by Application
- 5.2.1. Projection Mapping
- 5.2.2. Texture Mapping
- 5.2.3. Maps and Navigation
- 5.2.4. Other Applications
- 5.3. Market Analysis, Insights and Forecast - by End-user Vertical
- 5.3.1. Entertainment and Media
- 5.3.2. Automotive
- 5.3.3. Healthcare
- 5.3.4. Building and Construction
- 5.3.5. Defense
- 5.3.6. Transportation
- 5.3.7. Other End-user Verticals
- 5.4. Market Analysis, Insights and Forecast - by Region
- 5.4.1. North America
- 5.4.2. Europe
- 5.4.3. Asia
- 5.4.4. Australia and New Zealand
- 5.4.5. Latin America
- 5.4.6. Middle East and Africa
- 5.1. Market Analysis, Insights and Forecast - by Type
- 6. North America 3D Mapping and 3D Modelling Industry Analysis, Insights and Forecast, 2019-2031
- 6.1. Market Analysis, Insights and Forecast - by Type
- 6.1.1. 3D Mapping
- 6.1.2. 3D Modeling
- 6.2. Market Analysis, Insights and Forecast - by Application
- 6.2.1. Projection Mapping
- 6.2.2. Texture Mapping
- 6.2.3. Maps and Navigation
- 6.2.4. Other Applications
- 6.3. Market Analysis, Insights and Forecast - by End-user Vertical
- 6.3.1. Entertainment and Media
- 6.3.2. Automotive
- 6.3.3. Healthcare
- 6.3.4. Building and Construction
- 6.3.5. Defense
- 6.3.6. Transportation
- 6.3.7. Other End-user Verticals
- 6.1. Market Analysis, Insights and Forecast - by Type
- 7. Europe 3D Mapping and 3D Modelling Industry Analysis, Insights and Forecast, 2019-2031
- 7.1. Market Analysis, Insights and Forecast - by Type
- 7.1.1. 3D Mapping
- 7.1.2. 3D Modeling
- 7.2. Market Analysis, Insights and Forecast - by Application
- 7.2.1. Projection Mapping
- 7.2.2. Texture Mapping
- 7.2.3. Maps and Navigation
- 7.2.4. Other Applications
- 7.3. Market Analysis, Insights and Forecast - by End-user Vertical
- 7.3.1. Entertainment and Media
- 7.3.2. Automotive
- 7.3.3. Healthcare
- 7.3.4. Building and Construction
- 7.3.5. Defense
- 7.3.6. Transportation
- 7.3.7. Other End-user Verticals
- 7.1. Market Analysis, Insights and Forecast - by Type
- 8. Asia 3D Mapping and 3D Modelling Industry Analysis, Insights and Forecast, 2019-2031
- 8.1. Market Analysis, Insights and Forecast - by Type
- 8.1.1. 3D Mapping
- 8.1.2. 3D Modeling
- 8.2. Market Analysis, Insights and Forecast - by Application
- 8.2.1. Projection Mapping
- 8.2.2. Texture Mapping
- 8.2.3. Maps and Navigation
- 8.2.4. Other Applications
- 8.3. Market Analysis, Insights and Forecast - by End-user Vertical
- 8.3.1. Entertainment and Media
- 8.3.2. Automotive
- 8.3.3. Healthcare
- 8.3.4. Building and Construction
- 8.3.5. Defense
- 8.3.6. Transportation
- 8.3.7. Other End-user Verticals
- 8.1. Market Analysis, Insights and Forecast - by Type
- 9. Australia and New Zealand 3D Mapping and 3D Modelling Industry Analysis, Insights and Forecast, 2019-2031
- 9.1. Market Analysis, Insights and Forecast - by Type
- 9.1.1. 3D Mapping
- 9.1.2. 3D Modeling
- 9.2. Market Analysis, Insights and Forecast - by Application
- 9.2.1. Projection Mapping
- 9.2.2. Texture Mapping
- 9.2.3. Maps and Navigation
- 9.2.4. Other Applications
- 9.3. Market Analysis, Insights and Forecast - by End-user Vertical
- 9.3.1. Entertainment and Media
- 9.3.2. Automotive
- 9.3.3. Healthcare
- 9.3.4. Building and Construction
- 9.3.5. Defense
- 9.3.6. Transportation
- 9.3.7. Other End-user Verticals
- 9.1. Market Analysis, Insights and Forecast - by Type
- 10. Latin America 3D Mapping and 3D Modelling Industry Analysis, Insights and Forecast, 2019-2031
- 10.1. Market Analysis, Insights and Forecast - by Type
- 10.1.1. 3D Mapping
- 10.1.2. 3D Modeling
- 10.2. Market Analysis, Insights and Forecast - by Application
- 10.2.1. Projection Mapping
- 10.2.2. Texture Mapping
- 10.2.3. Maps and Navigation
- 10.2.4. Other Applications
- 10.3. Market Analysis, Insights and Forecast - by End-user Vertical
- 10.3.1. Entertainment and Media
- 10.3.2. Automotive
- 10.3.3. Healthcare
- 10.3.4. Building and Construction
- 10.3.5. Defense
- 10.3.6. Transportation
- 10.3.7. Other End-user Verticals
- 10.1. Market Analysis, Insights and Forecast - by Type
- 11. Middle East and Africa 3D Mapping and 3D Modelling Industry Analysis, Insights and Forecast, 2019-2031
- 11.1. Market Analysis, Insights and Forecast - by Type
- 11.1.1. 3D Mapping
- 11.1.2. 3D Modeling
- 11.2. Market Analysis, Insights and Forecast - by Application
- 11.2.1. Projection Mapping
- 11.2.2. Texture Mapping
- 11.2.3. Maps and Navigation
- 11.2.4. Other Applications
- 11.3. Market Analysis, Insights and Forecast - by End-user Vertical
- 11.3.1. Entertainment and Media
- 11.3.2. Automotive
- 11.3.3. Healthcare
- 11.3.4. Building and Construction
- 11.3.5. Defense
- 11.3.6. Transportation
- 11.3.7. Other End-user Verticals
- 11.1. Market Analysis, Insights and Forecast - by Type
- 12. North America 3D Mapping and 3D Modelling Industry Analysis, Insights and Forecast, 2019-2031
- 12.1. Market Analysis, Insights and Forecast - By Country/Sub-region
- 12.1.1 United States
- 12.1.2 Canada
- 12.1.3 Mexico
- 13. Europe 3D Mapping and 3D Modelling Industry Analysis, Insights and Forecast, 2019-2031
- 13.1. Market Analysis, Insights and Forecast - By Country/Sub-region
- 13.1.1 Germany
- 13.1.2 United Kingdom
- 13.1.3 France
- 13.1.4 Spain
- 13.1.5 Italy
- 13.1.6 Spain
- 13.1.7 Belgium
- 13.1.8 Netherland
- 13.1.9 Nordics
- 13.1.10 Rest of Europe
- 14. Asia Pacific 3D Mapping and 3D Modelling Industry Analysis, Insights and Forecast, 2019-2031
- 14.1. Market Analysis, Insights and Forecast - By Country/Sub-region
- 14.1.1 China
- 14.1.2 Japan
- 14.1.3 India
- 14.1.4 South Korea
- 14.1.5 Southeast Asia
- 14.1.6 Australia
- 14.1.7 Indonesia
- 14.1.8 Phillipes
- 14.1.9 Singapore
- 14.1.10 Thailandc
- 14.1.11 Rest of Asia Pacific
- 15. South America 3D Mapping and 3D Modelling Industry Analysis, Insights and Forecast, 2019-2031
- 15.1. Market Analysis, Insights and Forecast - By Country/Sub-region
- 15.1.1 Brazil
- 15.1.2 Argentina
- 15.1.3 Peru
- 15.1.4 Chile
- 15.1.5 Colombia
- 15.1.6 Ecuador
- 15.1.7 Venezuela
- 15.1.8 Rest of South America
- 16. North America 3D Mapping and 3D Modelling Industry Analysis, Insights and Forecast, 2019-2031
- 16.1. Market Analysis, Insights and Forecast - By Country/Sub-region
- 16.1.1 United States
- 16.1.2 Canada
- 16.1.3 Mexico
- 17. MEA 3D Mapping and 3D Modelling Industry Analysis, Insights and Forecast, 2019-2031
- 17.1. Market Analysis, Insights and Forecast - By Country/Sub-region
- 17.1.1 United Arab Emirates
- 17.1.2 Saudi Arabia
- 17.1.3 South Africa
- 17.1.4 Rest of Middle East and Africa
- 18. Competitive Analysis
- 18.1. Global Market Share Analysis 2024
- 18.2. Company Profiles
- 18.2.1 Airbus Defense and Space
- 18.2.1.1. Overview
- 18.2.1.2. Products
- 18.2.1.3. SWOT Analysis
- 18.2.1.4. Recent Developments
- 18.2.1.5. Financials (Based on Availability)
- 18.2.2 Cybercity 3D Inc
- 18.2.2.1. Overview
- 18.2.2.2. Products
- 18.2.2.3. SWOT Analysis
- 18.2.2.4. Recent Developments
- 18.2.2.5. Financials (Based on Availability)
- 18.2.3 ESRI Inc
- 18.2.3.1. Overview
- 18.2.3.2. Products
- 18.2.3.3. SWOT Analysis
- 18.2.3.4. Recent Developments
- 18.2.3.5. Financials (Based on Availability)
- 18.2.4 Golden Software LLC
- 18.2.4.1. Overview
- 18.2.4.2. Products
- 18.2.4.3. SWOT Analysis
- 18.2.4.4. Recent Developments
- 18.2.4.5. Financials (Based on Availability)
- 18.2.5 Intermap Technologies
- 18.2.5.1. Overview
- 18.2.5.2. Products
- 18.2.5.3. SWOT Analysis
- 18.2.5.4. Recent Developments
- 18.2.5.5. Financials (Based on Availability)
- 18.2.6 The Foundry Visionmongers Ltd
- 18.2.6.1. Overview
- 18.2.6.2. Products
- 18.2.6.3. SWOT Analysis
- 18.2.6.4. Recent Developments
- 18.2.6.5. Financials (Based on Availability)
- 18.2.7 Autodesk Inc
- 18.2.7.1. Overview
- 18.2.7.2. Products
- 18.2.7.3. SWOT Analysis
- 18.2.7.4. Recent Developments
- 18.2.7.5. Financials (Based on Availability)
- 18.2.8 Topcon Positioning Systems Inc
- 18.2.8.1. Overview
- 18.2.8.2. Products
- 18.2.8.3. SWOT Analysis
- 18.2.8.4. Recent Developments
- 18.2.8.5. Financials (Based on Availability)
- 18.2.9 Trimble Inc
- 18.2.9.1. Overview
- 18.2.9.2. Products
- 18.2.9.3. SWOT Analysis
- 18.2.9.4. Recent Developments
- 18.2.9.5. Financials (Based on Availability)
- 18.2.10 Bentley Systems Inc
- 18.2.10.1. Overview
- 18.2.10.2. Products
- 18.2.10.3. SWOT Analysis
- 18.2.10.4. Recent Developments
- 18.2.10.5. Financials (Based on Availability)
- 18.2.11 Saab AB
- 18.2.11.1. Overview
- 18.2.11.2. Products
- 18.2.11.3. SWOT Analysis
- 18.2.11.4. Recent Developments
- 18.2.11.5. Financials (Based on Availability)
- 18.2.1 Airbus Defense and Space
List of Figures
- Figure 1: Global 3D Mapping and 3D Modelling Industry Revenue Breakdown (Million, %) by Region 2024 & 2032
- Figure 2: Global 3D Mapping and 3D Modelling Industry Volume Breakdown (K Unit, %) by Region 2024 & 2032
- Figure 3: North America 3D Mapping and 3D Modelling Industry Revenue (Million), by Country 2024 & 2032
- Figure 4: North America 3D Mapping and 3D Modelling Industry Volume (K Unit), by Country 2024 & 2032
- Figure 5: North America 3D Mapping and 3D Modelling Industry Revenue Share (%), by Country 2024 & 2032
- Figure 6: North America 3D Mapping and 3D Modelling Industry Volume Share (%), by Country 2024 & 2032
- Figure 7: Europe 3D Mapping and 3D Modelling Industry Revenue (Million), by Country 2024 & 2032
- Figure 8: Europe 3D Mapping and 3D Modelling Industry Volume (K Unit), by Country 2024 & 2032
- Figure 9: Europe 3D Mapping and 3D Modelling Industry Revenue Share (%), by Country 2024 & 2032
- Figure 10: Europe 3D Mapping and 3D Modelling Industry Volume Share (%), by Country 2024 & 2032
- Figure 11: Asia Pacific 3D Mapping and 3D Modelling Industry Revenue (Million), by Country 2024 & 2032
- Figure 12: Asia Pacific 3D Mapping and 3D Modelling Industry Volume (K Unit), by Country 2024 & 2032
- Figure 13: Asia Pacific 3D Mapping and 3D Modelling Industry Revenue Share (%), by Country 2024 & 2032
- Figure 14: Asia Pacific 3D Mapping and 3D Modelling Industry Volume Share (%), by Country 2024 & 2032
- Figure 15: South America 3D Mapping and 3D Modelling Industry Revenue (Million), by Country 2024 & 2032
- Figure 16: South America 3D Mapping and 3D Modelling Industry Volume (K Unit), by Country 2024 & 2032
- Figure 17: South America 3D Mapping and 3D Modelling Industry Revenue Share (%), by Country 2024 & 2032
- Figure 18: South America 3D Mapping and 3D Modelling Industry Volume Share (%), by Country 2024 & 2032
- Figure 19: North America 3D Mapping and 3D Modelling Industry Revenue (Million), by Country 2024 & 2032
- Figure 20: North America 3D Mapping and 3D Modelling Industry Volume (K Unit), by Country 2024 & 2032
- Figure 21: North America 3D Mapping and 3D Modelling Industry Revenue Share (%), by Country 2024 & 2032
- Figure 22: North America 3D Mapping and 3D Modelling Industry Volume Share (%), by Country 2024 & 2032
- Figure 23: MEA 3D Mapping and 3D Modelling Industry Revenue (Million), by Country 2024 & 2032
- Figure 24: MEA 3D Mapping and 3D Modelling Industry Volume (K Unit), by Country 2024 & 2032
- Figure 25: MEA 3D Mapping and 3D Modelling Industry Revenue Share (%), by Country 2024 & 2032
- Figure 26: MEA 3D Mapping and 3D Modelling Industry Volume Share (%), by Country 2024 & 2032
- Figure 27: North America 3D Mapping and 3D Modelling Industry Revenue (Million), by Type 2024 & 2032
- Figure 28: North America 3D Mapping and 3D Modelling Industry Volume (K Unit), by Type 2024 & 2032
- Figure 29: North America 3D Mapping and 3D Modelling Industry Revenue Share (%), by Type 2024 & 2032
- Figure 30: North America 3D Mapping and 3D Modelling Industry Volume Share (%), by Type 2024 & 2032
- Figure 31: North America 3D Mapping and 3D Modelling Industry Revenue (Million), by Application 2024 & 2032
- Figure 32: North America 3D Mapping and 3D Modelling Industry Volume (K Unit), by Application 2024 & 2032
- Figure 33: North America 3D Mapping and 3D Modelling Industry Revenue Share (%), by Application 2024 & 2032
- Figure 34: North America 3D Mapping and 3D Modelling Industry Volume Share (%), by Application 2024 & 2032
- Figure 35: North America 3D Mapping and 3D Modelling Industry Revenue (Million), by End-user Vertical 2024 & 2032
- Figure 36: North America 3D Mapping and 3D Modelling Industry Volume (K Unit), by End-user Vertical 2024 & 2032
- Figure 37: North America 3D Mapping and 3D Modelling Industry Revenue Share (%), by End-user Vertical 2024 & 2032
- Figure 38: North America 3D Mapping and 3D Modelling Industry Volume Share (%), by End-user Vertical 2024 & 2032
- Figure 39: North America 3D Mapping and 3D Modelling Industry Revenue (Million), by Country 2024 & 2032
- Figure 40: North America 3D Mapping and 3D Modelling Industry Volume (K Unit), by Country 2024 & 2032
- Figure 41: North America 3D Mapping and 3D Modelling Industry Revenue Share (%), by Country 2024 & 2032
- Figure 42: North America 3D Mapping and 3D Modelling Industry Volume Share (%), by Country 2024 & 2032
- Figure 43: Europe 3D Mapping and 3D Modelling Industry Revenue (Million), by Type 2024 & 2032
- Figure 44: Europe 3D Mapping and 3D Modelling Industry Volume (K Unit), by Type 2024 & 2032
- Figure 45: Europe 3D Mapping and 3D Modelling Industry Revenue Share (%), by Type 2024 & 2032
- Figure 46: Europe 3D Mapping and 3D Modelling Industry Volume Share (%), by Type 2024 & 2032
- Figure 47: Europe 3D Mapping and 3D Modelling Industry Revenue (Million), by Application 2024 & 2032
- Figure 48: Europe 3D Mapping and 3D Modelling Industry Volume (K Unit), by Application 2024 & 2032
- Figure 49: Europe 3D Mapping and 3D Modelling Industry Revenue Share (%), by Application 2024 & 2032
- Figure 50: Europe 3D Mapping and 3D Modelling Industry Volume Share (%), by Application 2024 & 2032
- Figure 51: Europe 3D Mapping and 3D Modelling Industry Revenue (Million), by End-user Vertical 2024 & 2032
- Figure 52: Europe 3D Mapping and 3D Modelling Industry Volume (K Unit), by End-user Vertical 2024 & 2032
- Figure 53: Europe 3D Mapping and 3D Modelling Industry Revenue Share (%), by End-user Vertical 2024 & 2032
- Figure 54: Europe 3D Mapping and 3D Modelling Industry Volume Share (%), by End-user Vertical 2024 & 2032
- Figure 55: Europe 3D Mapping and 3D Modelling Industry Revenue (Million), by Country 2024 & 2032
- Figure 56: Europe 3D Mapping and 3D Modelling Industry Volume (K Unit), by Country 2024 & 2032
- Figure 57: Europe 3D Mapping and 3D Modelling Industry Revenue Share (%), by Country 2024 & 2032
- Figure 58: Europe 3D Mapping and 3D Modelling Industry Volume Share (%), by Country 2024 & 2032
- Figure 59: Asia 3D Mapping and 3D Modelling Industry Revenue (Million), by Type 2024 & 2032
- Figure 60: Asia 3D Mapping and 3D Modelling Industry Volume (K Unit), by Type 2024 & 2032
- Figure 61: Asia 3D Mapping and 3D Modelling Industry Revenue Share (%), by Type 2024 & 2032
- Figure 62: Asia 3D Mapping and 3D Modelling Industry Volume Share (%), by Type 2024 & 2032
- Figure 63: Asia 3D Mapping and 3D Modelling Industry Revenue (Million), by Application 2024 & 2032
- Figure 64: Asia 3D Mapping and 3D Modelling Industry Volume (K Unit), by Application 2024 & 2032
- Figure 65: Asia 3D Mapping and 3D Modelling Industry Revenue Share (%), by Application 2024 & 2032
- Figure 66: Asia 3D Mapping and 3D Modelling Industry Volume Share (%), by Application 2024 & 2032
- Figure 67: Asia 3D Mapping and 3D Modelling Industry Revenue (Million), by End-user Vertical 2024 & 2032
- Figure 68: Asia 3D Mapping and 3D Modelling Industry Volume (K Unit), by End-user Vertical 2024 & 2032
- Figure 69: Asia 3D Mapping and 3D Modelling Industry Revenue Share (%), by End-user Vertical 2024 & 2032
- Figure 70: Asia 3D Mapping and 3D Modelling Industry Volume Share (%), by End-user Vertical 2024 & 2032
- Figure 71: Asia 3D Mapping and 3D Modelling Industry Revenue (Million), by Country 2024 & 2032
- Figure 72: Asia 3D Mapping and 3D Modelling Industry Volume (K Unit), by Country 2024 & 2032
- Figure 73: Asia 3D Mapping and 3D Modelling Industry Revenue Share (%), by Country 2024 & 2032
- Figure 74: Asia 3D Mapping and 3D Modelling Industry Volume Share (%), by Country 2024 & 2032
- Figure 75: Australia and New Zealand 3D Mapping and 3D Modelling Industry Revenue (Million), by Type 2024 & 2032
- Figure 76: Australia and New Zealand 3D Mapping and 3D Modelling Industry Volume (K Unit), by Type 2024 & 2032
- Figure 77: Australia and New Zealand 3D Mapping and 3D Modelling Industry Revenue Share (%), by Type 2024 & 2032
- Figure 78: Australia and New Zealand 3D Mapping and 3D Modelling Industry Volume Share (%), by Type 2024 & 2032
- Figure 79: Australia and New Zealand 3D Mapping and 3D Modelling Industry Revenue (Million), by Application 2024 & 2032
- Figure 80: Australia and New Zealand 3D Mapping and 3D Modelling Industry Volume (K Unit), by Application 2024 & 2032
- Figure 81: Australia and New Zealand 3D Mapping and 3D Modelling Industry Revenue Share (%), by Application 2024 & 2032
- Figure 82: Australia and New Zealand 3D Mapping and 3D Modelling Industry Volume Share (%), by Application 2024 & 2032
- Figure 83: Australia and New Zealand 3D Mapping and 3D Modelling Industry Revenue (Million), by End-user Vertical 2024 & 2032
- Figure 84: Australia and New Zealand 3D Mapping and 3D Modelling Industry Volume (K Unit), by End-user Vertical 2024 & 2032
- Figure 85: Australia and New Zealand 3D Mapping and 3D Modelling Industry Revenue Share (%), by End-user Vertical 2024 & 2032
- Figure 86: Australia and New Zealand 3D Mapping and 3D Modelling Industry Volume Share (%), by End-user Vertical 2024 & 2032
- Figure 87: Australia and New Zealand 3D Mapping and 3D Modelling Industry Revenue (Million), by Country 2024 & 2032
- Figure 88: Australia and New Zealand 3D Mapping and 3D Modelling Industry Volume (K Unit), by Country 2024 & 2032
- Figure 89: Australia and New Zealand 3D Mapping and 3D Modelling Industry Revenue Share (%), by Country 2024 & 2032
- Figure 90: Australia and New Zealand 3D Mapping and 3D Modelling Industry Volume Share (%), by Country 2024 & 2032
- Figure 91: Latin America 3D Mapping and 3D Modelling Industry Revenue (Million), by Type 2024 & 2032
- Figure 92: Latin America 3D Mapping and 3D Modelling Industry Volume (K Unit), by Type 2024 & 2032
- Figure 93: Latin America 3D Mapping and 3D Modelling Industry Revenue Share (%), by Type 2024 & 2032
- Figure 94: Latin America 3D Mapping and 3D Modelling Industry Volume Share (%), by Type 2024 & 2032
- Figure 95: Latin America 3D Mapping and 3D Modelling Industry Revenue (Million), by Application 2024 & 2032
- Figure 96: Latin America 3D Mapping and 3D Modelling Industry Volume (K Unit), by Application 2024 & 2032
- Figure 97: Latin America 3D Mapping and 3D Modelling Industry Revenue Share (%), by Application 2024 & 2032
- Figure 98: Latin America 3D Mapping and 3D Modelling Industry Volume Share (%), by Application 2024 & 2032
- Figure 99: Latin America 3D Mapping and 3D Modelling Industry Revenue (Million), by End-user Vertical 2024 & 2032
- Figure 100: Latin America 3D Mapping and 3D Modelling Industry Volume (K Unit), by End-user Vertical 2024 & 2032
- Figure 101: Latin America 3D Mapping and 3D Modelling Industry Revenue Share (%), by End-user Vertical 2024 & 2032
- Figure 102: Latin America 3D Mapping and 3D Modelling Industry Volume Share (%), by End-user Vertical 2024 & 2032
- Figure 103: Latin America 3D Mapping and 3D Modelling Industry Revenue (Million), by Country 2024 & 2032
- Figure 104: Latin America 3D Mapping and 3D Modelling Industry Volume (K Unit), by Country 2024 & 2032
- Figure 105: Latin America 3D Mapping and 3D Modelling Industry Revenue Share (%), by Country 2024 & 2032
- Figure 106: Latin America 3D Mapping and 3D Modelling Industry Volume Share (%), by Country 2024 & 2032
- Figure 107: Middle East and Africa 3D Mapping and 3D Modelling Industry Revenue (Million), by Type 2024 & 2032
- Figure 108: Middle East and Africa 3D Mapping and 3D Modelling Industry Volume (K Unit), by Type 2024 & 2032
- Figure 109: Middle East and Africa 3D Mapping and 3D Modelling Industry Revenue Share (%), by Type 2024 & 2032
- Figure 110: Middle East and Africa 3D Mapping and 3D Modelling Industry Volume Share (%), by Type 2024 & 2032
- Figure 111: Middle East and Africa 3D Mapping and 3D Modelling Industry Revenue (Million), by Application 2024 & 2032
- Figure 112: Middle East and Africa 3D Mapping and 3D Modelling Industry Volume (K Unit), by Application 2024 & 2032
- Figure 113: Middle East and Africa 3D Mapping and 3D Modelling Industry Revenue Share (%), by Application 2024 & 2032
- Figure 114: Middle East and Africa 3D Mapping and 3D Modelling Industry Volume Share (%), by Application 2024 & 2032
- Figure 115: Middle East and Africa 3D Mapping and 3D Modelling Industry Revenue (Million), by End-user Vertical 2024 & 2032
- Figure 116: Middle East and Africa 3D Mapping and 3D Modelling Industry Volume (K Unit), by End-user Vertical 2024 & 2032
- Figure 117: Middle East and Africa 3D Mapping and 3D Modelling Industry Revenue Share (%), by End-user Vertical 2024 & 2032
- Figure 118: Middle East and Africa 3D Mapping and 3D Modelling Industry Volume Share (%), by End-user Vertical 2024 & 2032
- Figure 119: Middle East and Africa 3D Mapping and 3D Modelling Industry Revenue (Million), by Country 2024 & 2032
- Figure 120: Middle East and Africa 3D Mapping and 3D Modelling Industry Volume (K Unit), by Country 2024 & 2032
- Figure 121: Middle East and Africa 3D Mapping and 3D Modelling Industry Revenue Share (%), by Country 2024 & 2032
- Figure 122: Middle East and Africa 3D Mapping and 3D Modelling Industry Volume Share (%), by Country 2024 & 2032
List of Tables
- Table 1: Global 3D Mapping and 3D Modelling Industry Revenue Million Forecast, by Region 2019 & 2032
- Table 2: Global 3D Mapping and 3D Modelling Industry Volume K Unit Forecast, by Region 2019 & 2032
- Table 3: Global 3D Mapping and 3D Modelling Industry Revenue Million Forecast, by Type 2019 & 2032
- Table 4: Global 3D Mapping and 3D Modelling Industry Volume K Unit Forecast, by Type 2019 & 2032
- Table 5: Global 3D Mapping and 3D Modelling Industry Revenue Million Forecast, by Application 2019 & 2032
- Table 6: Global 3D Mapping and 3D Modelling Industry Volume K Unit Forecast, by Application 2019 & 2032
- Table 7: Global 3D Mapping and 3D Modelling Industry Revenue Million Forecast, by End-user Vertical 2019 & 2032
- Table 8: Global 3D Mapping and 3D Modelling Industry Volume K Unit Forecast, by End-user Vertical 2019 & 2032
- Table 9: Global 3D Mapping and 3D Modelling Industry Revenue Million Forecast, by Region 2019 & 2032
- Table 10: Global 3D Mapping and 3D Modelling Industry Volume K Unit Forecast, by Region 2019 & 2032
- Table 11: Global 3D Mapping and 3D Modelling Industry Revenue Million Forecast, by Country 2019 & 2032
- Table 12: Global 3D Mapping and 3D Modelling Industry Volume K Unit Forecast, by Country 2019 & 2032
- Table 13: United States 3D Mapping and 3D Modelling Industry Revenue (Million) Forecast, by Application 2019 & 2032
- Table 14: United States 3D Mapping and 3D Modelling Industry Volume (K Unit) Forecast, by Application 2019 & 2032
- Table 15: Canada 3D Mapping and 3D Modelling Industry Revenue (Million) Forecast, by Application 2019 & 2032
- Table 16: Canada 3D Mapping and 3D Modelling Industry Volume (K Unit) Forecast, by Application 2019 & 2032
- Table 17: Mexico 3D Mapping and 3D Modelling Industry Revenue (Million) Forecast, by Application 2019 & 2032
- Table 18: Mexico 3D Mapping and 3D Modelling Industry Volume (K Unit) Forecast, by Application 2019 & 2032
- Table 19: Global 3D Mapping and 3D Modelling Industry Revenue Million Forecast, by Country 2019 & 2032
- Table 20: Global 3D Mapping and 3D Modelling Industry Volume K Unit Forecast, by Country 2019 & 2032
- Table 21: Germany 3D Mapping and 3D Modelling Industry Revenue (Million) Forecast, by Application 2019 & 2032
- Table 22: Germany 3D Mapping and 3D Modelling Industry Volume (K Unit) Forecast, by Application 2019 & 2032
- Table 23: United Kingdom 3D Mapping and 3D Modelling Industry Revenue (Million) Forecast, by Application 2019 & 2032
- Table 24: United Kingdom 3D Mapping and 3D Modelling Industry Volume (K Unit) Forecast, by Application 2019 & 2032
- Table 25: France 3D Mapping and 3D Modelling Industry Revenue (Million) Forecast, by Application 2019 & 2032
- Table 26: France 3D Mapping and 3D Modelling Industry Volume (K Unit) Forecast, by Application 2019 & 2032
- Table 27: Spain 3D Mapping and 3D Modelling Industry Revenue (Million) Forecast, by Application 2019 & 2032
- Table 28: Spain 3D Mapping and 3D Modelling Industry Volume (K Unit) Forecast, by Application 2019 & 2032
- Table 29: Italy 3D Mapping and 3D Modelling Industry Revenue (Million) Forecast, by Application 2019 & 2032
- Table 30: Italy 3D Mapping and 3D Modelling Industry Volume (K Unit) Forecast, by Application 2019 & 2032
- Table 31: Spain 3D Mapping and 3D Modelling Industry Revenue (Million) Forecast, by Application 2019 & 2032
- Table 32: Spain 3D Mapping and 3D Modelling Industry Volume (K Unit) Forecast, by Application 2019 & 2032
- Table 33: Belgium 3D Mapping and 3D Modelling Industry Revenue (Million) Forecast, by Application 2019 & 2032
- Table 34: Belgium 3D Mapping and 3D Modelling Industry Volume (K Unit) Forecast, by Application 2019 & 2032
- Table 35: Netherland 3D Mapping and 3D Modelling Industry Revenue (Million) Forecast, by Application 2019 & 2032
- Table 36: Netherland 3D Mapping and 3D Modelling Industry Volume (K Unit) Forecast, by Application 2019 & 2032
- Table 37: Nordics 3D Mapping and 3D Modelling Industry Revenue (Million) Forecast, by Application 2019 & 2032
- Table 38: Nordics 3D Mapping and 3D Modelling Industry Volume (K Unit) Forecast, by Application 2019 & 2032
- Table 39: Rest of Europe 3D Mapping and 3D Modelling Industry Revenue (Million) Forecast, by Application 2019 & 2032
- Table 40: Rest of Europe 3D Mapping and 3D Modelling Industry Volume (K Unit) Forecast, by Application 2019 & 2032
- Table 41: Global 3D Mapping and 3D Modelling Industry Revenue Million Forecast, by Country 2019 & 2032
- Table 42: Global 3D Mapping and 3D Modelling Industry Volume K Unit Forecast, by Country 2019 & 2032
- Table 43: China 3D Mapping and 3D Modelling Industry Revenue (Million) Forecast, by Application 2019 & 2032
- Table 44: China 3D Mapping and 3D Modelling Industry Volume (K Unit) Forecast, by Application 2019 & 2032
- Table 45: Japan 3D Mapping and 3D Modelling Industry Revenue (Million) Forecast, by Application 2019 & 2032
- Table 46: Japan 3D Mapping and 3D Modelling Industry Volume (K Unit) Forecast, by Application 2019 & 2032
- Table 47: India 3D Mapping and 3D Modelling Industry Revenue (Million) Forecast, by Application 2019 & 2032
- Table 48: India 3D Mapping and 3D Modelling Industry Volume (K Unit) Forecast, by Application 2019 & 2032
- Table 49: South Korea 3D Mapping and 3D Modelling Industry Revenue (Million) Forecast, by Application 2019 & 2032
- Table 50: South Korea 3D Mapping and 3D Modelling Industry Volume (K Unit) Forecast, by Application 2019 & 2032
- Table 51: Southeast Asia 3D Mapping and 3D Modelling Industry Revenue (Million) Forecast, by Application 2019 & 2032
- Table 52: Southeast Asia 3D Mapping and 3D Modelling Industry Volume (K Unit) Forecast, by Application 2019 & 2032
- Table 53: Australia 3D Mapping and 3D Modelling Industry Revenue (Million) Forecast, by Application 2019 & 2032
- Table 54: Australia 3D Mapping and 3D Modelling Industry Volume (K Unit) Forecast, by Application 2019 & 2032
- Table 55: Indonesia 3D Mapping and 3D Modelling Industry Revenue (Million) Forecast, by Application 2019 & 2032
- Table 56: Indonesia 3D Mapping and 3D Modelling Industry Volume (K Unit) Forecast, by Application 2019 & 2032
- Table 57: Phillipes 3D Mapping and 3D Modelling Industry Revenue (Million) Forecast, by Application 2019 & 2032
- Table 58: Phillipes 3D Mapping and 3D Modelling Industry Volume (K Unit) Forecast, by Application 2019 & 2032
- Table 59: Singapore 3D Mapping and 3D Modelling Industry Revenue (Million) Forecast, by Application 2019 & 2032
- Table 60: Singapore 3D Mapping and 3D Modelling Industry Volume (K Unit) Forecast, by Application 2019 & 2032
- Table 61: Thailandc 3D Mapping and 3D Modelling Industry Revenue (Million) Forecast, by Application 2019 & 2032
- Table 62: Thailandc 3D Mapping and 3D Modelling Industry Volume (K Unit) Forecast, by Application 2019 & 2032
- Table 63: Rest of Asia Pacific 3D Mapping and 3D Modelling Industry Revenue (Million) Forecast, by Application 2019 & 2032
- Table 64: Rest of Asia Pacific 3D Mapping and 3D Modelling Industry Volume (K Unit) Forecast, by Application 2019 & 2032
- Table 65: Global 3D Mapping and 3D Modelling Industry Revenue Million Forecast, by Country 2019 & 2032
- Table 66: Global 3D Mapping and 3D Modelling Industry Volume K Unit Forecast, by Country 2019 & 2032
- Table 67: Brazil 3D Mapping and 3D Modelling Industry Revenue (Million) Forecast, by Application 2019 & 2032
- Table 68: Brazil 3D Mapping and 3D Modelling Industry Volume (K Unit) Forecast, by Application 2019 & 2032
- Table 69: Argentina 3D Mapping and 3D Modelling Industry Revenue (Million) Forecast, by Application 2019 & 2032
- Table 70: Argentina 3D Mapping and 3D Modelling Industry Volume (K Unit) Forecast, by Application 2019 & 2032
- Table 71: Peru 3D Mapping and 3D Modelling Industry Revenue (Million) Forecast, by Application 2019 & 2032
- Table 72: Peru 3D Mapping and 3D Modelling Industry Volume (K Unit) Forecast, by Application 2019 & 2032
- Table 73: Chile 3D Mapping and 3D Modelling Industry Revenue (Million) Forecast, by Application 2019 & 2032
- Table 74: Chile 3D Mapping and 3D Modelling Industry Volume (K Unit) Forecast, by Application 2019 & 2032
- Table 75: Colombia 3D Mapping and 3D Modelling Industry Revenue (Million) Forecast, by Application 2019 & 2032
- Table 76: Colombia 3D Mapping and 3D Modelling Industry Volume (K Unit) Forecast, by Application 2019 & 2032
- Table 77: Ecuador 3D Mapping and 3D Modelling Industry Revenue (Million) Forecast, by Application 2019 & 2032
- Table 78: Ecuador 3D Mapping and 3D Modelling Industry Volume (K Unit) Forecast, by Application 2019 & 2032
- Table 79: Venezuela 3D Mapping and 3D Modelling Industry Revenue (Million) Forecast, by Application 2019 & 2032
- Table 80: Venezuela 3D Mapping and 3D Modelling Industry Volume (K Unit) Forecast, by Application 2019 & 2032
- Table 81: Rest of South America 3D Mapping and 3D Modelling Industry Revenue (Million) Forecast, by Application 2019 & 2032
- Table 82: Rest of South America 3D Mapping and 3D Modelling Industry Volume (K Unit) Forecast, by Application 2019 & 2032
- Table 83: Global 3D Mapping and 3D Modelling Industry Revenue Million Forecast, by Country 2019 & 2032
- Table 84: Global 3D Mapping and 3D Modelling Industry Volume K Unit Forecast, by Country 2019 & 2032
- Table 85: United States 3D Mapping and 3D Modelling Industry Revenue (Million) Forecast, by Application 2019 & 2032
- Table 86: United States 3D Mapping and 3D Modelling Industry Volume (K Unit) Forecast, by Application 2019 & 2032
- Table 87: Canada 3D Mapping and 3D Modelling Industry Revenue (Million) Forecast, by Application 2019 & 2032
- Table 88: Canada 3D Mapping and 3D Modelling Industry Volume (K Unit) Forecast, by Application 2019 & 2032
- Table 89: Mexico 3D Mapping and 3D Modelling Industry Revenue (Million) Forecast, by Application 2019 & 2032
- Table 90: Mexico 3D Mapping and 3D Modelling Industry Volume (K Unit) Forecast, by Application 2019 & 2032
- Table 91: Global 3D Mapping and 3D Modelling Industry Revenue Million Forecast, by Country 2019 & 2032
- Table 92: Global 3D Mapping and 3D Modelling Industry Volume K Unit Forecast, by Country 2019 & 2032
- Table 93: United Arab Emirates 3D Mapping and 3D Modelling Industry Revenue (Million) Forecast, by Application 2019 & 2032
- Table 94: United Arab Emirates 3D Mapping and 3D Modelling Industry Volume (K Unit) Forecast, by Application 2019 & 2032
- Table 95: Saudi Arabia 3D Mapping and 3D Modelling Industry Revenue (Million) Forecast, by Application 2019 & 2032
- Table 96: Saudi Arabia 3D Mapping and 3D Modelling Industry Volume (K Unit) Forecast, by Application 2019 & 2032
- Table 97: South Africa 3D Mapping and 3D Modelling Industry Revenue (Million) Forecast, by Application 2019 & 2032
- Table 98: South Africa 3D Mapping and 3D Modelling Industry Volume (K Unit) Forecast, by Application 2019 & 2032
- Table 99: Rest of Middle East and Africa 3D Mapping and 3D Modelling Industry Revenue (Million) Forecast, by Application 2019 & 2032
- Table 100: Rest of Middle East and Africa 3D Mapping and 3D Modelling Industry Volume (K Unit) Forecast, by Application 2019 & 2032
- Table 101: Global 3D Mapping and 3D Modelling Industry Revenue Million Forecast, by Type 2019 & 2032
- Table 102: Global 3D Mapping and 3D Modelling Industry Volume K Unit Forecast, by Type 2019 & 2032
- Table 103: Global 3D Mapping and 3D Modelling Industry Revenue Million Forecast, by Application 2019 & 2032
- Table 104: Global 3D Mapping and 3D Modelling Industry Volume K Unit Forecast, by Application 2019 & 2032
- Table 105: Global 3D Mapping and 3D Modelling Industry Revenue Million Forecast, by End-user Vertical 2019 & 2032
- Table 106: Global 3D Mapping and 3D Modelling Industry Volume K Unit Forecast, by End-user Vertical 2019 & 2032
- Table 107: Global 3D Mapping and 3D Modelling Industry Revenue Million Forecast, by Country 2019 & 2032
- Table 108: Global 3D Mapping and 3D Modelling Industry Volume K Unit Forecast, by Country 2019 & 2032
- Table 109: Global 3D Mapping and 3D Modelling Industry Revenue Million Forecast, by Type 2019 & 2032
- Table 110: Global 3D Mapping and 3D Modelling Industry Volume K Unit Forecast, by Type 2019 & 2032
- Table 111: Global 3D Mapping and 3D Modelling Industry Revenue Million Forecast, by Application 2019 & 2032
- Table 112: Global 3D Mapping and 3D Modelling Industry Volume K Unit Forecast, by Application 2019 & 2032
- Table 113: Global 3D Mapping and 3D Modelling Industry Revenue Million Forecast, by End-user Vertical 2019 & 2032
- Table 114: Global 3D Mapping and 3D Modelling Industry Volume K Unit Forecast, by End-user Vertical 2019 & 2032
- Table 115: Global 3D Mapping and 3D Modelling Industry Revenue Million Forecast, by Country 2019 & 2032
- Table 116: Global 3D Mapping and 3D Modelling Industry Volume K Unit Forecast, by Country 2019 & 2032
- Table 117: Global 3D Mapping and 3D Modelling Industry Revenue Million Forecast, by Type 2019 & 2032
- Table 118: Global 3D Mapping and 3D Modelling Industry Volume K Unit Forecast, by Type 2019 & 2032
- Table 119: Global 3D Mapping and 3D Modelling Industry Revenue Million Forecast, by Application 2019 & 2032
- Table 120: Global 3D Mapping and 3D Modelling Industry Volume K Unit Forecast, by Application 2019 & 2032
- Table 121: Global 3D Mapping and 3D Modelling Industry Revenue Million Forecast, by End-user Vertical 2019 & 2032
- Table 122: Global 3D Mapping and 3D Modelling Industry Volume K Unit Forecast, by End-user Vertical 2019 & 2032
- Table 123: Global 3D Mapping and 3D Modelling Industry Revenue Million Forecast, by Country 2019 & 2032
- Table 124: Global 3D Mapping and 3D Modelling Industry Volume K Unit Forecast, by Country 2019 & 2032
- Table 125: Global 3D Mapping and 3D Modelling Industry Revenue Million Forecast, by Type 2019 & 2032
- Table 126: Global 3D Mapping and 3D Modelling Industry Volume K Unit Forecast, by Type 2019 & 2032
- Table 127: Global 3D Mapping and 3D Modelling Industry Revenue Million Forecast, by Application 2019 & 2032
- Table 128: Global 3D Mapping and 3D Modelling Industry Volume K Unit Forecast, by Application 2019 & 2032
- Table 129: Global 3D Mapping and 3D Modelling Industry Revenue Million Forecast, by End-user Vertical 2019 & 2032
- Table 130: Global 3D Mapping and 3D Modelling Industry Volume K Unit Forecast, by End-user Vertical 2019 & 2032
- Table 131: Global 3D Mapping and 3D Modelling Industry Revenue Million Forecast, by Country 2019 & 2032
- Table 132: Global 3D Mapping and 3D Modelling Industry Volume K Unit Forecast, by Country 2019 & 2032
- Table 133: Global 3D Mapping and 3D Modelling Industry Revenue Million Forecast, by Type 2019 & 2032
- Table 134: Global 3D Mapping and 3D Modelling Industry Volume K Unit Forecast, by Type 2019 & 2032
- Table 135: Global 3D Mapping and 3D Modelling Industry Revenue Million Forecast, by Application 2019 & 2032
- Table 136: Global 3D Mapping and 3D Modelling Industry Volume K Unit Forecast, by Application 2019 & 2032
- Table 137: Global 3D Mapping and 3D Modelling Industry Revenue Million Forecast, by End-user Vertical 2019 & 2032
- Table 138: Global 3D Mapping and 3D Modelling Industry Volume K Unit Forecast, by End-user Vertical 2019 & 2032
- Table 139: Global 3D Mapping and 3D Modelling Industry Revenue Million Forecast, by Country 2019 & 2032
- Table 140: Global 3D Mapping and 3D Modelling Industry Volume K Unit Forecast, by Country 2019 & 2032
- Table 141: Global 3D Mapping and 3D Modelling Industry Revenue Million Forecast, by Type 2019 & 2032
- Table 142: Global 3D Mapping and 3D Modelling Industry Volume K Unit Forecast, by Type 2019 & 2032
- Table 143: Global 3D Mapping and 3D Modelling Industry Revenue Million Forecast, by Application 2019 & 2032
- Table 144: Global 3D Mapping and 3D Modelling Industry Volume K Unit Forecast, by Application 2019 & 2032
- Table 145: Global 3D Mapping and 3D Modelling Industry Revenue Million Forecast, by End-user Vertical 2019 & 2032
- Table 146: Global 3D Mapping and 3D Modelling Industry Volume K Unit Forecast, by End-user Vertical 2019 & 2032
- Table 147: Global 3D Mapping and 3D Modelling Industry Revenue Million Forecast, by Country 2019 & 2032
- Table 148: Global 3D Mapping and 3D Modelling Industry Volume K Unit Forecast, by Country 2019 & 2032
Frequently Asked Questions
1. What is the projected Compound Annual Growth Rate (CAGR) of the 3D Mapping and 3D Modelling Industry?
The projected CAGR is approximately 14.67%.
2. Which companies are prominent players in the 3D Mapping and 3D Modelling Industry?
Key companies in the market include Airbus Defense and Space, Cybercity 3D Inc, ESRI Inc , Golden Software LLC, Intermap Technologies, The Foundry Visionmongers Ltd, Autodesk Inc, Topcon Positioning Systems Inc, Trimble Inc, Bentley Systems Inc, Saab AB.
3. What are the main segments of the 3D Mapping and 3D Modelling Industry?
The market segments include Type, Application, End-user Vertical.
4. Can you provide details about the market size?
The market size is estimated to be USD 7.48 Million as of 2022.
5. What are some drivers contributing to market growth?
Advent of 3D-enabled Display Devices; Advancement of 3D Scanners. 3D Sensors. and Other Acquisition Devices.
6. What are the notable trends driving market growth?
Entertainment and Media Segment would Contribute Significantly to the Market Growth.
7. Are there any restraints impacting market growth?
High Initial Investments.
8. Can you provide examples of recent developments in the market?
N/A
9. What pricing options are available for accessing the report?
Pricing options include single-user, multi-user, and enterprise licenses priced at USD 4750, USD 5250, and USD 8750 respectively.
10. Is the market size provided in terms of value or volume?
The market size is provided in terms of value, measured in Million and volume, measured in K Unit.
11. Are there any specific market keywords associated with the report?
Yes, the market keyword associated with the report is "3D Mapping and 3D Modelling Industry," which aids in identifying and referencing the specific market segment covered.
12. How do I determine which pricing option suits my needs best?
The pricing options vary based on user requirements and access needs. Individual users may opt for single-user licenses, while businesses requiring broader access may choose multi-user or enterprise licenses for cost-effective access to the report.
13. Are there any additional resources or data provided in the 3D Mapping and 3D Modelling Industry report?
While the report offers comprehensive insights, it's advisable to review the specific contents or supplementary materials provided to ascertain if additional resources or data are available.
14. How can I stay updated on further developments or reports in the 3D Mapping and 3D Modelling Industry?
To stay informed about further developments, trends, and reports in the 3D Mapping and 3D Modelling Industry, consider subscribing to industry newsletters, following relevant companies and organizations, or regularly checking reputable industry news sources and publications.
Methodology
Step 1 - Identification of Relevant Samples Size from Population Database


Step 2 - Approaches for Defining Global Market Size (Value, Volume* & Price*)

Note*: In applicable scenarios
Step 3 - Data Sources
Primary Research
- Web Analytics
- Survey Reports
- Research Institute
- Latest Research Reports
- Opinion Leaders
Secondary Research
- Annual Reports
- White Paper
- Latest Press Release
- Industry Association
- Paid Database
- Investor Presentations

Step 4 - Data Triangulation
Involves using different sources of information in order to increase the validity of a study
These sources are likely to be stakeholders in a program - participants, other researchers, program staff, other community members, and so on.
Then we put all data in single framework & apply various statistical tools to find out the dynamic on the market.
During the analysis stage, feedback from the stakeholder groups would be compared to determine areas of agreement as well as areas of divergence


