
Key Insights
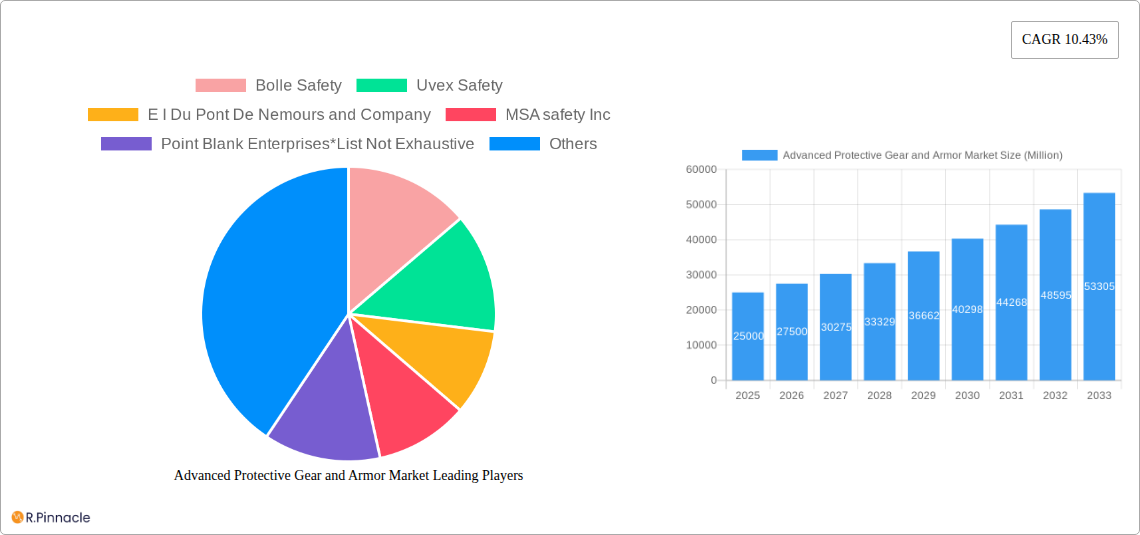
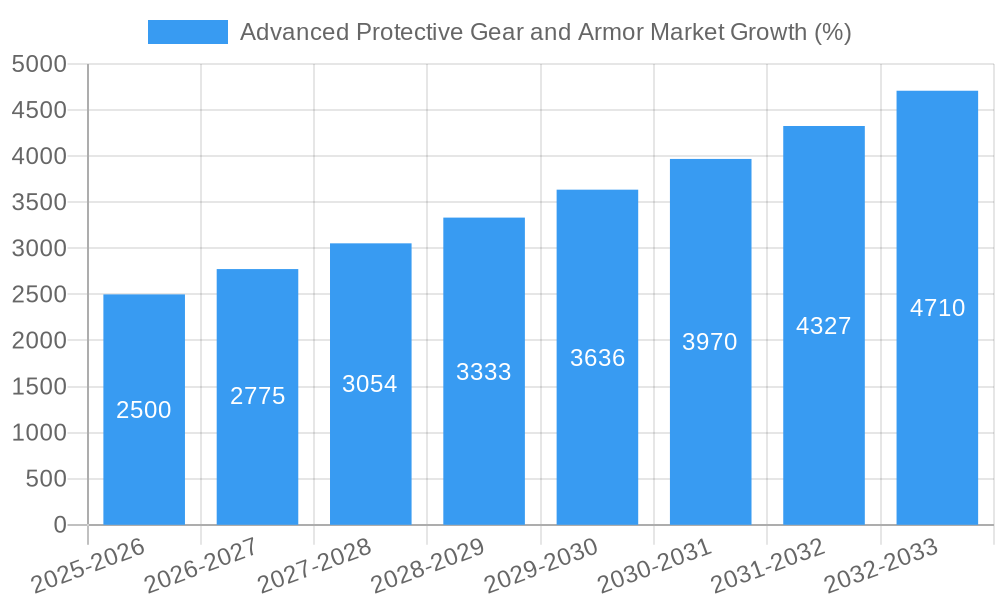
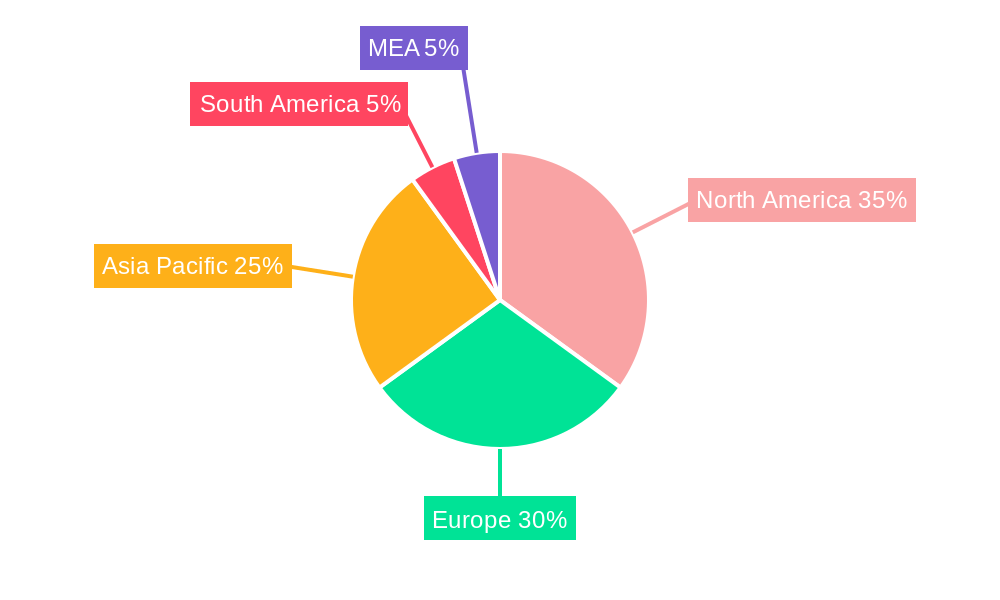
The Advanced Protective Gear and Armor market is experiencing robust growth, projected to reach a substantial size by 2033, driven by a compound annual growth rate (CAGR) of 10.43%. This expansion is fueled by several key factors. Increased industrialization and infrastructure development necessitate enhanced safety measures for workers across sectors like construction and oil & gas, boosting demand for protective gear. Simultaneously, rising concerns regarding personal safety and security are driving the personal protective equipment (PPE) segment. Furthermore, advancements in materials science are leading to lighter, more comfortable, and effective armor solutions, catering to both professional and civilian needs. The market is segmented by type (thermal, chemical/biological, ballistic, and others), use (industrial and personal), and end-user vertical (industrial, oil & gas, healthcare, law enforcement, construction, and others). North America and Europe currently hold significant market shares due to established industries and stringent safety regulations, but the Asia-Pacific region is anticipated to witness substantial growth owing to rapid industrialization and urbanization. Competition is fierce, with major players such as 3M, Honeywell, and DuPont alongside specialized manufacturers vying for market dominance through innovation and strategic partnerships.
The market's restraints primarily involve the high cost of advanced materials and technologies, potentially limiting adoption in certain segments. However, continuous technological advancements are addressing this challenge by offering cost-effective alternatives without compromising on performance. Regulatory changes and evolving safety standards in different regions also influence market dynamics. The long-term outlook remains positive, with the market expected to benefit from increasing government spending on defense and security, coupled with the growing awareness of workplace safety and personal protection. The market's success will hinge on manufacturers' ability to adapt to evolving technological advancements, customer preferences, and stringent regulatory environments. Further market penetration will depend on effective marketing and distribution strategies targeting specific end-user verticals.
Advanced Protective Gear and Armor Market Report: 2019-2033
This comprehensive report provides an in-depth analysis of the Advanced Protective Gear and Armor market, offering crucial insights for industry professionals, investors, and strategic decision-makers. Covering the period from 2019 to 2033, with a focus on 2025, this report unveils market dynamics, growth drivers, and future trends. The market is segmented by type (Thermal, Chemical/Biological, Ballistic, Other Types), use (Industrial, Personal), and end-user vertical (Industrial, Oil & Gas, Healthcare, Law Enforcement, Construction, Other End-user Verticals). Key players analyzed include Bolle Safety, Uvex Safety, E I Du Pont De Nemours and Company, MSA safety Inc, Point Blank Enterprises, BAE Systems PLC, 3M Co, Arco Ltd, Kimberly-Clark Corporation, Alpha Pro Tech Ltd, JSP Ltd, and Honeywell International Inc. The report projects a market value exceeding XX Million by 2033.
Advanced Protective Gear and Armor Market Market Structure & Innovation Trends
This section analyzes the market's competitive landscape, focusing on market concentration, innovation drivers, regulatory influences, and M&A activity. The report examines the market share held by key players and explores the impact of mergers and acquisitions, including estimated deal values. The increasing demand for advanced protective gear across various sectors fuels innovation, while regulatory frameworks influence product development and safety standards. The substitution of traditional materials with advanced composites and the evolving demographics of end-users further shape the market structure.
- Market Concentration: The market exhibits a moderately concentrated structure with several major players holding significant market share. Further analysis reveals the precise market share of leading companies. XX% of the market is controlled by the top 5 players in 2025.
- Innovation Drivers: Technological advancements in materials science, nanotechnology, and sensor integration are driving innovation. The need for lightweight yet highly protective gear is a significant driver.
- Regulatory Frameworks: Stringent safety regulations and standards across various industries (e.g., OSHA, NIOSH) impact product design and market entry.
- Product Substitutes: The emergence of advanced materials (e.g., graphene, carbon nanotubes) presents both opportunities and challenges for established players.
- End-User Demographics: The changing demographics of workers across different sectors, such as the aging workforce in construction and increasing female participation in law enforcement, are driving demand for customized and ergonomic protective gear.
- M&A Activities: The report documents completed M&A transactions during the study period (2019-2024) with an estimated total deal value exceeding XX Million.
Advanced Protective Gear and Armor Market Market Dynamics & Trends
This section delves into the key factors driving market growth, including technological advancements, evolving consumer preferences, and competitive dynamics. The report analyzes the Compound Annual Growth Rate (CAGR) and market penetration across different segments. Disruptive technologies, such as smart textiles and wearable sensors integrated into protective gear, are shaping the market landscape.
Dominant Regions & Segments in Advanced Protective Gear and Armor Market
This section identifies the leading regions, countries, and market segments based on type, use, and end-user vertical. Detailed analysis examines the key drivers behind regional and segmental dominance. North America is projected to remain a dominant region due to strong demand from diverse sectors, strict safety regulations, and high disposable income.
By Type: The Ballistic segment is expected to hold the largest market share due to increasing demand from law enforcement and military sectors. The Chemical/Biological segment is also expected to experience significant growth due to increasing concerns regarding chemical and biological threats.
By Use: The Industrial segment dominates due to extensive applications in various industries, including manufacturing and construction.
By End-user Vertical: The Oil & Gas and Construction sectors are projected to witness robust growth. The healthcare sector's demand for protective gear against infectious diseases is expected to significantly contribute to market growth.
Key Drivers:
- North America: Strong regulatory environment, high disposable income, significant investment in safety equipment.
- Europe: Growing awareness of occupational hazards, stringent safety regulations, increasing industrialization.
- Asia-Pacific: Rapid industrialization, rising construction activity, growing demand from developing economies.
Advanced Protective Gear and Armor Market Product Innovations
Recent product developments focus on integrating advanced materials, sensors, and connectivity features into protective gear. These innovations aim to enhance protection, comfort, and worker safety. Lightweight, flexible, and adaptable designs are gaining traction, alongside improvements in breathability and thermal management. Integration with smart technologies, such as GPS tracking and real-time health monitoring, adds a layer of functionality.
Report Scope & Segmentation Analysis
The report provides a comprehensive segmentation of the Advanced Protective Gear and Armor market based on type, use, and end-user vertical. Growth projections, market sizes, and competitive dynamics are analyzed for each segment. For example, the ballistic segment is expected to grow at a CAGR of XX% from 2025 to 2033, driven by increased government spending on defense and security.
Key Drivers of Advanced Protective Gear and Armor Market Growth
The market is driven by stringent safety regulations, increasing awareness of workplace hazards, advancements in materials science, and the growing demand for protective gear across various sectors. The expanding construction and oil & gas industries are significant contributors. Technological advancements leading to lighter, more comfortable, and more effective protective gear are further boosting market growth.
Challenges in the Advanced Protective Gear and Armor Market Sector
Challenges include maintaining a balance between protection and comfort, the high cost of advanced materials, supply chain disruptions, and intense competition among established and emerging players. Regulatory compliance requirements also pose challenges, especially for smaller companies.
Emerging Opportunities in Advanced Protective Gear and Armor Market
Emerging opportunities lie in the development of specialized protective gear for niche applications, the integration of smart technologies, and expansion into developing markets. The increasing adoption of sustainable and eco-friendly materials presents a significant opportunity for growth.
Leading Players in the Advanced Protective Gear and Armor Market Market
- Bolle Safety
- Uvex Safety
- E I Du Pont De Nemours and Company
- MSA safety Inc
- Point Blank Enterprises
- BAE Systems PLC
- 3M Co
- Arco Ltd
- Kimberly-Clark Corporation
- Alpha Pro Tech Ltd
- JSP Ltd
- Honeywell International Inc
Key Developments in Advanced Protective Gear and Armor Market Industry
- 2022 Q4: 3M launched a new line of advanced ballistic helmets incorporating graphene technology.
- 2023 Q1: Honeywell acquired a smaller protective gear manufacturer, expanding its market share.
- 2024 Q2: New regulations on chemical protective suits were implemented in the EU.
Future Outlook for Advanced Protective Gear and Armor Market Market
The Advanced Protective Gear and Armor market is poised for robust growth, driven by ongoing technological advancements, increasing demand from diverse sectors, and stringent safety regulations. Strategic partnerships, investments in R&D, and expansion into new markets will be crucial for success in this dynamic sector. The market is expected to reach XX Million by 2033.
Advanced Protective Gear and Armor Market Segmentation
-
1. Type
- 1.1. Thermal
- 1.2. Chemical/Biological
- 1.3. Ballistic
- 1.4. Other Types
-
2. Use
- 2.1. Industrial
- 2.2. Personal
-
3. End-user Vertical
- 3.1. Industrial
- 3.2. Oil & Gas
- 3.3. Healthcare
- 3.4. Law Enforcement
- 3.5. Construction
- 3.6. Other End-user Verticals
Advanced Protective Gear and Armor Market Segmentation By Geography
- 1. North America
- 2. Europe
- 3. Asia Pacific
- 4. Latin America
- 5. Middle East
Advanced Protective Gear and Armor Market REPORT HIGHLIGHTS
| Aspects | Details |
|---|---|
| Study Period | 2019-2033 |
| Base Year | 2024 |
| Estimated Year | 2025 |
| Forecast Period | 2025-2033 |
| Historical Period | 2019-2024 |
| Growth Rate | CAGR of 10.43% from 2019-2033 |
| Segmentation |
|
Table of Contents
- 1. Introduction
- 1.1. Research Scope
- 1.2. Market Segmentation
- 1.3. Research Methodology
- 1.4. Definitions and Assumptions
- 2. Executive Summary
- 2.1. Introduction
- 3. Market Dynamics
- 3.1. Introduction
- 3.2. Market Drivers
- 3.2.1. ; Rising Demand for Products Offering Comfort and Style; Increasing Safety Awareness Across the Industries; End-User Preferences for Ergonomic Equipment in Firefighter Personal Protective Equipment
- 3.3. Market Restrains
- 3.3.1. ; Increasing Threat from the Low-cost and Private Label Products; Low Safety Compliance in Construction Industry; Dearth of Innovation Restraints Product Differentiation
- 3.4. Market Trends
- 3.4.1. Increasing Safety Awareness Across the Industries to Drive the Market Growth
- 4. Market Factor Analysis
- 4.1. Porters Five Forces
- 4.2. Supply/Value Chain
- 4.3. PESTEL analysis
- 4.4. Market Entropy
- 4.5. Patent/Trademark Analysis
- 5. Global Advanced Protective Gear and Armor Market Analysis, Insights and Forecast, 2019-2031
- 5.1. Market Analysis, Insights and Forecast - by Type
- 5.1.1. Thermal
- 5.1.2. Chemical/Biological
- 5.1.3. Ballistic
- 5.1.4. Other Types
- 5.2. Market Analysis, Insights and Forecast - by Use
- 5.2.1. Industrial
- 5.2.2. Personal
- 5.3. Market Analysis, Insights and Forecast - by End-user Vertical
- 5.3.1. Industrial
- 5.3.2. Oil & Gas
- 5.3.3. Healthcare
- 5.3.4. Law Enforcement
- 5.3.5. Construction
- 5.3.6. Other End-user Verticals
- 5.4. Market Analysis, Insights and Forecast - by Region
- 5.4.1. North America
- 5.4.2. Europe
- 5.4.3. Asia Pacific
- 5.4.4. Latin America
- 5.4.5. Middle East
- 5.1. Market Analysis, Insights and Forecast - by Type
- 6. North America Advanced Protective Gear and Armor Market Analysis, Insights and Forecast, 2019-2031
- 6.1. Market Analysis, Insights and Forecast - by Type
- 6.1.1. Thermal
- 6.1.2. Chemical/Biological
- 6.1.3. Ballistic
- 6.1.4. Other Types
- 6.2. Market Analysis, Insights and Forecast - by Use
- 6.2.1. Industrial
- 6.2.2. Personal
- 6.3. Market Analysis, Insights and Forecast - by End-user Vertical
- 6.3.1. Industrial
- 6.3.2. Oil & Gas
- 6.3.3. Healthcare
- 6.3.4. Law Enforcement
- 6.3.5. Construction
- 6.3.6. Other End-user Verticals
- 6.1. Market Analysis, Insights and Forecast - by Type
- 7. Europe Advanced Protective Gear and Armor Market Analysis, Insights and Forecast, 2019-2031
- 7.1. Market Analysis, Insights and Forecast - by Type
- 7.1.1. Thermal
- 7.1.2. Chemical/Biological
- 7.1.3. Ballistic
- 7.1.4. Other Types
- 7.2. Market Analysis, Insights and Forecast - by Use
- 7.2.1. Industrial
- 7.2.2. Personal
- 7.3. Market Analysis, Insights and Forecast - by End-user Vertical
- 7.3.1. Industrial
- 7.3.2. Oil & Gas
- 7.3.3. Healthcare
- 7.3.4. Law Enforcement
- 7.3.5. Construction
- 7.3.6. Other End-user Verticals
- 7.1. Market Analysis, Insights and Forecast - by Type
- 8. Asia Pacific Advanced Protective Gear and Armor Market Analysis, Insights and Forecast, 2019-2031
- 8.1. Market Analysis, Insights and Forecast - by Type
- 8.1.1. Thermal
- 8.1.2. Chemical/Biological
- 8.1.3. Ballistic
- 8.1.4. Other Types
- 8.2. Market Analysis, Insights and Forecast - by Use
- 8.2.1. Industrial
- 8.2.2. Personal
- 8.3. Market Analysis, Insights and Forecast - by End-user Vertical
- 8.3.1. Industrial
- 8.3.2. Oil & Gas
- 8.3.3. Healthcare
- 8.3.4. Law Enforcement
- 8.3.5. Construction
- 8.3.6. Other End-user Verticals
- 8.1. Market Analysis, Insights and Forecast - by Type
- 9. Latin America Advanced Protective Gear and Armor Market Analysis, Insights and Forecast, 2019-2031
- 9.1. Market Analysis, Insights and Forecast - by Type
- 9.1.1. Thermal
- 9.1.2. Chemical/Biological
- 9.1.3. Ballistic
- 9.1.4. Other Types
- 9.2. Market Analysis, Insights and Forecast - by Use
- 9.2.1. Industrial
- 9.2.2. Personal
- 9.3. Market Analysis, Insights and Forecast - by End-user Vertical
- 9.3.1. Industrial
- 9.3.2. Oil & Gas
- 9.3.3. Healthcare
- 9.3.4. Law Enforcement
- 9.3.5. Construction
- 9.3.6. Other End-user Verticals
- 9.1. Market Analysis, Insights and Forecast - by Type
- 10. Middle East Advanced Protective Gear and Armor Market Analysis, Insights and Forecast, 2019-2031
- 10.1. Market Analysis, Insights and Forecast - by Type
- 10.1.1. Thermal
- 10.1.2. Chemical/Biological
- 10.1.3. Ballistic
- 10.1.4. Other Types
- 10.2. Market Analysis, Insights and Forecast - by Use
- 10.2.1. Industrial
- 10.2.2. Personal
- 10.3. Market Analysis, Insights and Forecast - by End-user Vertical
- 10.3.1. Industrial
- 10.3.2. Oil & Gas
- 10.3.3. Healthcare
- 10.3.4. Law Enforcement
- 10.3.5. Construction
- 10.3.6. Other End-user Verticals
- 10.1. Market Analysis, Insights and Forecast - by Type
- 11. North America Advanced Protective Gear and Armor Market Analysis, Insights and Forecast, 2019-2031
- 11.1. Market Analysis, Insights and Forecast - By Country/Sub-region
- 11.1.1 United States
- 11.1.2 Canada
- 11.1.3 Mexico
- 12. Europe Advanced Protective Gear and Armor Market Analysis, Insights and Forecast, 2019-2031
- 12.1. Market Analysis, Insights and Forecast - By Country/Sub-region
- 12.1.1 Germany
- 12.1.2 United Kingdom
- 12.1.3 France
- 12.1.4 Spain
- 12.1.5 Italy
- 12.1.6 Spain
- 12.1.7 Belgium
- 12.1.8 Netherland
- 12.1.9 Nordics
- 12.1.10 Rest of Europe
- 13. Asia Pacific Advanced Protective Gear and Armor Market Analysis, Insights and Forecast, 2019-2031
- 13.1. Market Analysis, Insights and Forecast - By Country/Sub-region
- 13.1.1 China
- 13.1.2 Japan
- 13.1.3 India
- 13.1.4 South Korea
- 13.1.5 Southeast Asia
- 13.1.6 Australia
- 13.1.7 Indonesia
- 13.1.8 Phillipes
- 13.1.9 Singapore
- 13.1.10 Thailandc
- 13.1.11 Rest of Asia Pacific
- 14. South America Advanced Protective Gear and Armor Market Analysis, Insights and Forecast, 2019-2031
- 14.1. Market Analysis, Insights and Forecast - By Country/Sub-region
- 14.1.1 Brazil
- 14.1.2 Argentina
- 14.1.3 Peru
- 14.1.4 Chile
- 14.1.5 Colombia
- 14.1.6 Ecuador
- 14.1.7 Venezuela
- 14.1.8 Rest of South America
- 15. North America Advanced Protective Gear and Armor Market Analysis, Insights and Forecast, 2019-2031
- 15.1. Market Analysis, Insights and Forecast - By Country/Sub-region
- 15.1.1 United States
- 15.1.2 Canada
- 15.1.3 Mexico
- 16. MEA Advanced Protective Gear and Armor Market Analysis, Insights and Forecast, 2019-2031
- 16.1. Market Analysis, Insights and Forecast - By Country/Sub-region
- 16.1.1 United Arab Emirates
- 16.1.2 Saudi Arabia
- 16.1.3 South Africa
- 16.1.4 Rest of Middle East and Africa
- 17. Competitive Analysis
- 17.1. Global Market Share Analysis 2024
- 17.2. Company Profiles
- 17.2.1 Bolle Safety
- 17.2.1.1. Overview
- 17.2.1.2. Products
- 17.2.1.3. SWOT Analysis
- 17.2.1.4. Recent Developments
- 17.2.1.5. Financials (Based on Availability)
- 17.2.2 Uvex Safety
- 17.2.2.1. Overview
- 17.2.2.2. Products
- 17.2.2.3. SWOT Analysis
- 17.2.2.4. Recent Developments
- 17.2.2.5. Financials (Based on Availability)
- 17.2.3 E I Du Pont De Nemours and Company
- 17.2.3.1. Overview
- 17.2.3.2. Products
- 17.2.3.3. SWOT Analysis
- 17.2.3.4. Recent Developments
- 17.2.3.5. Financials (Based on Availability)
- 17.2.4 MSA safety Inc
- 17.2.4.1. Overview
- 17.2.4.2. Products
- 17.2.4.3. SWOT Analysis
- 17.2.4.4. Recent Developments
- 17.2.4.5. Financials (Based on Availability)
- 17.2.5 Point Blank Enterprises*List Not Exhaustive
- 17.2.5.1. Overview
- 17.2.5.2. Products
- 17.2.5.3. SWOT Analysis
- 17.2.5.4. Recent Developments
- 17.2.5.5. Financials (Based on Availability)
- 17.2.6 BAE Systems PLC
- 17.2.6.1. Overview
- 17.2.6.2. Products
- 17.2.6.3. SWOT Analysis
- 17.2.6.4. Recent Developments
- 17.2.6.5. Financials (Based on Availability)
- 17.2.7 3M Co
- 17.2.7.1. Overview
- 17.2.7.2. Products
- 17.2.7.3. SWOT Analysis
- 17.2.7.4. Recent Developments
- 17.2.7.5. Financials (Based on Availability)
- 17.2.8 Arco Ltd
- 17.2.8.1. Overview
- 17.2.8.2. Products
- 17.2.8.3. SWOT Analysis
- 17.2.8.4. Recent Developments
- 17.2.8.5. Financials (Based on Availability)
- 17.2.9 Kimberly - Clark Corporation
- 17.2.9.1. Overview
- 17.2.9.2. Products
- 17.2.9.3. SWOT Analysis
- 17.2.9.4. Recent Developments
- 17.2.9.5. Financials (Based on Availability)
- 17.2.10 Alpha Pro Tech Ltd
- 17.2.10.1. Overview
- 17.2.10.2. Products
- 17.2.10.3. SWOT Analysis
- 17.2.10.4. Recent Developments
- 17.2.10.5. Financials (Based on Availability)
- 17.2.11 JSP Ltd
- 17.2.11.1. Overview
- 17.2.11.2. Products
- 17.2.11.3. SWOT Analysis
- 17.2.11.4. Recent Developments
- 17.2.11.5. Financials (Based on Availability)
- 17.2.12 Honeywell Internation Inc
- 17.2.12.1. Overview
- 17.2.12.2. Products
- 17.2.12.3. SWOT Analysis
- 17.2.12.4. Recent Developments
- 17.2.12.5. Financials (Based on Availability)
- 17.2.1 Bolle Safety
List of Figures
- Figure 1: Global Advanced Protective Gear and Armor Market Revenue Breakdown (Million, %) by Region 2024 & 2032
- Figure 2: North America Advanced Protective Gear and Armor Market Revenue (Million), by Country 2024 & 2032
- Figure 3: North America Advanced Protective Gear and Armor Market Revenue Share (%), by Country 2024 & 2032
- Figure 4: Europe Advanced Protective Gear and Armor Market Revenue (Million), by Country 2024 & 2032
- Figure 5: Europe Advanced Protective Gear and Armor Market Revenue Share (%), by Country 2024 & 2032
- Figure 6: Asia Pacific Advanced Protective Gear and Armor Market Revenue (Million), by Country 2024 & 2032
- Figure 7: Asia Pacific Advanced Protective Gear and Armor Market Revenue Share (%), by Country 2024 & 2032
- Figure 8: South America Advanced Protective Gear and Armor Market Revenue (Million), by Country 2024 & 2032
- Figure 9: South America Advanced Protective Gear and Armor Market Revenue Share (%), by Country 2024 & 2032
- Figure 10: North America Advanced Protective Gear and Armor Market Revenue (Million), by Country 2024 & 2032
- Figure 11: North America Advanced Protective Gear and Armor Market Revenue Share (%), by Country 2024 & 2032
- Figure 12: MEA Advanced Protective Gear and Armor Market Revenue (Million), by Country 2024 & 2032
- Figure 13: MEA Advanced Protective Gear and Armor Market Revenue Share (%), by Country 2024 & 2032
- Figure 14: North America Advanced Protective Gear and Armor Market Revenue (Million), by Type 2024 & 2032
- Figure 15: North America Advanced Protective Gear and Armor Market Revenue Share (%), by Type 2024 & 2032
- Figure 16: North America Advanced Protective Gear and Armor Market Revenue (Million), by Use 2024 & 2032
- Figure 17: North America Advanced Protective Gear and Armor Market Revenue Share (%), by Use 2024 & 2032
- Figure 18: North America Advanced Protective Gear and Armor Market Revenue (Million), by End-user Vertical 2024 & 2032
- Figure 19: North America Advanced Protective Gear and Armor Market Revenue Share (%), by End-user Vertical 2024 & 2032
- Figure 20: North America Advanced Protective Gear and Armor Market Revenue (Million), by Country 2024 & 2032
- Figure 21: North America Advanced Protective Gear and Armor Market Revenue Share (%), by Country 2024 & 2032
- Figure 22: Europe Advanced Protective Gear and Armor Market Revenue (Million), by Type 2024 & 2032
- Figure 23: Europe Advanced Protective Gear and Armor Market Revenue Share (%), by Type 2024 & 2032
- Figure 24: Europe Advanced Protective Gear and Armor Market Revenue (Million), by Use 2024 & 2032
- Figure 25: Europe Advanced Protective Gear and Armor Market Revenue Share (%), by Use 2024 & 2032
- Figure 26: Europe Advanced Protective Gear and Armor Market Revenue (Million), by End-user Vertical 2024 & 2032
- Figure 27: Europe Advanced Protective Gear and Armor Market Revenue Share (%), by End-user Vertical 2024 & 2032
- Figure 28: Europe Advanced Protective Gear and Armor Market Revenue (Million), by Country 2024 & 2032
- Figure 29: Europe Advanced Protective Gear and Armor Market Revenue Share (%), by Country 2024 & 2032
- Figure 30: Asia Pacific Advanced Protective Gear and Armor Market Revenue (Million), by Type 2024 & 2032
- Figure 31: Asia Pacific Advanced Protective Gear and Armor Market Revenue Share (%), by Type 2024 & 2032
- Figure 32: Asia Pacific Advanced Protective Gear and Armor Market Revenue (Million), by Use 2024 & 2032
- Figure 33: Asia Pacific Advanced Protective Gear and Armor Market Revenue Share (%), by Use 2024 & 2032
- Figure 34: Asia Pacific Advanced Protective Gear and Armor Market Revenue (Million), by End-user Vertical 2024 & 2032
- Figure 35: Asia Pacific Advanced Protective Gear and Armor Market Revenue Share (%), by End-user Vertical 2024 & 2032
- Figure 36: Asia Pacific Advanced Protective Gear and Armor Market Revenue (Million), by Country 2024 & 2032
- Figure 37: Asia Pacific Advanced Protective Gear and Armor Market Revenue Share (%), by Country 2024 & 2032
- Figure 38: Latin America Advanced Protective Gear and Armor Market Revenue (Million), by Type 2024 & 2032
- Figure 39: Latin America Advanced Protective Gear and Armor Market Revenue Share (%), by Type 2024 & 2032
- Figure 40: Latin America Advanced Protective Gear and Armor Market Revenue (Million), by Use 2024 & 2032
- Figure 41: Latin America Advanced Protective Gear and Armor Market Revenue Share (%), by Use 2024 & 2032
- Figure 42: Latin America Advanced Protective Gear and Armor Market Revenue (Million), by End-user Vertical 2024 & 2032
- Figure 43: Latin America Advanced Protective Gear and Armor Market Revenue Share (%), by End-user Vertical 2024 & 2032
- Figure 44: Latin America Advanced Protective Gear and Armor Market Revenue (Million), by Country 2024 & 2032
- Figure 45: Latin America Advanced Protective Gear and Armor Market Revenue Share (%), by Country 2024 & 2032
- Figure 46: Middle East Advanced Protective Gear and Armor Market Revenue (Million), by Type 2024 & 2032
- Figure 47: Middle East Advanced Protective Gear and Armor Market Revenue Share (%), by Type 2024 & 2032
- Figure 48: Middle East Advanced Protective Gear and Armor Market Revenue (Million), by Use 2024 & 2032
- Figure 49: Middle East Advanced Protective Gear and Armor Market Revenue Share (%), by Use 2024 & 2032
- Figure 50: Middle East Advanced Protective Gear and Armor Market Revenue (Million), by End-user Vertical 2024 & 2032
- Figure 51: Middle East Advanced Protective Gear and Armor Market Revenue Share (%), by End-user Vertical 2024 & 2032
- Figure 52: Middle East Advanced Protective Gear and Armor Market Revenue (Million), by Country 2024 & 2032
- Figure 53: Middle East Advanced Protective Gear and Armor Market Revenue Share (%), by Country 2024 & 2032
List of Tables
- Table 1: Global Advanced Protective Gear and Armor Market Revenue Million Forecast, by Region 2019 & 2032
- Table 2: Global Advanced Protective Gear and Armor Market Revenue Million Forecast, by Type 2019 & 2032
- Table 3: Global Advanced Protective Gear and Armor Market Revenue Million Forecast, by Use 2019 & 2032
- Table 4: Global Advanced Protective Gear and Armor Market Revenue Million Forecast, by End-user Vertical 2019 & 2032
- Table 5: Global Advanced Protective Gear and Armor Market Revenue Million Forecast, by Region 2019 & 2032
- Table 6: Global Advanced Protective Gear and Armor Market Revenue Million Forecast, by Country 2019 & 2032
- Table 7: United States Advanced Protective Gear and Armor Market Revenue (Million) Forecast, by Application 2019 & 2032
- Table 8: Canada Advanced Protective Gear and Armor Market Revenue (Million) Forecast, by Application 2019 & 2032
- Table 9: Mexico Advanced Protective Gear and Armor Market Revenue (Million) Forecast, by Application 2019 & 2032
- Table 10: Global Advanced Protective Gear and Armor Market Revenue Million Forecast, by Country 2019 & 2032
- Table 11: Germany Advanced Protective Gear and Armor Market Revenue (Million) Forecast, by Application 2019 & 2032
- Table 12: United Kingdom Advanced Protective Gear and Armor Market Revenue (Million) Forecast, by Application 2019 & 2032
- Table 13: France Advanced Protective Gear and Armor Market Revenue (Million) Forecast, by Application 2019 & 2032
- Table 14: Spain Advanced Protective Gear and Armor Market Revenue (Million) Forecast, by Application 2019 & 2032
- Table 15: Italy Advanced Protective Gear and Armor Market Revenue (Million) Forecast, by Application 2019 & 2032
- Table 16: Spain Advanced Protective Gear and Armor Market Revenue (Million) Forecast, by Application 2019 & 2032
- Table 17: Belgium Advanced Protective Gear and Armor Market Revenue (Million) Forecast, by Application 2019 & 2032
- Table 18: Netherland Advanced Protective Gear and Armor Market Revenue (Million) Forecast, by Application 2019 & 2032
- Table 19: Nordics Advanced Protective Gear and Armor Market Revenue (Million) Forecast, by Application 2019 & 2032
- Table 20: Rest of Europe Advanced Protective Gear and Armor Market Revenue (Million) Forecast, by Application 2019 & 2032
- Table 21: Global Advanced Protective Gear and Armor Market Revenue Million Forecast, by Country 2019 & 2032
- Table 22: China Advanced Protective Gear and Armor Market Revenue (Million) Forecast, by Application 2019 & 2032
- Table 23: Japan Advanced Protective Gear and Armor Market Revenue (Million) Forecast, by Application 2019 & 2032
- Table 24: India Advanced Protective Gear and Armor Market Revenue (Million) Forecast, by Application 2019 & 2032
- Table 25: South Korea Advanced Protective Gear and Armor Market Revenue (Million) Forecast, by Application 2019 & 2032
- Table 26: Southeast Asia Advanced Protective Gear and Armor Market Revenue (Million) Forecast, by Application 2019 & 2032
- Table 27: Australia Advanced Protective Gear and Armor Market Revenue (Million) Forecast, by Application 2019 & 2032
- Table 28: Indonesia Advanced Protective Gear and Armor Market Revenue (Million) Forecast, by Application 2019 & 2032
- Table 29: Phillipes Advanced Protective Gear and Armor Market Revenue (Million) Forecast, by Application 2019 & 2032
- Table 30: Singapore Advanced Protective Gear and Armor Market Revenue (Million) Forecast, by Application 2019 & 2032
- Table 31: Thailandc Advanced Protective Gear and Armor Market Revenue (Million) Forecast, by Application 2019 & 2032
- Table 32: Rest of Asia Pacific Advanced Protective Gear and Armor Market Revenue (Million) Forecast, by Application 2019 & 2032
- Table 33: Global Advanced Protective Gear and Armor Market Revenue Million Forecast, by Country 2019 & 2032
- Table 34: Brazil Advanced Protective Gear and Armor Market Revenue (Million) Forecast, by Application 2019 & 2032
- Table 35: Argentina Advanced Protective Gear and Armor Market Revenue (Million) Forecast, by Application 2019 & 2032
- Table 36: Peru Advanced Protective Gear and Armor Market Revenue (Million) Forecast, by Application 2019 & 2032
- Table 37: Chile Advanced Protective Gear and Armor Market Revenue (Million) Forecast, by Application 2019 & 2032
- Table 38: Colombia Advanced Protective Gear and Armor Market Revenue (Million) Forecast, by Application 2019 & 2032
- Table 39: Ecuador Advanced Protective Gear and Armor Market Revenue (Million) Forecast, by Application 2019 & 2032
- Table 40: Venezuela Advanced Protective Gear and Armor Market Revenue (Million) Forecast, by Application 2019 & 2032
- Table 41: Rest of South America Advanced Protective Gear and Armor Market Revenue (Million) Forecast, by Application 2019 & 2032
- Table 42: Global Advanced Protective Gear and Armor Market Revenue Million Forecast, by Country 2019 & 2032
- Table 43: United States Advanced Protective Gear and Armor Market Revenue (Million) Forecast, by Application 2019 & 2032
- Table 44: Canada Advanced Protective Gear and Armor Market Revenue (Million) Forecast, by Application 2019 & 2032
- Table 45: Mexico Advanced Protective Gear and Armor Market Revenue (Million) Forecast, by Application 2019 & 2032
- Table 46: Global Advanced Protective Gear and Armor Market Revenue Million Forecast, by Country 2019 & 2032
- Table 47: United Arab Emirates Advanced Protective Gear and Armor Market Revenue (Million) Forecast, by Application 2019 & 2032
- Table 48: Saudi Arabia Advanced Protective Gear and Armor Market Revenue (Million) Forecast, by Application 2019 & 2032
- Table 49: South Africa Advanced Protective Gear and Armor Market Revenue (Million) Forecast, by Application 2019 & 2032
- Table 50: Rest of Middle East and Africa Advanced Protective Gear and Armor Market Revenue (Million) Forecast, by Application 2019 & 2032
- Table 51: Global Advanced Protective Gear and Armor Market Revenue Million Forecast, by Type 2019 & 2032
- Table 52: Global Advanced Protective Gear and Armor Market Revenue Million Forecast, by Use 2019 & 2032
- Table 53: Global Advanced Protective Gear and Armor Market Revenue Million Forecast, by End-user Vertical 2019 & 2032
- Table 54: Global Advanced Protective Gear and Armor Market Revenue Million Forecast, by Country 2019 & 2032
- Table 55: Global Advanced Protective Gear and Armor Market Revenue Million Forecast, by Type 2019 & 2032
- Table 56: Global Advanced Protective Gear and Armor Market Revenue Million Forecast, by Use 2019 & 2032
- Table 57: Global Advanced Protective Gear and Armor Market Revenue Million Forecast, by End-user Vertical 2019 & 2032
- Table 58: Global Advanced Protective Gear and Armor Market Revenue Million Forecast, by Country 2019 & 2032
- Table 59: Global Advanced Protective Gear and Armor Market Revenue Million Forecast, by Type 2019 & 2032
- Table 60: Global Advanced Protective Gear and Armor Market Revenue Million Forecast, by Use 2019 & 2032
- Table 61: Global Advanced Protective Gear and Armor Market Revenue Million Forecast, by End-user Vertical 2019 & 2032
- Table 62: Global Advanced Protective Gear and Armor Market Revenue Million Forecast, by Country 2019 & 2032
- Table 63: Global Advanced Protective Gear and Armor Market Revenue Million Forecast, by Type 2019 & 2032
- Table 64: Global Advanced Protective Gear and Armor Market Revenue Million Forecast, by Use 2019 & 2032
- Table 65: Global Advanced Protective Gear and Armor Market Revenue Million Forecast, by End-user Vertical 2019 & 2032
- Table 66: Global Advanced Protective Gear and Armor Market Revenue Million Forecast, by Country 2019 & 2032
- Table 67: Global Advanced Protective Gear and Armor Market Revenue Million Forecast, by Type 2019 & 2032
- Table 68: Global Advanced Protective Gear and Armor Market Revenue Million Forecast, by Use 2019 & 2032
- Table 69: Global Advanced Protective Gear and Armor Market Revenue Million Forecast, by End-user Vertical 2019 & 2032
- Table 70: Global Advanced Protective Gear and Armor Market Revenue Million Forecast, by Country 2019 & 2032
Frequently Asked Questions
1. What is the projected Compound Annual Growth Rate (CAGR) of the Advanced Protective Gear and Armor Market?
The projected CAGR is approximately 10.43%.
2. Which companies are prominent players in the Advanced Protective Gear and Armor Market?
Key companies in the market include Bolle Safety, Uvex Safety, E I Du Pont De Nemours and Company, MSA safety Inc, Point Blank Enterprises*List Not Exhaustive, BAE Systems PLC, 3M Co, Arco Ltd, Kimberly - Clark Corporation, Alpha Pro Tech Ltd, JSP Ltd, Honeywell Internation Inc.
3. What are the main segments of the Advanced Protective Gear and Armor Market?
The market segments include Type, Use, End-user Vertical.
4. Can you provide details about the market size?
The market size is estimated to be USD XX Million as of 2022.
5. What are some drivers contributing to market growth?
; Rising Demand for Products Offering Comfort and Style; Increasing Safety Awareness Across the Industries; End-User Preferences for Ergonomic Equipment in Firefighter Personal Protective Equipment.
6. What are the notable trends driving market growth?
Increasing Safety Awareness Across the Industries to Drive the Market Growth.
7. Are there any restraints impacting market growth?
; Increasing Threat from the Low-cost and Private Label Products; Low Safety Compliance in Construction Industry; Dearth of Innovation Restraints Product Differentiation.
8. Can you provide examples of recent developments in the market?
N/A
9. What pricing options are available for accessing the report?
Pricing options include single-user, multi-user, and enterprise licenses priced at USD 4750, USD 5250, and USD 8750 respectively.
10. Is the market size provided in terms of value or volume?
The market size is provided in terms of value, measured in Million.
11. Are there any specific market keywords associated with the report?
Yes, the market keyword associated with the report is "Advanced Protective Gear and Armor Market," which aids in identifying and referencing the specific market segment covered.
12. How do I determine which pricing option suits my needs best?
The pricing options vary based on user requirements and access needs. Individual users may opt for single-user licenses, while businesses requiring broader access may choose multi-user or enterprise licenses for cost-effective access to the report.
13. Are there any additional resources or data provided in the Advanced Protective Gear and Armor Market report?
While the report offers comprehensive insights, it's advisable to review the specific contents or supplementary materials provided to ascertain if additional resources or data are available.
14. How can I stay updated on further developments or reports in the Advanced Protective Gear and Armor Market?
To stay informed about further developments, trends, and reports in the Advanced Protective Gear and Armor Market, consider subscribing to industry newsletters, following relevant companies and organizations, or regularly checking reputable industry news sources and publications.
Methodology
Step 1 - Identification of Relevant Samples Size from Population Database


Step 2 - Approaches for Defining Global Market Size (Value, Volume* & Price*)

Note*: In applicable scenarios
Step 3 - Data Sources
Primary Research
- Web Analytics
- Survey Reports
- Research Institute
- Latest Research Reports
- Opinion Leaders
Secondary Research
- Annual Reports
- White Paper
- Latest Press Release
- Industry Association
- Paid Database
- Investor Presentations

Step 4 - Data Triangulation
Involves using different sources of information in order to increase the validity of a study
These sources are likely to be stakeholders in a program - participants, other researchers, program staff, other community members, and so on.
Then we put all data in single framework & apply various statistical tools to find out the dynamic on the market.
During the analysis stage, feedback from the stakeholder groups would be compared to determine areas of agreement as well as areas of divergence


