
Key Insights
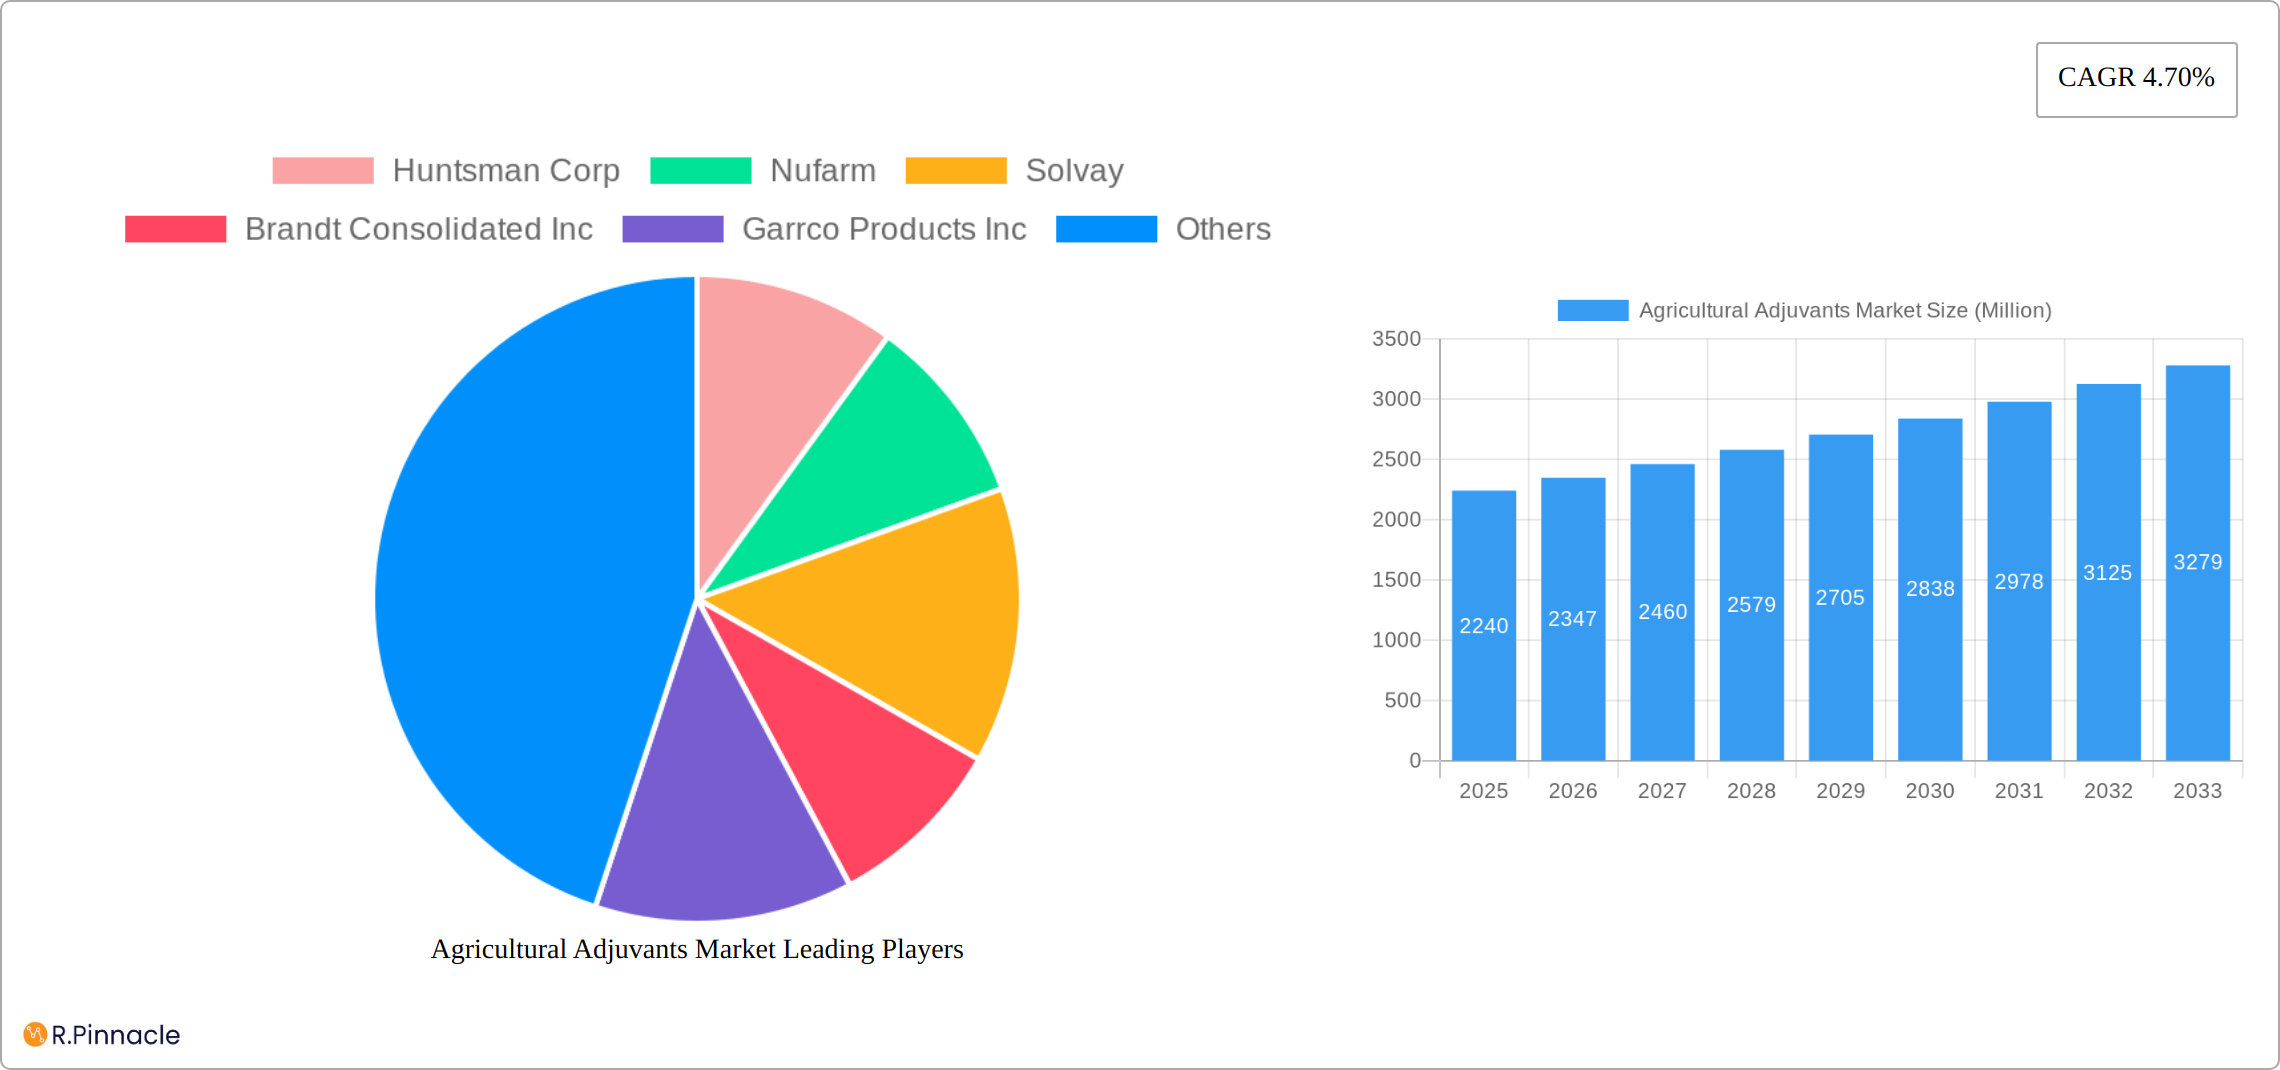
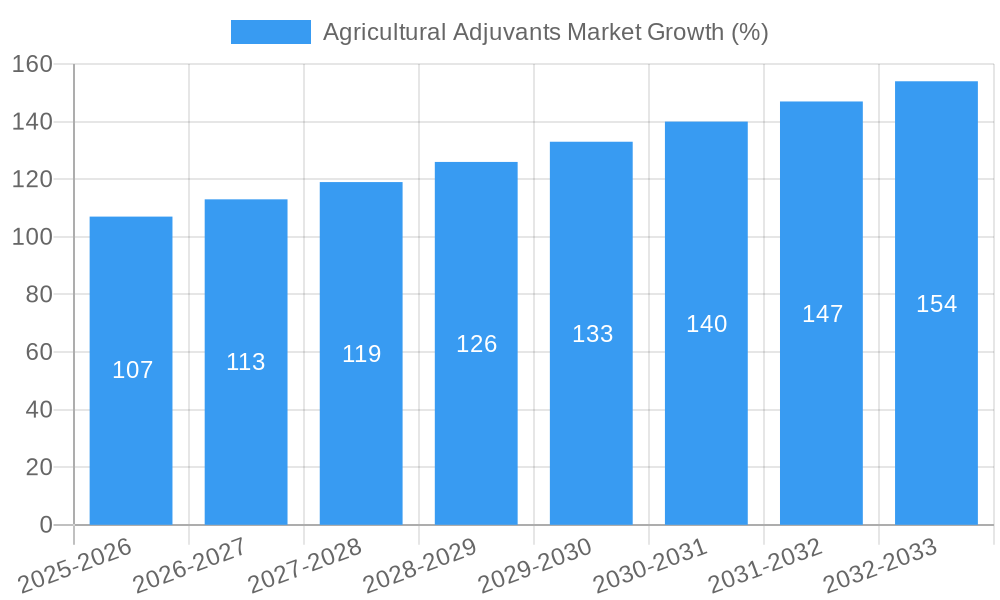
The global agricultural adjuvants market, valued at $2.24 billion in 2025, is projected to experience robust growth, driven by the increasing adoption of precision agriculture and the rising demand for higher crop yields. The market's Compound Annual Growth Rate (CAGR) of 4.70% from 2025 to 2033 indicates a significant expansion, fueled by several key factors. Firstly, the growing awareness among farmers regarding the benefits of adjuvants in enhancing pesticide efficacy and reducing chemical usage is boosting demand. Secondly, favorable government regulations and initiatives promoting sustainable agricultural practices are creating a conducive environment for market growth. Furthermore, technological advancements in adjuvant formulations, leading to improved performance and reduced environmental impact, are contributing to market expansion. The segmentation reveals strong growth potential across various adjuvant types, with activator adjuvants and oil adjuvants leading the pack, and application across herbicides, insecticides, and fungicides showcasing significant market share. Competition among major players, including Huntsman Corp, Nufarm, and Solvay, is driving innovation and product development, further propelling market growth. Geographic expansion, particularly in the rapidly developing economies of Asia Pacific and South America, promises substantial future growth opportunities for agricultural adjuvant manufacturers.
The market's growth is not without challenges. Constraints include fluctuating raw material prices, stringent environmental regulations in certain regions, and the potential for substitution by bio-based adjuvants. However, the overall outlook remains positive, supported by the long-term need for enhanced crop protection and increased agricultural productivity. The market is likely to witness further consolidation through mergers and acquisitions, as companies strive to expand their product portfolios and geographic reach. Continued research and development efforts focusing on environmentally friendly and high-performance adjuvants will be crucial in shaping the market's future trajectory. Regional variations in growth are expected, with North America and Europe maintaining a significant share, while Asia-Pacific is poised for rapid expansion driven by rising agricultural activity and increasing adoption of modern farming techniques.
Agricultural Adjuvants Market: A Comprehensive Report (2019-2033)
This comprehensive report provides an in-depth analysis of the Agricultural Adjuvants Market, offering invaluable insights for industry professionals, investors, and stakeholders. Covering the period from 2019 to 2033, with a focus on 2025, this report leverages rigorous research to deliver actionable intelligence and forecast market trends accurately.
Agricultural Adjuvants Market Structure & Innovation Trends
This section analyzes the competitive landscape, innovation drivers, and regulatory environment shaping the Agricultural Adjuvants Market. The market exhibits a moderately concentrated structure, with key players like Huntsman Corp, Nufarm, Solvay, and Brandt Consolidated Inc holding significant market share. Precise market share figures for 2025 are unavailable, but estimates place the top 5 companies at approximately 60% of the total market value. Innovation is driven by the need for improved crop yields, enhanced efficacy of pesticides and herbicides, and sustainable agricultural practices. Regulatory frameworks vary across geographies, influencing product approvals and market access. Significant M&A activity has been observed, with deal values exceeding xx Million in the past five years, primarily focused on expanding product portfolios and geographic reach. Product substitutes, while limited, include naturally derived adjuvants and specific formulations for particular crop types. The end-user demographics encompass large-scale commercial farms, smallholder farmers, and agricultural cooperatives.
- Market Concentration: Moderately concentrated with top 5 players holding ~60% market share (estimated).
- Innovation Drivers: Improved crop yields, enhanced pesticide/herbicide efficacy, sustainable agriculture.
- Regulatory Frameworks: Vary by geography, impacting product approvals and market access.
- M&A Activity: Significant activity in recent years, deals valued at over xx Million.
- Product Substitutes: Limited, primarily naturally-derived adjuvants and specialized formulations.
Agricultural Adjuvants Market Dynamics & Trends
The Agricultural Adjuvants Market is experiencing robust growth, driven by several key factors. Increasing global food demand fuels the need for higher crop yields, thereby increasing adjuvant usage. Technological advancements, such as the development of nanotechnology-based adjuvants and precision agriculture techniques, are improving efficacy and reducing environmental impact. Consumer preferences are shifting towards environmentally friendly and sustainable agricultural practices, creating demand for bio-based adjuvants. Intense competition among established players and emerging market entrants is leading to product innovation and price adjustments. The market is projected to grow at a CAGR of xx% during the forecast period (2025-2033). Market penetration remains high in developed regions but has significant potential for expansion in developing economies. The rising adoption of precision farming and the growing awareness of sustainable agricultural practices are further enhancing market expansion.
Dominant Regions & Segments in Agricultural Adjuvants Market
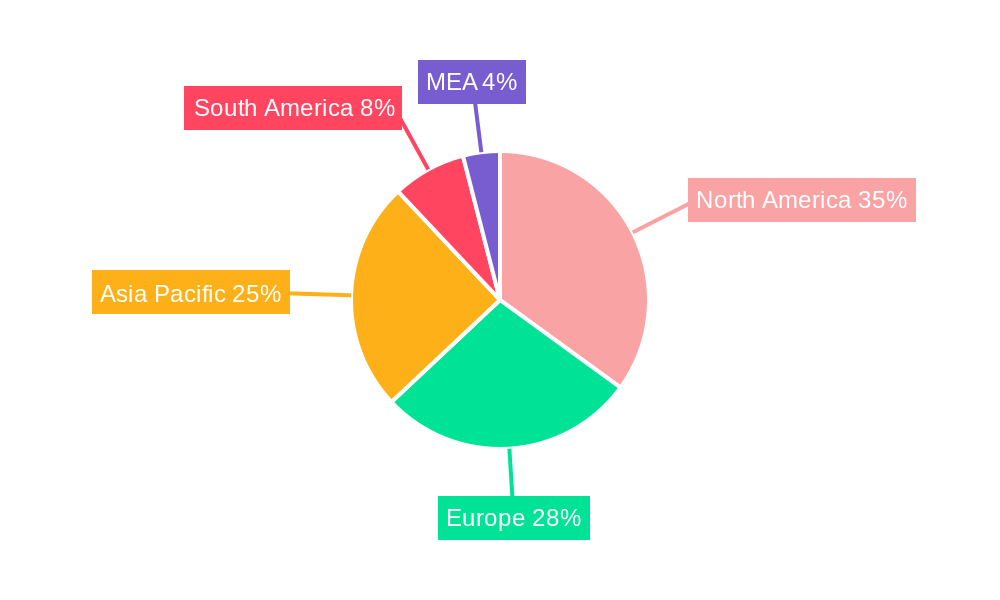
The North American region continues to be the dominant force in the Agricultural Adjuvants Market, propelled by its well-established agricultural infrastructure, consistently high crop yields, and widespread adoption of advanced farming techniques. Europe and the Asia-Pacific region follow, with significant contributions to market share. While established regions lead, the burgeoning agricultural sectors in Asia-Pacific and Latin America represent substantial growth frontiers. This expansion is fueled by increasing agricultural output to meet rising food demands and growing disposable incomes, which enable greater investment in modern farming inputs.
By Type:
- Activator Adjuvants: These adjuvants remain in high demand due to their crucial role in maximizing the effectiveness of active ingredients, leading to improved pest and disease control and nutrient uptake.
- Oil Adjuvants: Their superior spreading and penetrating capabilities make them indispensable for enhancing the coverage and absorption of agricultural chemicals, particularly herbicides and insecticides.
- Utility Adjuvants: The application spectrum of utility adjuvants is broadening, encompassing functions such as drift control, foam reduction, and water conditioning, making them essential for a wider range of agricultural operations.
By Application:
- Herbicide Adjuvants: This segment retains its position as the largest due to the pervasive use of herbicides in weed management across diverse cropping systems worldwide.
- Insecticide Adjuvants: The increasing frequency and severity of pest infestations globally are driving significant demand for insecticide adjuvants to enhance their efficacy and resilience.
- Fungicide Adjuvants: Growing awareness of the economic impact of fungal diseases and the continuous development of new fungicide formulations are contributing to the steady growth of this segment.
- Other Applications: This category encompasses a growing range of adjuvants integrated with fertilizers, plant growth regulators, and other specialized agricultural inputs, reflecting the trend towards more integrated crop management solutions.
Key Regional Dynamics:
- North America: Characterized by its robust agricultural infrastructure, high productivity, and early adoption of precision agriculture technologies.
- Europe: Driven by a strong emphasis on sustainability and increasingly stringent environmental regulations, fostering demand for eco-friendly and highly efficient adjuvant solutions.
- Asia-Pacific: Experiencing rapid agricultural expansion, a growing population, rising disposable incomes, and a critical need to boost food production, making it a dynamic market for adjuvant innovation.
Agricultural Adjuvants Market Product Innovations
Recent innovations focus on improving adjuvant efficacy, reducing environmental impact, and enhancing compatibility with various active ingredients. This includes developing bio-based adjuvants, formulations with improved spray characteristics, and adjuvants tailored to specific crop types and pest control needs. Nanotechnology-based adjuvants, offering superior penetration and distribution, are gaining traction. The market is witnessing a shift towards customized formulations to meet the specific needs of various crops and pesticides. These developments enhance the efficacy of active ingredients, reduce application rates, and minimize environmental impact, leading to improved crop yields and reduced production costs.
Report Scope & Segmentation Analysis
This report segments the Agricultural Adjuvants Market based on type (Activator Adjuvants, Oil Adjuvants, Utility Adjuvants) and application (Herbicide Adjuvants, Insecticide Adjuvants, Fungicide Adjuvants, Other Applications). Each segment's market size, growth projections, and competitive dynamics are thoroughly analyzed. Activator adjuvants are expected to witness significant growth driven by their efficacy in enhancing active ingredient performance. Oil adjuvants will maintain their market share due to their widespread use. The herbicide adjuvant segment is anticipated to dominate due to extensive herbicide usage, followed by insecticide and fungicide adjuvants. Growth projections vary across segments based on factors like crop type, pest prevalence, and pesticide usage patterns.
Key Drivers of Agricultural Adjuvants Market Growth
The Agricultural Adjuvants Market's growth is driven by several factors: the rising global demand for food, necessitating increased crop yields; technological advancements leading to more effective and sustainable adjuvants; stringent environmental regulations encouraging the adoption of eco-friendly adjuvants; and the rising adoption of precision agriculture techniques that optimize adjuvant usage. Government initiatives promoting sustainable agriculture practices further boost market growth.
Challenges in the Agricultural Adjuvants Market Sector
The Agricultural Adjuvants Market faces challenges such as stringent regulatory approvals, supply chain disruptions impacting raw material availability and price volatility, and intense competition among numerous players. These factors increase production costs and may limit market expansion. Furthermore, concerns regarding the environmental impact of some adjuvants pose regulatory and consumer perception challenges.
Emerging Opportunities in Agricultural Adjuvants Market
The Agricultural Adjuvants Market is ripe with emerging opportunities, particularly in the development and adoption of bio-based and biodegradable adjuvants. These sustainable alternatives are gaining traction as regulatory pressures and consumer demand for environmentally responsible agriculture intensify. Furthermore, significant untapped potential lies within emerging economies in developing countries, where the adoption of modern agricultural practices is on the rise. The integration of digital technologies, such as AI-driven recommendation systems and precision application equipment, also presents a lucrative avenue for optimizing adjuvant usage, enhancing efficiency, and reducing waste. The ongoing quest for more effective and sustainable crop protection solutions will undoubtedly fuel innovation and create substantial market openings for advanced adjuvant formulations.
Leading Players in the Agricultural Adjuvants Market Market
- Huntsman Corp
- Nufarm
- Solvay
- Brandt Consolidated Inc
- Garrco Products Inc
- Lamberti SPA
- Helena Chemical Company
- Evonik Industries AG
- Akzonobel NV
- Momentive Performance Materials Inc
- Adjuvant Plus Inc
- Interagro (UK) Ltd
- Wilbur-Ellis Company
- Croda International PLC
Key Developments in Agricultural Adjuvants Market Industry
- 2022-Q4: Launch of a novel bio-based adjuvant by Company X, targeting enhanced efficacy and reduced environmental impact.
- 2023-Q1: Strategic acquisition of Company Y by Company Z, expanding its product portfolio and market reach in the adjuvant sector.
- 2023-Q3: Introduction of a groundbreaking nanotechnology-based adjuvant by Company W, promising superior performance and targeted delivery of active ingredients.
- (Further significant developments include strategic partnerships for R&D, expansion into new geographical markets, and the introduction of specialized adjuvant formulations for niche crops and specific pest challenges.)
Future Outlook for Agricultural Adjuvants Market Market
The Agricultural Adjuvants Market is poised for sustained growth driven by increasing global food demand, technological advancements, and the growing adoption of sustainable agricultural practices. Strategic investments in research and development, expansion into new markets, and the development of innovative, eco-friendly adjuvants will be crucial for companies seeking to capitalize on future market opportunities.
Agricultural Adjuvants Market Segmentation
-
1. Type
-
1.1. Activator Adjuvants
- 1.1.1. Surfactants
- 1.1.2. Oil Adjuvants
- 1.2. Utility Adjuvants
-
1.1. Activator Adjuvants
-
2. Application
- 2.1. Herbicide Adjuvants
- 2.2. Insecticide Adjuvants
- 2.3. Fungicide Adjuvants
- 2.4. Other Applications
-
3. Type
-
3.1. Activator Adjuvants
- 3.1.1. Surfactants
- 3.1.2. Oil Adjuvants
- 3.2. Utility Adjuvants
-
3.1. Activator Adjuvants
-
4. Application
- 4.1. Herbicide Adjuvants
- 4.2. Insecticide Adjuvants
- 4.3. Fungicide Adjuvants
- 4.4. Other Applications
Agricultural Adjuvants Market Segmentation By Geography
-
1. North America
- 1.1. United States
- 1.2. Canada
- 1.3. Mexico
- 1.4. Rest of North America
-
2. Europe
- 2.1. Germany
- 2.2. United Kingdom
- 2.3. France
- 2.4. Italy
- 2.5. Russia
- 2.6. Rest of Europe
-
3. Asia Pacific
- 3.1. China
- 3.2. Japan
- 3.3. India
- 3.4. Australia
- 3.5. Rest of Asia Pacific
-
4. South America
- 4.1. Argentina
- 4.2. Brazil
- 4.3. Rest of South America
-
5. Africa
- 5.1. South Africa
- 5.2. Rest of Africa
Agricultural Adjuvants Market REPORT HIGHLIGHTS
| Aspects | Details |
|---|---|
| Study Period | 2019-2033 |
| Base Year | 2024 |
| Estimated Year | 2025 |
| Forecast Period | 2025-2033 |
| Historical Period | 2019-2024 |
| Growth Rate | CAGR of 4.70% from 2019-2033 |
| Segmentation |
|
Table of Contents
- 1. Introduction
- 1.1. Research Scope
- 1.2. Market Segmentation
- 1.3. Research Methodology
- 1.4. Definitions and Assumptions
- 2. Executive Summary
- 2.1. Introduction
- 3. Market Dynamics
- 3.1. Introduction
- 3.2. Market Drivers
- 3.2.1. Seed Treatment As A Solution To Enhance Yield; Growing Awareness For Seed Treatment Among The Farmers; Rising Trend Of Organic Farming
- 3.3. Market Restrains
- 3.3.1. Limitations Across Farm-Level Seed Treatment; Rising Environmental Concerns
- 3.4. Market Trends
- 3.4.1. Growing Food Demand and Decrease in Arable Land Driving the Market
- 4. Market Factor Analysis
- 4.1. Porters Five Forces
- 4.2. Supply/Value Chain
- 4.3. PESTEL analysis
- 4.4. Market Entropy
- 4.5. Patent/Trademark Analysis
- 5. Global Agricultural Adjuvants Market Analysis, Insights and Forecast, 2019-2031
- 5.1. Market Analysis, Insights and Forecast - by Type
- 5.1.1. Activator Adjuvants
- 5.1.1.1. Surfactants
- 5.1.1.2. Oil Adjuvants
- 5.1.2. Utility Adjuvants
- 5.1.1. Activator Adjuvants
- 5.2. Market Analysis, Insights and Forecast - by Application
- 5.2.1. Herbicide Adjuvants
- 5.2.2. Insecticide Adjuvants
- 5.2.3. Fungicide Adjuvants
- 5.2.4. Other Applications
- 5.3. Market Analysis, Insights and Forecast - by Type
- 5.3.1. Activator Adjuvants
- 5.3.1.1. Surfactants
- 5.3.1.2. Oil Adjuvants
- 5.3.2. Utility Adjuvants
- 5.3.1. Activator Adjuvants
- 5.4. Market Analysis, Insights and Forecast - by Application
- 5.4.1. Herbicide Adjuvants
- 5.4.2. Insecticide Adjuvants
- 5.4.3. Fungicide Adjuvants
- 5.4.4. Other Applications
- 5.5. Market Analysis, Insights and Forecast - by Region
- 5.5.1. North America
- 5.5.2. Europe
- 5.5.3. Asia Pacific
- 5.5.4. South America
- 5.5.5. Africa
- 5.1. Market Analysis, Insights and Forecast - by Type
- 6. North America Agricultural Adjuvants Market Analysis, Insights and Forecast, 2019-2031
- 6.1. Market Analysis, Insights and Forecast - by Type
- 6.1.1. Activator Adjuvants
- 6.1.1.1. Surfactants
- 6.1.1.2. Oil Adjuvants
- 6.1.2. Utility Adjuvants
- 6.1.1. Activator Adjuvants
- 6.2. Market Analysis, Insights and Forecast - by Application
- 6.2.1. Herbicide Adjuvants
- 6.2.2. Insecticide Adjuvants
- 6.2.3. Fungicide Adjuvants
- 6.2.4. Other Applications
- 6.3. Market Analysis, Insights and Forecast - by Type
- 6.3.1. Activator Adjuvants
- 6.3.1.1. Surfactants
- 6.3.1.2. Oil Adjuvants
- 6.3.2. Utility Adjuvants
- 6.3.1. Activator Adjuvants
- 6.4. Market Analysis, Insights and Forecast - by Application
- 6.4.1. Herbicide Adjuvants
- 6.4.2. Insecticide Adjuvants
- 6.4.3. Fungicide Adjuvants
- 6.4.4. Other Applications
- 6.1. Market Analysis, Insights and Forecast - by Type
- 7. Europe Agricultural Adjuvants Market Analysis, Insights and Forecast, 2019-2031
- 7.1. Market Analysis, Insights and Forecast - by Type
- 7.1.1. Activator Adjuvants
- 7.1.1.1. Surfactants
- 7.1.1.2. Oil Adjuvants
- 7.1.2. Utility Adjuvants
- 7.1.1. Activator Adjuvants
- 7.2. Market Analysis, Insights and Forecast - by Application
- 7.2.1. Herbicide Adjuvants
- 7.2.2. Insecticide Adjuvants
- 7.2.3. Fungicide Adjuvants
- 7.2.4. Other Applications
- 7.3. Market Analysis, Insights and Forecast - by Type
- 7.3.1. Activator Adjuvants
- 7.3.1.1. Surfactants
- 7.3.1.2. Oil Adjuvants
- 7.3.2. Utility Adjuvants
- 7.3.1. Activator Adjuvants
- 7.4. Market Analysis, Insights and Forecast - by Application
- 7.4.1. Herbicide Adjuvants
- 7.4.2. Insecticide Adjuvants
- 7.4.3. Fungicide Adjuvants
- 7.4.4. Other Applications
- 7.1. Market Analysis, Insights and Forecast - by Type
- 8. Asia Pacific Agricultural Adjuvants Market Analysis, Insights and Forecast, 2019-2031
- 8.1. Market Analysis, Insights and Forecast - by Type
- 8.1.1. Activator Adjuvants
- 8.1.1.1. Surfactants
- 8.1.1.2. Oil Adjuvants
- 8.1.2. Utility Adjuvants
- 8.1.1. Activator Adjuvants
- 8.2. Market Analysis, Insights and Forecast - by Application
- 8.2.1. Herbicide Adjuvants
- 8.2.2. Insecticide Adjuvants
- 8.2.3. Fungicide Adjuvants
- 8.2.4. Other Applications
- 8.3. Market Analysis, Insights and Forecast - by Type
- 8.3.1. Activator Adjuvants
- 8.3.1.1. Surfactants
- 8.3.1.2. Oil Adjuvants
- 8.3.2. Utility Adjuvants
- 8.3.1. Activator Adjuvants
- 8.4. Market Analysis, Insights and Forecast - by Application
- 8.4.1. Herbicide Adjuvants
- 8.4.2. Insecticide Adjuvants
- 8.4.3. Fungicide Adjuvants
- 8.4.4. Other Applications
- 8.1. Market Analysis, Insights and Forecast - by Type
- 9. South America Agricultural Adjuvants Market Analysis, Insights and Forecast, 2019-2031
- 9.1. Market Analysis, Insights and Forecast - by Type
- 9.1.1. Activator Adjuvants
- 9.1.1.1. Surfactants
- 9.1.1.2. Oil Adjuvants
- 9.1.2. Utility Adjuvants
- 9.1.1. Activator Adjuvants
- 9.2. Market Analysis, Insights and Forecast - by Application
- 9.2.1. Herbicide Adjuvants
- 9.2.2. Insecticide Adjuvants
- 9.2.3. Fungicide Adjuvants
- 9.2.4. Other Applications
- 9.3. Market Analysis, Insights and Forecast - by Type
- 9.3.1. Activator Adjuvants
- 9.3.1.1. Surfactants
- 9.3.1.2. Oil Adjuvants
- 9.3.2. Utility Adjuvants
- 9.3.1. Activator Adjuvants
- 9.4. Market Analysis, Insights and Forecast - by Application
- 9.4.1. Herbicide Adjuvants
- 9.4.2. Insecticide Adjuvants
- 9.4.3. Fungicide Adjuvants
- 9.4.4. Other Applications
- 9.1. Market Analysis, Insights and Forecast - by Type
- 10. Africa Agricultural Adjuvants Market Analysis, Insights and Forecast, 2019-2031
- 10.1. Market Analysis, Insights and Forecast - by Type
- 10.1.1. Activator Adjuvants
- 10.1.1.1. Surfactants
- 10.1.1.2. Oil Adjuvants
- 10.1.2. Utility Adjuvants
- 10.1.1. Activator Adjuvants
- 10.2. Market Analysis, Insights and Forecast - by Application
- 10.2.1. Herbicide Adjuvants
- 10.2.2. Insecticide Adjuvants
- 10.2.3. Fungicide Adjuvants
- 10.2.4. Other Applications
- 10.3. Market Analysis, Insights and Forecast - by Type
- 10.3.1. Activator Adjuvants
- 10.3.1.1. Surfactants
- 10.3.1.2. Oil Adjuvants
- 10.3.2. Utility Adjuvants
- 10.3.1. Activator Adjuvants
- 10.4. Market Analysis, Insights and Forecast - by Application
- 10.4.1. Herbicide Adjuvants
- 10.4.2. Insecticide Adjuvants
- 10.4.3. Fungicide Adjuvants
- 10.4.4. Other Applications
- 10.1. Market Analysis, Insights and Forecast - by Type
- 11. North America Agricultural Adjuvants Market Analysis, Insights and Forecast, 2019-2031
- 11.1. Market Analysis, Insights and Forecast - By Country/Sub-region
- 11.1.1 United States
- 11.1.2 Canada
- 11.1.3 Mexico
- 12. Europe Agricultural Adjuvants Market Analysis, Insights and Forecast, 2019-2031
- 12.1. Market Analysis, Insights and Forecast - By Country/Sub-region
- 12.1.1 Germany
- 12.1.2 United Kingdom
- 12.1.3 France
- 12.1.4 Spain
- 12.1.5 Italy
- 12.1.6 Spain
- 12.1.7 Belgium
- 12.1.8 Netherland
- 12.1.9 Nordics
- 12.1.10 Rest of Europe
- 13. Asia Pacific Agricultural Adjuvants Market Analysis, Insights and Forecast, 2019-2031
- 13.1. Market Analysis, Insights and Forecast - By Country/Sub-region
- 13.1.1 China
- 13.1.2 Japan
- 13.1.3 India
- 13.1.4 South Korea
- 13.1.5 Southeast Asia
- 13.1.6 Australia
- 13.1.7 Indonesia
- 13.1.8 Phillipes
- 13.1.9 Singapore
- 13.1.10 Thailandc
- 13.1.11 Rest of Asia Pacific
- 14. South America Agricultural Adjuvants Market Analysis, Insights and Forecast, 2019-2031
- 14.1. Market Analysis, Insights and Forecast - By Country/Sub-region
- 14.1.1 Brazil
- 14.1.2 Argentina
- 14.1.3 Peru
- 14.1.4 Chile
- 14.1.5 Colombia
- 14.1.6 Ecuador
- 14.1.7 Venezuela
- 14.1.8 Rest of South America
- 15. North America Agricultural Adjuvants Market Analysis, Insights and Forecast, 2019-2031
- 15.1. Market Analysis, Insights and Forecast - By Country/Sub-region
- 15.1.1 United States
- 15.1.2 Canada
- 15.1.3 Mexico
- 16. MEA Agricultural Adjuvants Market Analysis, Insights and Forecast, 2019-2031
- 16.1. Market Analysis, Insights and Forecast - By Country/Sub-region
- 16.1.1 United Arab Emirates
- 16.1.2 Saudi Arabia
- 16.1.3 South Africa
- 16.1.4 Rest of Middle East and Africa
- 17. Competitive Analysis
- 17.1. Global Market Share Analysis 2024
- 17.2. Company Profiles
- 17.2.1 Huntsman Corp
- 17.2.1.1. Overview
- 17.2.1.2. Products
- 17.2.1.3. SWOT Analysis
- 17.2.1.4. Recent Developments
- 17.2.1.5. Financials (Based on Availability)
- 17.2.2 Nufarm
- 17.2.2.1. Overview
- 17.2.2.2. Products
- 17.2.2.3. SWOT Analysis
- 17.2.2.4. Recent Developments
- 17.2.2.5. Financials (Based on Availability)
- 17.2.3 Solvay
- 17.2.3.1. Overview
- 17.2.3.2. Products
- 17.2.3.3. SWOT Analysis
- 17.2.3.4. Recent Developments
- 17.2.3.5. Financials (Based on Availability)
- 17.2.4 Brandt Consolidated Inc
- 17.2.4.1. Overview
- 17.2.4.2. Products
- 17.2.4.3. SWOT Analysis
- 17.2.4.4. Recent Developments
- 17.2.4.5. Financials (Based on Availability)
- 17.2.5 Garrco Products Inc
- 17.2.5.1. Overview
- 17.2.5.2. Products
- 17.2.5.3. SWOT Analysis
- 17.2.5.4. Recent Developments
- 17.2.5.5. Financials (Based on Availability)
- 17.2.6 Lamberti SPA
- 17.2.6.1. Overview
- 17.2.6.2. Products
- 17.2.6.3. SWOT Analysis
- 17.2.6.4. Recent Developments
- 17.2.6.5. Financials (Based on Availability)
- 17.2.7 Helena Chemical Company
- 17.2.7.1. Overview
- 17.2.7.2. Products
- 17.2.7.3. SWOT Analysis
- 17.2.7.4. Recent Developments
- 17.2.7.5. Financials (Based on Availability)
- 17.2.8 Evonik Industries AG
- 17.2.8.1. Overview
- 17.2.8.2. Products
- 17.2.8.3. SWOT Analysis
- 17.2.8.4. Recent Developments
- 17.2.8.5. Financials (Based on Availability)
- 17.2.9 Akzonobel NV
- 17.2.9.1. Overview
- 17.2.9.2. Products
- 17.2.9.3. SWOT Analysis
- 17.2.9.4. Recent Developments
- 17.2.9.5. Financials (Based on Availability)
- 17.2.10 Momentive Performance Materials Inc
- 17.2.10.1. Overview
- 17.2.10.2. Products
- 17.2.10.3. SWOT Analysis
- 17.2.10.4. Recent Developments
- 17.2.10.5. Financials (Based on Availability)
- 17.2.11 Adjuvant Plus Inc
- 17.2.11.1. Overview
- 17.2.11.2. Products
- 17.2.11.3. SWOT Analysis
- 17.2.11.4. Recent Developments
- 17.2.11.5. Financials (Based on Availability)
- 17.2.12 Interagro (UK) Ltd
- 17.2.12.1. Overview
- 17.2.12.2. Products
- 17.2.12.3. SWOT Analysis
- 17.2.12.4. Recent Developments
- 17.2.12.5. Financials (Based on Availability)
- 17.2.13 Wilbur-Ellis Compan
- 17.2.13.1. Overview
- 17.2.13.2. Products
- 17.2.13.3. SWOT Analysis
- 17.2.13.4. Recent Developments
- 17.2.13.5. Financials (Based on Availability)
- 17.2.14 Croda International PLC
- 17.2.14.1. Overview
- 17.2.14.2. Products
- 17.2.14.3. SWOT Analysis
- 17.2.14.4. Recent Developments
- 17.2.14.5. Financials (Based on Availability)
- 17.2.1 Huntsman Corp
List of Figures
- Figure 1: Global Agricultural Adjuvants Market Revenue Breakdown (Million, %) by Region 2024 & 2032
- Figure 2: North America Agricultural Adjuvants Market Revenue (Million), by Country 2024 & 2032
- Figure 3: North America Agricultural Adjuvants Market Revenue Share (%), by Country 2024 & 2032
- Figure 4: Europe Agricultural Adjuvants Market Revenue (Million), by Country 2024 & 2032
- Figure 5: Europe Agricultural Adjuvants Market Revenue Share (%), by Country 2024 & 2032
- Figure 6: Asia Pacific Agricultural Adjuvants Market Revenue (Million), by Country 2024 & 2032
- Figure 7: Asia Pacific Agricultural Adjuvants Market Revenue Share (%), by Country 2024 & 2032
- Figure 8: South America Agricultural Adjuvants Market Revenue (Million), by Country 2024 & 2032
- Figure 9: South America Agricultural Adjuvants Market Revenue Share (%), by Country 2024 & 2032
- Figure 10: North America Agricultural Adjuvants Market Revenue (Million), by Country 2024 & 2032
- Figure 11: North America Agricultural Adjuvants Market Revenue Share (%), by Country 2024 & 2032
- Figure 12: MEA Agricultural Adjuvants Market Revenue (Million), by Country 2024 & 2032
- Figure 13: MEA Agricultural Adjuvants Market Revenue Share (%), by Country 2024 & 2032
- Figure 14: North America Agricultural Adjuvants Market Revenue (Million), by Type 2024 & 2032
- Figure 15: North America Agricultural Adjuvants Market Revenue Share (%), by Type 2024 & 2032
- Figure 16: North America Agricultural Adjuvants Market Revenue (Million), by Application 2024 & 2032
- Figure 17: North America Agricultural Adjuvants Market Revenue Share (%), by Application 2024 & 2032
- Figure 18: North America Agricultural Adjuvants Market Revenue (Million), by Type 2024 & 2032
- Figure 19: North America Agricultural Adjuvants Market Revenue Share (%), by Type 2024 & 2032
- Figure 20: North America Agricultural Adjuvants Market Revenue (Million), by Application 2024 & 2032
- Figure 21: North America Agricultural Adjuvants Market Revenue Share (%), by Application 2024 & 2032
- Figure 22: North America Agricultural Adjuvants Market Revenue (Million), by Country 2024 & 2032
- Figure 23: North America Agricultural Adjuvants Market Revenue Share (%), by Country 2024 & 2032
- Figure 24: Europe Agricultural Adjuvants Market Revenue (Million), by Type 2024 & 2032
- Figure 25: Europe Agricultural Adjuvants Market Revenue Share (%), by Type 2024 & 2032
- Figure 26: Europe Agricultural Adjuvants Market Revenue (Million), by Application 2024 & 2032
- Figure 27: Europe Agricultural Adjuvants Market Revenue Share (%), by Application 2024 & 2032
- Figure 28: Europe Agricultural Adjuvants Market Revenue (Million), by Type 2024 & 2032
- Figure 29: Europe Agricultural Adjuvants Market Revenue Share (%), by Type 2024 & 2032
- Figure 30: Europe Agricultural Adjuvants Market Revenue (Million), by Application 2024 & 2032
- Figure 31: Europe Agricultural Adjuvants Market Revenue Share (%), by Application 2024 & 2032
- Figure 32: Europe Agricultural Adjuvants Market Revenue (Million), by Country 2024 & 2032
- Figure 33: Europe Agricultural Adjuvants Market Revenue Share (%), by Country 2024 & 2032
- Figure 34: Asia Pacific Agricultural Adjuvants Market Revenue (Million), by Type 2024 & 2032
- Figure 35: Asia Pacific Agricultural Adjuvants Market Revenue Share (%), by Type 2024 & 2032
- Figure 36: Asia Pacific Agricultural Adjuvants Market Revenue (Million), by Application 2024 & 2032
- Figure 37: Asia Pacific Agricultural Adjuvants Market Revenue Share (%), by Application 2024 & 2032
- Figure 38: Asia Pacific Agricultural Adjuvants Market Revenue (Million), by Type 2024 & 2032
- Figure 39: Asia Pacific Agricultural Adjuvants Market Revenue Share (%), by Type 2024 & 2032
- Figure 40: Asia Pacific Agricultural Adjuvants Market Revenue (Million), by Application 2024 & 2032
- Figure 41: Asia Pacific Agricultural Adjuvants Market Revenue Share (%), by Application 2024 & 2032
- Figure 42: Asia Pacific Agricultural Adjuvants Market Revenue (Million), by Country 2024 & 2032
- Figure 43: Asia Pacific Agricultural Adjuvants Market Revenue Share (%), by Country 2024 & 2032
- Figure 44: South America Agricultural Adjuvants Market Revenue (Million), by Type 2024 & 2032
- Figure 45: South America Agricultural Adjuvants Market Revenue Share (%), by Type 2024 & 2032
- Figure 46: South America Agricultural Adjuvants Market Revenue (Million), by Application 2024 & 2032
- Figure 47: South America Agricultural Adjuvants Market Revenue Share (%), by Application 2024 & 2032
- Figure 48: South America Agricultural Adjuvants Market Revenue (Million), by Type 2024 & 2032
- Figure 49: South America Agricultural Adjuvants Market Revenue Share (%), by Type 2024 & 2032
- Figure 50: South America Agricultural Adjuvants Market Revenue (Million), by Application 2024 & 2032
- Figure 51: South America Agricultural Adjuvants Market Revenue Share (%), by Application 2024 & 2032
- Figure 52: South America Agricultural Adjuvants Market Revenue (Million), by Country 2024 & 2032
- Figure 53: South America Agricultural Adjuvants Market Revenue Share (%), by Country 2024 & 2032
- Figure 54: Africa Agricultural Adjuvants Market Revenue (Million), by Type 2024 & 2032
- Figure 55: Africa Agricultural Adjuvants Market Revenue Share (%), by Type 2024 & 2032
- Figure 56: Africa Agricultural Adjuvants Market Revenue (Million), by Application 2024 & 2032
- Figure 57: Africa Agricultural Adjuvants Market Revenue Share (%), by Application 2024 & 2032
- Figure 58: Africa Agricultural Adjuvants Market Revenue (Million), by Type 2024 & 2032
- Figure 59: Africa Agricultural Adjuvants Market Revenue Share (%), by Type 2024 & 2032
- Figure 60: Africa Agricultural Adjuvants Market Revenue (Million), by Application 2024 & 2032
- Figure 61: Africa Agricultural Adjuvants Market Revenue Share (%), by Application 2024 & 2032
- Figure 62: Africa Agricultural Adjuvants Market Revenue (Million), by Country 2024 & 2032
- Figure 63: Africa Agricultural Adjuvants Market Revenue Share (%), by Country 2024 & 2032
List of Tables
- Table 1: Global Agricultural Adjuvants Market Revenue Million Forecast, by Region 2019 & 2032
- Table 2: Global Agricultural Adjuvants Market Revenue Million Forecast, by Type 2019 & 2032
- Table 3: Global Agricultural Adjuvants Market Revenue Million Forecast, by Application 2019 & 2032
- Table 4: Global Agricultural Adjuvants Market Revenue Million Forecast, by Type 2019 & 2032
- Table 5: Global Agricultural Adjuvants Market Revenue Million Forecast, by Application 2019 & 2032
- Table 6: Global Agricultural Adjuvants Market Revenue Million Forecast, by Region 2019 & 2032
- Table 7: Global Agricultural Adjuvants Market Revenue Million Forecast, by Country 2019 & 2032
- Table 8: United States Agricultural Adjuvants Market Revenue (Million) Forecast, by Application 2019 & 2032
- Table 9: Canada Agricultural Adjuvants Market Revenue (Million) Forecast, by Application 2019 & 2032
- Table 10: Mexico Agricultural Adjuvants Market Revenue (Million) Forecast, by Application 2019 & 2032
- Table 11: Global Agricultural Adjuvants Market Revenue Million Forecast, by Country 2019 & 2032
- Table 12: Germany Agricultural Adjuvants Market Revenue (Million) Forecast, by Application 2019 & 2032
- Table 13: United Kingdom Agricultural Adjuvants Market Revenue (Million) Forecast, by Application 2019 & 2032
- Table 14: France Agricultural Adjuvants Market Revenue (Million) Forecast, by Application 2019 & 2032
- Table 15: Spain Agricultural Adjuvants Market Revenue (Million) Forecast, by Application 2019 & 2032
- Table 16: Italy Agricultural Adjuvants Market Revenue (Million) Forecast, by Application 2019 & 2032
- Table 17: Spain Agricultural Adjuvants Market Revenue (Million) Forecast, by Application 2019 & 2032
- Table 18: Belgium Agricultural Adjuvants Market Revenue (Million) Forecast, by Application 2019 & 2032
- Table 19: Netherland Agricultural Adjuvants Market Revenue (Million) Forecast, by Application 2019 & 2032
- Table 20: Nordics Agricultural Adjuvants Market Revenue (Million) Forecast, by Application 2019 & 2032
- Table 21: Rest of Europe Agricultural Adjuvants Market Revenue (Million) Forecast, by Application 2019 & 2032
- Table 22: Global Agricultural Adjuvants Market Revenue Million Forecast, by Country 2019 & 2032
- Table 23: China Agricultural Adjuvants Market Revenue (Million) Forecast, by Application 2019 & 2032
- Table 24: Japan Agricultural Adjuvants Market Revenue (Million) Forecast, by Application 2019 & 2032
- Table 25: India Agricultural Adjuvants Market Revenue (Million) Forecast, by Application 2019 & 2032
- Table 26: South Korea Agricultural Adjuvants Market Revenue (Million) Forecast, by Application 2019 & 2032
- Table 27: Southeast Asia Agricultural Adjuvants Market Revenue (Million) Forecast, by Application 2019 & 2032
- Table 28: Australia Agricultural Adjuvants Market Revenue (Million) Forecast, by Application 2019 & 2032
- Table 29: Indonesia Agricultural Adjuvants Market Revenue (Million) Forecast, by Application 2019 & 2032
- Table 30: Phillipes Agricultural Adjuvants Market Revenue (Million) Forecast, by Application 2019 & 2032
- Table 31: Singapore Agricultural Adjuvants Market Revenue (Million) Forecast, by Application 2019 & 2032
- Table 32: Thailandc Agricultural Adjuvants Market Revenue (Million) Forecast, by Application 2019 & 2032
- Table 33: Rest of Asia Pacific Agricultural Adjuvants Market Revenue (Million) Forecast, by Application 2019 & 2032
- Table 34: Global Agricultural Adjuvants Market Revenue Million Forecast, by Country 2019 & 2032
- Table 35: Brazil Agricultural Adjuvants Market Revenue (Million) Forecast, by Application 2019 & 2032
- Table 36: Argentina Agricultural Adjuvants Market Revenue (Million) Forecast, by Application 2019 & 2032
- Table 37: Peru Agricultural Adjuvants Market Revenue (Million) Forecast, by Application 2019 & 2032
- Table 38: Chile Agricultural Adjuvants Market Revenue (Million) Forecast, by Application 2019 & 2032
- Table 39: Colombia Agricultural Adjuvants Market Revenue (Million) Forecast, by Application 2019 & 2032
- Table 40: Ecuador Agricultural Adjuvants Market Revenue (Million) Forecast, by Application 2019 & 2032
- Table 41: Venezuela Agricultural Adjuvants Market Revenue (Million) Forecast, by Application 2019 & 2032
- Table 42: Rest of South America Agricultural Adjuvants Market Revenue (Million) Forecast, by Application 2019 & 2032
- Table 43: Global Agricultural Adjuvants Market Revenue Million Forecast, by Country 2019 & 2032
- Table 44: United States Agricultural Adjuvants Market Revenue (Million) Forecast, by Application 2019 & 2032
- Table 45: Canada Agricultural Adjuvants Market Revenue (Million) Forecast, by Application 2019 & 2032
- Table 46: Mexico Agricultural Adjuvants Market Revenue (Million) Forecast, by Application 2019 & 2032
- Table 47: Global Agricultural Adjuvants Market Revenue Million Forecast, by Country 2019 & 2032
- Table 48: United Arab Emirates Agricultural Adjuvants Market Revenue (Million) Forecast, by Application 2019 & 2032
- Table 49: Saudi Arabia Agricultural Adjuvants Market Revenue (Million) Forecast, by Application 2019 & 2032
- Table 50: South Africa Agricultural Adjuvants Market Revenue (Million) Forecast, by Application 2019 & 2032
- Table 51: Rest of Middle East and Africa Agricultural Adjuvants Market Revenue (Million) Forecast, by Application 2019 & 2032
- Table 52: Global Agricultural Adjuvants Market Revenue Million Forecast, by Type 2019 & 2032
- Table 53: Global Agricultural Adjuvants Market Revenue Million Forecast, by Application 2019 & 2032
- Table 54: Global Agricultural Adjuvants Market Revenue Million Forecast, by Type 2019 & 2032
- Table 55: Global Agricultural Adjuvants Market Revenue Million Forecast, by Application 2019 & 2032
- Table 56: Global Agricultural Adjuvants Market Revenue Million Forecast, by Country 2019 & 2032
- Table 57: United States Agricultural Adjuvants Market Revenue (Million) Forecast, by Application 2019 & 2032
- Table 58: Canada Agricultural Adjuvants Market Revenue (Million) Forecast, by Application 2019 & 2032
- Table 59: Mexico Agricultural Adjuvants Market Revenue (Million) Forecast, by Application 2019 & 2032
- Table 60: Rest of North America Agricultural Adjuvants Market Revenue (Million) Forecast, by Application 2019 & 2032
- Table 61: Global Agricultural Adjuvants Market Revenue Million Forecast, by Type 2019 & 2032
- Table 62: Global Agricultural Adjuvants Market Revenue Million Forecast, by Application 2019 & 2032
- Table 63: Global Agricultural Adjuvants Market Revenue Million Forecast, by Type 2019 & 2032
- Table 64: Global Agricultural Adjuvants Market Revenue Million Forecast, by Application 2019 & 2032
- Table 65: Global Agricultural Adjuvants Market Revenue Million Forecast, by Country 2019 & 2032
- Table 66: Germany Agricultural Adjuvants Market Revenue (Million) Forecast, by Application 2019 & 2032
- Table 67: United Kingdom Agricultural Adjuvants Market Revenue (Million) Forecast, by Application 2019 & 2032
- Table 68: France Agricultural Adjuvants Market Revenue (Million) Forecast, by Application 2019 & 2032
- Table 69: Italy Agricultural Adjuvants Market Revenue (Million) Forecast, by Application 2019 & 2032
- Table 70: Russia Agricultural Adjuvants Market Revenue (Million) Forecast, by Application 2019 & 2032
- Table 71: Rest of Europe Agricultural Adjuvants Market Revenue (Million) Forecast, by Application 2019 & 2032
- Table 72: Global Agricultural Adjuvants Market Revenue Million Forecast, by Type 2019 & 2032
- Table 73: Global Agricultural Adjuvants Market Revenue Million Forecast, by Application 2019 & 2032
- Table 74: Global Agricultural Adjuvants Market Revenue Million Forecast, by Type 2019 & 2032
- Table 75: Global Agricultural Adjuvants Market Revenue Million Forecast, by Application 2019 & 2032
- Table 76: Global Agricultural Adjuvants Market Revenue Million Forecast, by Country 2019 & 2032
- Table 77: China Agricultural Adjuvants Market Revenue (Million) Forecast, by Application 2019 & 2032
- Table 78: Japan Agricultural Adjuvants Market Revenue (Million) Forecast, by Application 2019 & 2032
- Table 79: India Agricultural Adjuvants Market Revenue (Million) Forecast, by Application 2019 & 2032
- Table 80: Australia Agricultural Adjuvants Market Revenue (Million) Forecast, by Application 2019 & 2032
- Table 81: Rest of Asia Pacific Agricultural Adjuvants Market Revenue (Million) Forecast, by Application 2019 & 2032
- Table 82: Global Agricultural Adjuvants Market Revenue Million Forecast, by Type 2019 & 2032
- Table 83: Global Agricultural Adjuvants Market Revenue Million Forecast, by Application 2019 & 2032
- Table 84: Global Agricultural Adjuvants Market Revenue Million Forecast, by Type 2019 & 2032
- Table 85: Global Agricultural Adjuvants Market Revenue Million Forecast, by Application 2019 & 2032
- Table 86: Global Agricultural Adjuvants Market Revenue Million Forecast, by Country 2019 & 2032
- Table 87: Argentina Agricultural Adjuvants Market Revenue (Million) Forecast, by Application 2019 & 2032
- Table 88: Brazil Agricultural Adjuvants Market Revenue (Million) Forecast, by Application 2019 & 2032
- Table 89: Rest of South America Agricultural Adjuvants Market Revenue (Million) Forecast, by Application 2019 & 2032
- Table 90: Global Agricultural Adjuvants Market Revenue Million Forecast, by Type 2019 & 2032
- Table 91: Global Agricultural Adjuvants Market Revenue Million Forecast, by Application 2019 & 2032
- Table 92: Global Agricultural Adjuvants Market Revenue Million Forecast, by Type 2019 & 2032
- Table 93: Global Agricultural Adjuvants Market Revenue Million Forecast, by Application 2019 & 2032
- Table 94: Global Agricultural Adjuvants Market Revenue Million Forecast, by Country 2019 & 2032
- Table 95: South Africa Agricultural Adjuvants Market Revenue (Million) Forecast, by Application 2019 & 2032
- Table 96: Rest of Africa Agricultural Adjuvants Market Revenue (Million) Forecast, by Application 2019 & 2032
Frequently Asked Questions
1. What is the projected Compound Annual Growth Rate (CAGR) of the Agricultural Adjuvants Market?
The projected CAGR is approximately 4.70%.
2. Which companies are prominent players in the Agricultural Adjuvants Market?
Key companies in the market include Huntsman Corp, Nufarm, Solvay, Brandt Consolidated Inc, Garrco Products Inc, Lamberti SPA, Helena Chemical Company, Evonik Industries AG, Akzonobel NV, Momentive Performance Materials Inc, Adjuvant Plus Inc, Interagro (UK) Ltd, Wilbur-Ellis Compan, Croda International PLC.
3. What are the main segments of the Agricultural Adjuvants Market?
The market segments include Type, Application, Type, Application.
4. Can you provide details about the market size?
The market size is estimated to be USD 2.24 Million as of 2022.
5. What are some drivers contributing to market growth?
Seed Treatment As A Solution To Enhance Yield; Growing Awareness For Seed Treatment Among The Farmers; Rising Trend Of Organic Farming.
6. What are the notable trends driving market growth?
Growing Food Demand and Decrease in Arable Land Driving the Market.
7. Are there any restraints impacting market growth?
Limitations Across Farm-Level Seed Treatment; Rising Environmental Concerns.
8. Can you provide examples of recent developments in the market?
N/A
9. What pricing options are available for accessing the report?
Pricing options include single-user, multi-user, and enterprise licenses priced at USD 4750, USD 5250, and USD 8750 respectively.
10. Is the market size provided in terms of value or volume?
The market size is provided in terms of value, measured in Million.
11. Are there any specific market keywords associated with the report?
Yes, the market keyword associated with the report is "Agricultural Adjuvants Market," which aids in identifying and referencing the specific market segment covered.
12. How do I determine which pricing option suits my needs best?
The pricing options vary based on user requirements and access needs. Individual users may opt for single-user licenses, while businesses requiring broader access may choose multi-user or enterprise licenses for cost-effective access to the report.
13. Are there any additional resources or data provided in the Agricultural Adjuvants Market report?
While the report offers comprehensive insights, it's advisable to review the specific contents or supplementary materials provided to ascertain if additional resources or data are available.
14. How can I stay updated on further developments or reports in the Agricultural Adjuvants Market?
To stay informed about further developments, trends, and reports in the Agricultural Adjuvants Market, consider subscribing to industry newsletters, following relevant companies and organizations, or regularly checking reputable industry news sources and publications.
Methodology
Step 1 - Identification of Relevant Samples Size from Population Database


Step 2 - Approaches for Defining Global Market Size (Value, Volume* & Price*)

Note*: In applicable scenarios
Step 3 - Data Sources
Primary Research
- Web Analytics
- Survey Reports
- Research Institute
- Latest Research Reports
- Opinion Leaders
Secondary Research
- Annual Reports
- White Paper
- Latest Press Release
- Industry Association
- Paid Database
- Investor Presentations

Step 4 - Data Triangulation
Involves using different sources of information in order to increase the validity of a study
These sources are likely to be stakeholders in a program - participants, other researchers, program staff, other community members, and so on.
Then we put all data in single framework & apply various statistical tools to find out the dynamic on the market.
During the analysis stage, feedback from the stakeholder groups would be compared to determine areas of agreement as well as areas of divergence


