
Key Insights
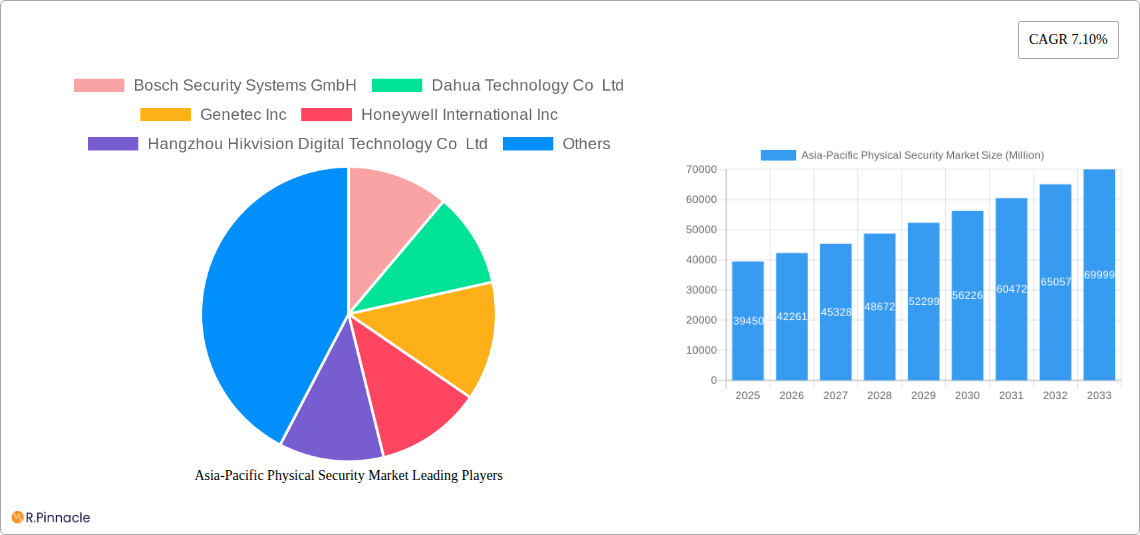
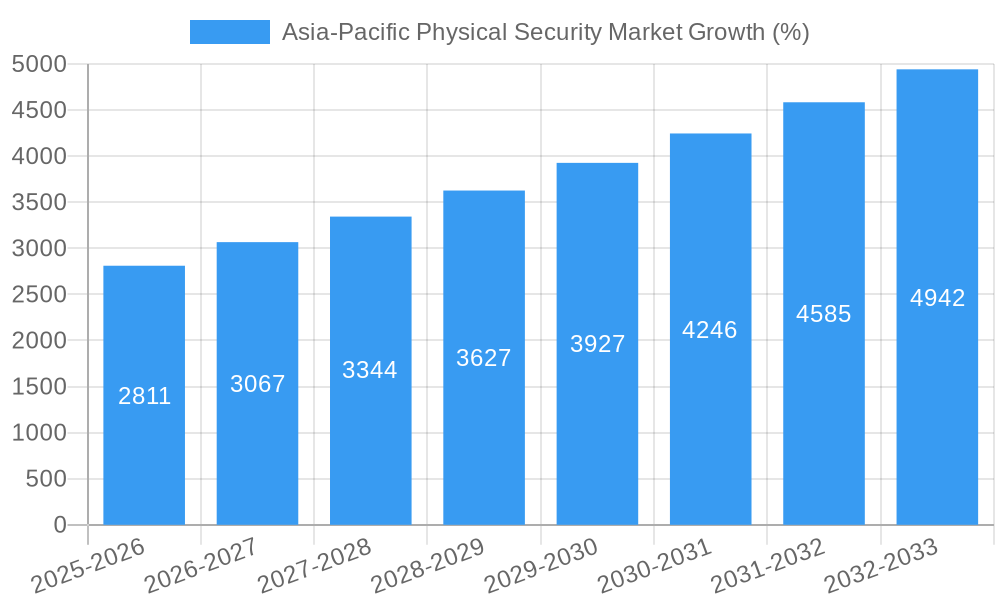
The Asia-Pacific physical security market is experiencing robust growth, projected to reach \$39.45 billion in 2025 and maintain a Compound Annual Growth Rate (CAGR) of 7.10% from 2025 to 2033. This expansion is driven by several key factors. Increasing urbanization across the region leads to heightened demand for security solutions in densely populated areas, encompassing residential complexes, commercial establishments, and critical infrastructure. Furthermore, the rising adoption of advanced technologies like artificial intelligence (AI), video analytics, and cloud-based security systems is enhancing the market's capabilities and appeal. Government initiatives focused on strengthening national security and promoting smart city development are also contributing significantly. The growing awareness of cybersecurity threats and the need for robust physical security measures to prevent breaches further fuels market growth. Key players such as Bosch, Dahua, Hikvision, and Honeywell are leveraging technological advancements and strategic partnerships to consolidate their market presence and cater to the diverse security needs of the region.
However, certain challenges restrain market expansion. The high initial investment costs associated with implementing sophisticated security systems can hinder adoption, particularly among small and medium-sized enterprises (SMEs). Furthermore, concerns regarding data privacy and security related to the use of advanced technologies, coupled with a lack of skilled professionals to operate and maintain these systems, pose significant challenges. Despite these obstacles, the Asia-Pacific physical security market’s growth trajectory remains optimistic, driven by continuous technological innovation, increasing government support, and rising security concerns across various sectors. Segmentation within the market includes access control, video surveillance, intrusion detection, and perimeter security, each contributing to the overall expansion and diversification of the sector.
Asia-Pacific Physical Security Market Report: 2019-2033
This comprehensive report provides an in-depth analysis of the Asia-Pacific physical security market, offering valuable insights for industry professionals, investors, and strategic decision-makers. Covering the period from 2019 to 2033 (Study Period), with a focus on 2025 (Base Year and Estimated Year), and forecasting to 2033 (Forecast Period), this report leverages historical data from 2019-2024 (Historical Period) to paint a clear picture of current market dynamics and future trends. The report delves into market segmentation, key players, technological advancements, and growth drivers, providing actionable intelligence for navigating this rapidly evolving landscape.
Asia-Pacific Physical Security Market Structure & Innovation Trends
The Asia-Pacific physical security market exhibits a moderately consolidated structure, with several key players commanding significant market share. Companies like Hangzhou Hikvision Digital Technology Co Ltd, Dahua Technology Co Ltd, and Bosch Security Systems GmbH hold prominent positions, driven by their extensive product portfolios and robust distribution networks. However, the market also accommodates numerous smaller, specialized players, particularly in niche segments. The market share of the top 5 players is estimated to be approximately xx%.
Innovation is a crucial driver, fueled by advancements in artificial intelligence (AI), Internet of Things (IoT), and cloud computing. These technologies are enhancing security systems with capabilities like facial recognition, predictive analytics, and remote management. Regulatory frameworks, varying across countries in the region, significantly influence market dynamics. For instance, stricter data privacy regulations are driving demand for secure and compliant solutions. The prevalence of product substitutes, such as advanced surveillance technologies, presents ongoing competitive pressures. The end-user demographic is diverse, encompassing governments, enterprises, critical infrastructure sectors, and residential users. Mergers and acquisitions (M&A) activity remains robust, with deal values reaching xx Million in the last 5 years, reflecting consolidation and expansion strategies among key players. Examples include strategic acquisitions to expand product lines or geographical reach.
Asia-Pacific Physical Security Market Dynamics & Trends
The Asia-Pacific physical security market is experiencing robust growth, driven by increasing urbanization, rising crime rates, and heightened concerns over national security. The market is expected to register a Compound Annual Growth Rate (CAGR) of xx% during the forecast period (2025-2033). This growth is further fueled by technological advancements such as AI-powered video analytics, cloud-based security solutions, and biometrics. These technologies are transforming the industry, leading to higher market penetration of advanced security solutions. However, factors like economic fluctuations and regional political instability can influence the market’s trajectory. Consumer preferences are shifting towards integrated, user-friendly, and cost-effective systems. Competitive dynamics are intense, with companies investing heavily in R&D, strategic partnerships, and M&A activities to gain a competitive edge. The market penetration of advanced security solutions is steadily increasing, particularly in urban centers and high-security environments.
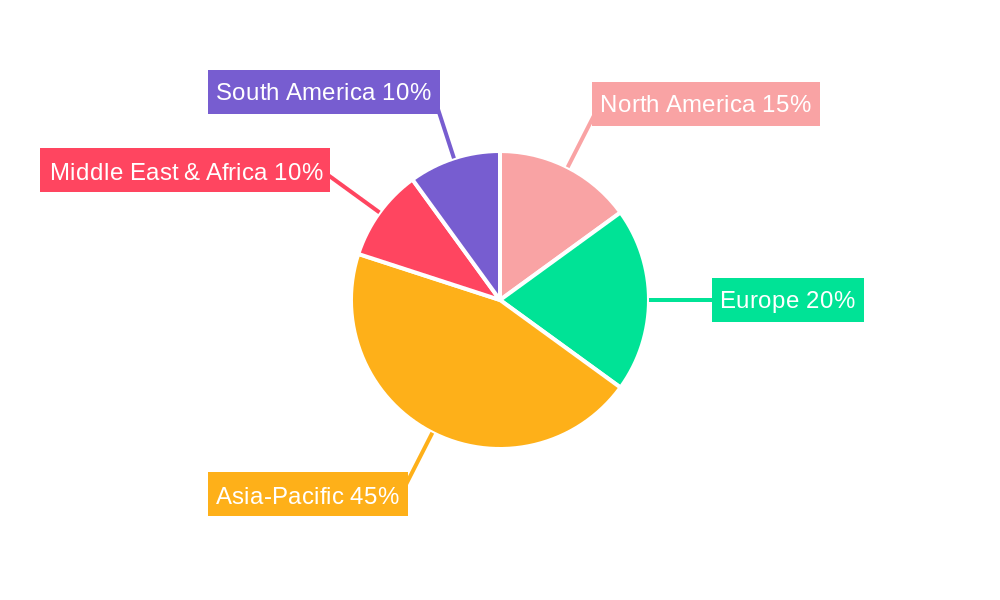
Dominant Regions & Segments in Asia-Pacific Physical Security Market
China and India currently dominate the Asia-Pacific physical security market, driven by rapid economic growth, substantial infrastructure development, and expanding surveillance networks.
- Key Drivers in China: Strong government initiatives, substantial investments in security infrastructure, and a large market for both commercial and residential security solutions.
- Key Drivers in India: Increasing urbanization, heightened security concerns, and a burgeoning IT and technology sector.
- Other Significant Markets: Japan, South Korea, Australia, and Singapore also contribute significantly to the regional market.
Detailed dominance analysis reveals that China's robust economic growth and government focus on public safety are significant factors contributing to its leading position. This includes the massive investment in smart city infrastructure, which involves the large-scale deployment of surveillance technologies. India’s rapidly growing economy and substantial infrastructural development projects further fuel demand.
Asia-Pacific Physical Security Market Product Innovations
Recent product innovations include touchless access control systems, AI-powered video analytics platforms, and integrated security management software. These advancements are enhancing security effectiveness, user convenience, and operational efficiency. The market is witnessing a significant shift towards cloud-based solutions, offering scalability, remote management capabilities, and reduced infrastructure costs. These product developments cater to evolving security needs and enhance the overall value proposition for users, leading to increased market penetration.
Report Scope & Segmentation Analysis
This report provides a comprehensive segmentation analysis of the Asia-Pacific physical security market. This includes a detailed breakdown by product type (e.g., video surveillance, access control, intrusion detection), end-user (e.g., government, commercial, residential), and geography (e.g., country-specific analysis). Each segment's growth projections, market sizes, and competitive dynamics are meticulously analyzed, providing a granular understanding of the market’s diverse landscape.
Key Drivers of Asia-Pacific Physical Security Market Growth
Several key factors fuel the growth of the Asia-Pacific physical security market. These include:
- Technological Advancements: The integration of AI, IoT, and cloud computing into security solutions is enhancing efficiency and capabilities.
- Rising Urbanization: The rapid growth of urban centers necessitates robust security measures.
- Increased Security Concerns: Rising crime rates and the threat of terrorism are driving demand for enhanced security.
- Government Initiatives: Several governments are implementing smart city initiatives that incorporate advanced security systems.
Challenges in the Asia-Pacific Physical Security Market Sector
The Asia-Pacific physical security market faces challenges, including:
- Regulatory Hurdles: Varying regulations across countries can create complexities in market entry and operations.
- Supply Chain Issues: Disruptions in the global supply chain can impact the availability and cost of security products.
- Competitive Pressures: The market's intense competition requires continuous innovation and cost optimization.
Emerging Opportunities in Asia-Pacific Physical Security Market
Emerging opportunities include:
- Smart City Initiatives: The expansion of smart cities creates significant demand for advanced security solutions.
- Growth of IoT Devices: The proliferation of IoT devices creates new opportunities for integrated security management systems.
- Demand for Cloud-Based Solutions: Cloud-based solutions offer scalability and cost-effectiveness, fueling market growth.
Leading Players in the Asia-Pacific Physical Security Market Market
- Bosch Security Systems GmbH
- Dahua Technology Co Ltd
- Genetec Inc
- Honeywell International Inc
- Hangzhou Hikvision Digital Technology Co Ltd
- Johnson Controls
- HID Global Corporation
- Axis Communications AB
- NEC Corporation
- Schneider Electric
- Hanwha Group
Key Developments in Asia-Pacific Physical Security Market Industry
- March 2023: Genetec partnered with Axis Communications to launch "Axis Powered by Genetec," a comprehensive access control solution.
- April 2023: Dahua released a Touchless Insider Series access control solution, enhancing convenience and security.
- August 2023: Verkada expanded into South Korea, establishing a new office in Seoul to cater to growing demand for cloud-based solutions.
Future Outlook for Asia-Pacific Physical Security Market Market
The Asia-Pacific physical security market is poised for continued growth, driven by technological innovation, increasing urbanization, and heightened security concerns. Strategic partnerships, acquisitions, and investments in R&D will play a crucial role in shaping future market dynamics. The market’s future potential lies in the adoption of advanced technologies, focus on integrated solutions, and expansion into new markets within the region. The continued growth of smart cities and related infrastructure projects will further drive demand for sophisticated security systems.
Asia-Pacific Physical Security Market Segmentation
-
1. System Type
-
1.1. Video Surveillance System
- 1.1.1. IP Surveillance
- 1.1.2. Analog Surveillance
- 1.1.3. Hybrid Surveillance
- 1.2. Physical Access Control System (PACS)
- 1.3. Biometric System
- 1.4. Perimeter Security
- 1.5. Intrusion Detection
-
1.1. Video Surveillance System
-
2. Service Type
- 2.1. Access Control-as-a-Service (ACaaS)
- 2.2. Video Surveillance-as-a-Service (VSaaS)
-
3. Type of Deployment
- 3.1. On-premises
- 3.2. Cloud
-
4. Organization Size
- 4.1. SMEs
- 4.2. Large Enterprises
-
5. End-user Industry
- 5.1. Government Services
- 5.2. Banking and Financial Services
- 5.3. IT and Telecommunications
- 5.4. Transportation and Logistics
- 5.5. Retail
- 5.6. Healthcare
- 5.7. Residential
- 5.8. Other End-user Industries
Asia-Pacific Physical Security Market Segmentation By Geography
-
1. Asia Pacific
- 1.1. China
- 1.2. Japan
- 1.3. South Korea
- 1.4. India
- 1.5. Australia
- 1.6. New Zealand
- 1.7. Indonesia
- 1.8. Malaysia
- 1.9. Singapore
- 1.10. Thailand
- 1.11. Vietnam
- 1.12. Philippines
Asia-Pacific Physical Security Market REPORT HIGHLIGHTS
| Aspects | Details |
|---|---|
| Study Period | 2019-2033 |
| Base Year | 2024 |
| Estimated Year | 2025 |
| Forecast Period | 2025-2033 |
| Historical Period | 2019-2024 |
| Growth Rate | CAGR of 7.10% from 2019-2033 |
| Segmentation |
|
Table of Contents
- 1. Introduction
- 1.1. Research Scope
- 1.2. Market Segmentation
- 1.3. Research Methodology
- 1.4. Definitions and Assumptions
- 2. Executive Summary
- 2.1. Introduction
- 3. Market Dynamics
- 3.1. Introduction
- 3.2. Market Drivers
- 3.2.1. Increasing Recognition of Physical Security Systems; Rising Adoption of IP-Based Cameras for Video Monitoring; Integration of AI and Video Analytics into Physical Security Systems for Enhanced Effectiveness
- 3.3. Market Restrains
- 3.3.1. Increasing Recognition of Physical Security Systems; Rising Adoption of IP-Based Cameras for Video Monitoring; Integration of AI and Video Analytics into Physical Security Systems for Enhanced Effectiveness
- 3.4. Market Trends
- 3.4.1. Video Surveillance Systems Are Expected to Hold a Significant Market Share
- 4. Market Factor Analysis
- 4.1. Porters Five Forces
- 4.2. Supply/Value Chain
- 4.3. PESTEL analysis
- 4.4. Market Entropy
- 4.5. Patent/Trademark Analysis
- 5. Asia-Pacific Physical Security Market Analysis, Insights and Forecast, 2019-2031
- 5.1. Market Analysis, Insights and Forecast - by System Type
- 5.1.1. Video Surveillance System
- 5.1.1.1. IP Surveillance
- 5.1.1.2. Analog Surveillance
- 5.1.1.3. Hybrid Surveillance
- 5.1.2. Physical Access Control System (PACS)
- 5.1.3. Biometric System
- 5.1.4. Perimeter Security
- 5.1.5. Intrusion Detection
- 5.1.1. Video Surveillance System
- 5.2. Market Analysis, Insights and Forecast - by Service Type
- 5.2.1. Access Control-as-a-Service (ACaaS)
- 5.2.2. Video Surveillance-as-a-Service (VSaaS)
- 5.3. Market Analysis, Insights and Forecast - by Type of Deployment
- 5.3.1. On-premises
- 5.3.2. Cloud
- 5.4. Market Analysis, Insights and Forecast - by Organization Size
- 5.4.1. SMEs
- 5.4.2. Large Enterprises
- 5.5. Market Analysis, Insights and Forecast - by End-user Industry
- 5.5.1. Government Services
- 5.5.2. Banking and Financial Services
- 5.5.3. IT and Telecommunications
- 5.5.4. Transportation and Logistics
- 5.5.5. Retail
- 5.5.6. Healthcare
- 5.5.7. Residential
- 5.5.8. Other End-user Industries
- 5.6. Market Analysis, Insights and Forecast - by Region
- 5.6.1. Asia Pacific
- 5.1. Market Analysis, Insights and Forecast - by System Type
- 6. Competitive Analysis
- 6.1. Market Share Analysis 2024
- 6.2. Company Profiles
- 6.2.1 Bosch Security Systems GmbH
- 6.2.1.1. Overview
- 6.2.1.2. Products
- 6.2.1.3. SWOT Analysis
- 6.2.1.4. Recent Developments
- 6.2.1.5. Financials (Based on Availability)
- 6.2.2 Dahua Technology Co Ltd
- 6.2.2.1. Overview
- 6.2.2.2. Products
- 6.2.2.3. SWOT Analysis
- 6.2.2.4. Recent Developments
- 6.2.2.5. Financials (Based on Availability)
- 6.2.3 Genetec Inc
- 6.2.3.1. Overview
- 6.2.3.2. Products
- 6.2.3.3. SWOT Analysis
- 6.2.3.4. Recent Developments
- 6.2.3.5. Financials (Based on Availability)
- 6.2.4 Honeywell International Inc
- 6.2.4.1. Overview
- 6.2.4.2. Products
- 6.2.4.3. SWOT Analysis
- 6.2.4.4. Recent Developments
- 6.2.4.5. Financials (Based on Availability)
- 6.2.5 Hangzhou Hikvision Digital Technology Co Ltd
- 6.2.5.1. Overview
- 6.2.5.2. Products
- 6.2.5.3. SWOT Analysis
- 6.2.5.4. Recent Developments
- 6.2.5.5. Financials (Based on Availability)
- 6.2.6 Johnson Controls
- 6.2.6.1. Overview
- 6.2.6.2. Products
- 6.2.6.3. SWOT Analysis
- 6.2.6.4. Recent Developments
- 6.2.6.5. Financials (Based on Availability)
- 6.2.7 HID Global Corporation
- 6.2.7.1. Overview
- 6.2.7.2. Products
- 6.2.7.3. SWOT Analysis
- 6.2.7.4. Recent Developments
- 6.2.7.5. Financials (Based on Availability)
- 6.2.8 Axis Communications AB
- 6.2.8.1. Overview
- 6.2.8.2. Products
- 6.2.8.3. SWOT Analysis
- 6.2.8.4. Recent Developments
- 6.2.8.5. Financials (Based on Availability)
- 6.2.9 NEC Corporation
- 6.2.9.1. Overview
- 6.2.9.2. Products
- 6.2.9.3. SWOT Analysis
- 6.2.9.4. Recent Developments
- 6.2.9.5. Financials (Based on Availability)
- 6.2.10 Schneider Electric
- 6.2.10.1. Overview
- 6.2.10.2. Products
- 6.2.10.3. SWOT Analysis
- 6.2.10.4. Recent Developments
- 6.2.10.5. Financials (Based on Availability)
- 6.2.11 Hanwha Grou
- 6.2.11.1. Overview
- 6.2.11.2. Products
- 6.2.11.3. SWOT Analysis
- 6.2.11.4. Recent Developments
- 6.2.11.5. Financials (Based on Availability)
- 6.2.1 Bosch Security Systems GmbH
List of Figures
- Figure 1: Asia-Pacific Physical Security Market Revenue Breakdown (Million, %) by Product 2024 & 2032
- Figure 2: Asia-Pacific Physical Security Market Share (%) by Company 2024
List of Tables
- Table 1: Asia-Pacific Physical Security Market Revenue Million Forecast, by Region 2019 & 2032
- Table 2: Asia-Pacific Physical Security Market Volume Billion Forecast, by Region 2019 & 2032
- Table 3: Asia-Pacific Physical Security Market Revenue Million Forecast, by System Type 2019 & 2032
- Table 4: Asia-Pacific Physical Security Market Volume Billion Forecast, by System Type 2019 & 2032
- Table 5: Asia-Pacific Physical Security Market Revenue Million Forecast, by Service Type 2019 & 2032
- Table 6: Asia-Pacific Physical Security Market Volume Billion Forecast, by Service Type 2019 & 2032
- Table 7: Asia-Pacific Physical Security Market Revenue Million Forecast, by Type of Deployment 2019 & 2032
- Table 8: Asia-Pacific Physical Security Market Volume Billion Forecast, by Type of Deployment 2019 & 2032
- Table 9: Asia-Pacific Physical Security Market Revenue Million Forecast, by Organization Size 2019 & 2032
- Table 10: Asia-Pacific Physical Security Market Volume Billion Forecast, by Organization Size 2019 & 2032
- Table 11: Asia-Pacific Physical Security Market Revenue Million Forecast, by End-user Industry 2019 & 2032
- Table 12: Asia-Pacific Physical Security Market Volume Billion Forecast, by End-user Industry 2019 & 2032
- Table 13: Asia-Pacific Physical Security Market Revenue Million Forecast, by Region 2019 & 2032
- Table 14: Asia-Pacific Physical Security Market Volume Billion Forecast, by Region 2019 & 2032
- Table 15: Asia-Pacific Physical Security Market Revenue Million Forecast, by System Type 2019 & 2032
- Table 16: Asia-Pacific Physical Security Market Volume Billion Forecast, by System Type 2019 & 2032
- Table 17: Asia-Pacific Physical Security Market Revenue Million Forecast, by Service Type 2019 & 2032
- Table 18: Asia-Pacific Physical Security Market Volume Billion Forecast, by Service Type 2019 & 2032
- Table 19: Asia-Pacific Physical Security Market Revenue Million Forecast, by Type of Deployment 2019 & 2032
- Table 20: Asia-Pacific Physical Security Market Volume Billion Forecast, by Type of Deployment 2019 & 2032
- Table 21: Asia-Pacific Physical Security Market Revenue Million Forecast, by Organization Size 2019 & 2032
- Table 22: Asia-Pacific Physical Security Market Volume Billion Forecast, by Organization Size 2019 & 2032
- Table 23: Asia-Pacific Physical Security Market Revenue Million Forecast, by End-user Industry 2019 & 2032
- Table 24: Asia-Pacific Physical Security Market Volume Billion Forecast, by End-user Industry 2019 & 2032
- Table 25: Asia-Pacific Physical Security Market Revenue Million Forecast, by Country 2019 & 2032
- Table 26: Asia-Pacific Physical Security Market Volume Billion Forecast, by Country 2019 & 2032
- Table 27: China Asia-Pacific Physical Security Market Revenue (Million) Forecast, by Application 2019 & 2032
- Table 28: China Asia-Pacific Physical Security Market Volume (Billion) Forecast, by Application 2019 & 2032
- Table 29: Japan Asia-Pacific Physical Security Market Revenue (Million) Forecast, by Application 2019 & 2032
- Table 30: Japan Asia-Pacific Physical Security Market Volume (Billion) Forecast, by Application 2019 & 2032
- Table 31: South Korea Asia-Pacific Physical Security Market Revenue (Million) Forecast, by Application 2019 & 2032
- Table 32: South Korea Asia-Pacific Physical Security Market Volume (Billion) Forecast, by Application 2019 & 2032
- Table 33: India Asia-Pacific Physical Security Market Revenue (Million) Forecast, by Application 2019 & 2032
- Table 34: India Asia-Pacific Physical Security Market Volume (Billion) Forecast, by Application 2019 & 2032
- Table 35: Australia Asia-Pacific Physical Security Market Revenue (Million) Forecast, by Application 2019 & 2032
- Table 36: Australia Asia-Pacific Physical Security Market Volume (Billion) Forecast, by Application 2019 & 2032
- Table 37: New Zealand Asia-Pacific Physical Security Market Revenue (Million) Forecast, by Application 2019 & 2032
- Table 38: New Zealand Asia-Pacific Physical Security Market Volume (Billion) Forecast, by Application 2019 & 2032
- Table 39: Indonesia Asia-Pacific Physical Security Market Revenue (Million) Forecast, by Application 2019 & 2032
- Table 40: Indonesia Asia-Pacific Physical Security Market Volume (Billion) Forecast, by Application 2019 & 2032
- Table 41: Malaysia Asia-Pacific Physical Security Market Revenue (Million) Forecast, by Application 2019 & 2032
- Table 42: Malaysia Asia-Pacific Physical Security Market Volume (Billion) Forecast, by Application 2019 & 2032
- Table 43: Singapore Asia-Pacific Physical Security Market Revenue (Million) Forecast, by Application 2019 & 2032
- Table 44: Singapore Asia-Pacific Physical Security Market Volume (Billion) Forecast, by Application 2019 & 2032
- Table 45: Thailand Asia-Pacific Physical Security Market Revenue (Million) Forecast, by Application 2019 & 2032
- Table 46: Thailand Asia-Pacific Physical Security Market Volume (Billion) Forecast, by Application 2019 & 2032
- Table 47: Vietnam Asia-Pacific Physical Security Market Revenue (Million) Forecast, by Application 2019 & 2032
- Table 48: Vietnam Asia-Pacific Physical Security Market Volume (Billion) Forecast, by Application 2019 & 2032
- Table 49: Philippines Asia-Pacific Physical Security Market Revenue (Million) Forecast, by Application 2019 & 2032
- Table 50: Philippines Asia-Pacific Physical Security Market Volume (Billion) Forecast, by Application 2019 & 2032
Frequently Asked Questions
1. What is the projected Compound Annual Growth Rate (CAGR) of the Asia-Pacific Physical Security Market?
The projected CAGR is approximately 7.10%.
2. Which companies are prominent players in the Asia-Pacific Physical Security Market?
Key companies in the market include Bosch Security Systems GmbH, Dahua Technology Co Ltd, Genetec Inc, Honeywell International Inc, Hangzhou Hikvision Digital Technology Co Ltd, Johnson Controls, HID Global Corporation, Axis Communications AB, NEC Corporation, Schneider Electric, Hanwha Grou.
3. What are the main segments of the Asia-Pacific Physical Security Market?
The market segments include System Type, Service Type, Type of Deployment, Organization Size, End-user Industry.
4. Can you provide details about the market size?
The market size is estimated to be USD 39.45 Million as of 2022.
5. What are some drivers contributing to market growth?
Increasing Recognition of Physical Security Systems; Rising Adoption of IP-Based Cameras for Video Monitoring; Integration of AI and Video Analytics into Physical Security Systems for Enhanced Effectiveness.
6. What are the notable trends driving market growth?
Video Surveillance Systems Are Expected to Hold a Significant Market Share.
7. Are there any restraints impacting market growth?
Increasing Recognition of Physical Security Systems; Rising Adoption of IP-Based Cameras for Video Monitoring; Integration of AI and Video Analytics into Physical Security Systems for Enhanced Effectiveness.
8. Can you provide examples of recent developments in the market?
August 2023: Verkada, a prominent enterprise-building security and management solutions provider, announced its expansion into South Korea. To better serve the increasing demand for advanced cloud-based physical security solutions, the company announced the opening of a new office in Seoul. Its products include video security cameras, door-based access control, environmental sensors, alarms, intercom systems, and workplace management tools. These offerings work together seamlessly to deliver unmatched building security via a highly secure and integrated cloud-based software platform.
9. What pricing options are available for accessing the report?
Pricing options include single-user, multi-user, and enterprise licenses priced at USD 4750, USD 4950, and USD 6800 respectively.
10. Is the market size provided in terms of value or volume?
The market size is provided in terms of value, measured in Million and volume, measured in Billion.
11. Are there any specific market keywords associated with the report?
Yes, the market keyword associated with the report is "Asia-Pacific Physical Security Market," which aids in identifying and referencing the specific market segment covered.
12. How do I determine which pricing option suits my needs best?
The pricing options vary based on user requirements and access needs. Individual users may opt for single-user licenses, while businesses requiring broader access may choose multi-user or enterprise licenses for cost-effective access to the report.
13. Are there any additional resources or data provided in the Asia-Pacific Physical Security Market report?
While the report offers comprehensive insights, it's advisable to review the specific contents or supplementary materials provided to ascertain if additional resources or data are available.
14. How can I stay updated on further developments or reports in the Asia-Pacific Physical Security Market?
To stay informed about further developments, trends, and reports in the Asia-Pacific Physical Security Market, consider subscribing to industry newsletters, following relevant companies and organizations, or regularly checking reputable industry news sources and publications.
Methodology
Step 1 - Identification of Relevant Samples Size from Population Database


Step 2 - Approaches for Defining Global Market Size (Value, Volume* & Price*)

Note*: In applicable scenarios
Step 3 - Data Sources
Primary Research
- Web Analytics
- Survey Reports
- Research Institute
- Latest Research Reports
- Opinion Leaders
Secondary Research
- Annual Reports
- White Paper
- Latest Press Release
- Industry Association
- Paid Database
- Investor Presentations

Step 4 - Data Triangulation
Involves using different sources of information in order to increase the validity of a study
These sources are likely to be stakeholders in a program - participants, other researchers, program staff, other community members, and so on.
Then we put all data in single framework & apply various statistical tools to find out the dynamic on the market.
During the analysis stage, feedback from the stakeholder groups would be compared to determine areas of agreement as well as areas of divergence


