
Key Insights
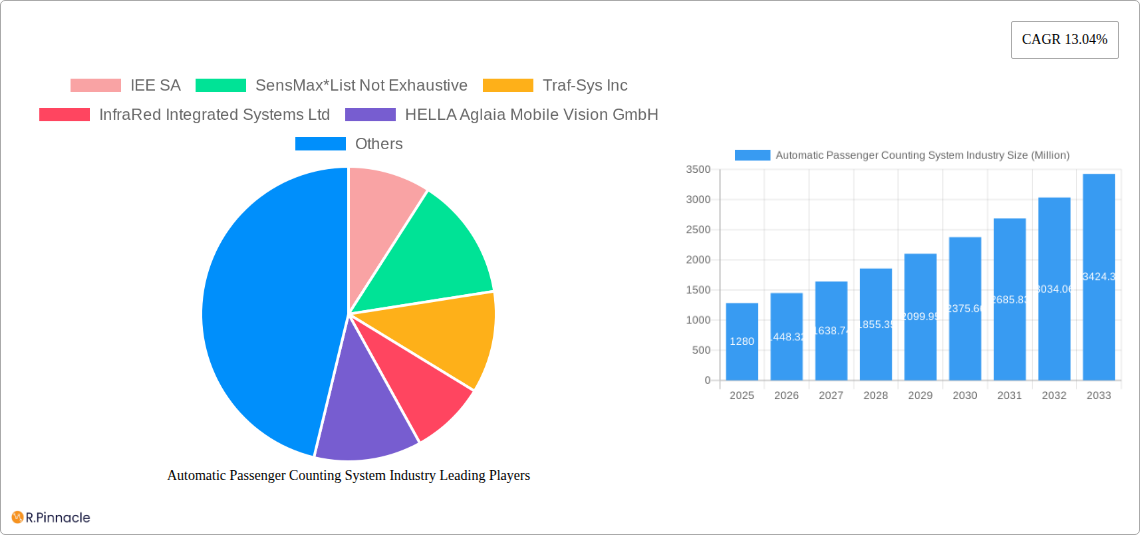
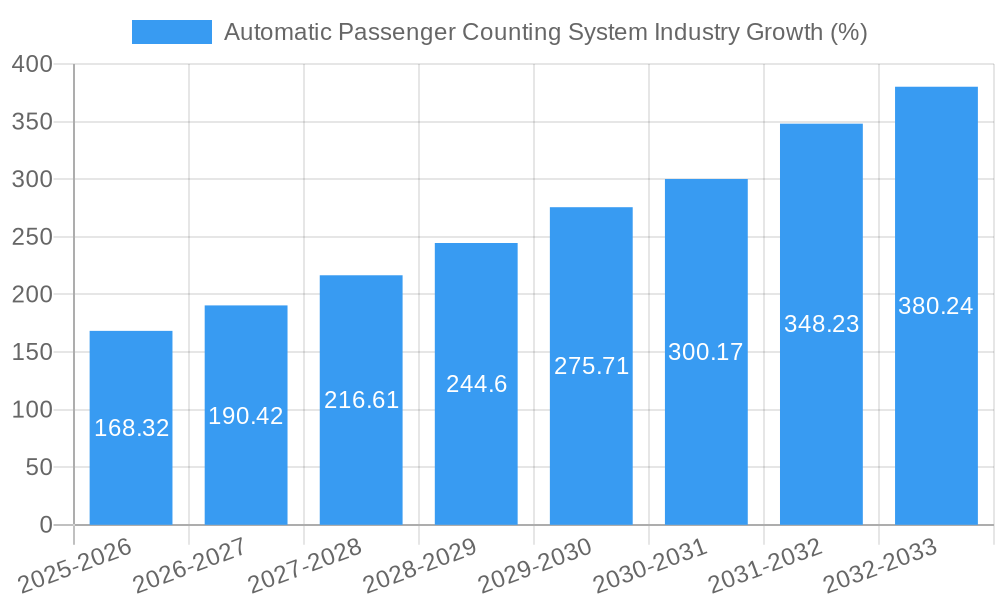
The Automatic Passenger Counting System (APCS) market is experiencing robust growth, projected to reach $1.28 billion in 2025 and maintain a Compound Annual Growth Rate (CAGR) of 13.04% from 2025 to 2033. This expansion is driven by several key factors. Increasing urbanization and the consequent rise in public transportation ridership necessitate efficient passenger flow management and operational optimization. Furthermore, the growing demand for enhanced security and safety measures in transportation hubs and public spaces fuels the adoption of APCS solutions. The need for accurate data-driven insights for improved infrastructure planning and resource allocation also contributes significantly to market growth. Technological advancements, such as the integration of AI and IoT capabilities into APCS, are further enhancing the accuracy, reliability, and analytical capabilities of these systems, expanding their applications across various sectors. The market is segmented by type (hardware, software & services) and end-user application (hospitality, retail, transportation, BFSI, sports & entertainment, and others). The transportation sector currently holds the largest market share, followed by retail, driven by the need for optimized resource allocation and enhanced customer experience. Geographical expansion, particularly in developing economies with burgeoning infrastructure development, presents significant opportunities for market players. However, high initial investment costs and the need for regular maintenance and updates could pose challenges to market growth. Competitive pressures and the constant need for technological innovation also characterize the market landscape.
The competitive landscape includes established players like IEE SA, SensMax, Traf-Sys Inc., InfraRed Integrated Systems Ltd., HELLA Aglaia Mobile Vision GmbH, Eurotech SPA, ShopperTrak, Iris GmbH, Axis Communications AB, RetailNext Inc., and FLIR Systems Inc., each vying for market share through product differentiation and strategic partnerships. Future growth will depend on leveraging advanced technologies like computer vision, big data analytics, and cloud computing to deliver comprehensive and actionable insights to clients across diverse sectors. Continuous innovation in system design, improved accuracy and reliability, and a focus on user-friendly interfaces will be crucial for continued market success in the coming years. The APCS market is poised for significant expansion, driven by the increasing need for efficient passenger management and data-driven decision-making across various sectors.
Automatic Passenger Counting System Industry Report: 2019-2033
This comprehensive report provides a detailed analysis of the Automatic Passenger Counting System (APCS) industry, offering invaluable insights for industry professionals, investors, and strategic decision-makers. The report covers the period 2019-2033, with a focus on the estimated year 2025 and a forecast period of 2025-2033. The market is segmented by type (Hardware, Software & Services) and end-user application (Hospitality, Retail, Transportation, BFSI, Sports & Entertainment, Other End-user Applications). Key players analyzed include IEE SA, SensMax, Traf-Sys Inc, InfraRed Integrated Systems Ltd, HELLA Aglaia Mobile Vision GmbH, Eurotech SPA, ShopperTrak, Iris GmbH, Axis Communications AB, RetailNext Inc, and FLIR Systems Inc. The report projects a xx Million market size by 2033, driven by significant technological advancements and increasing adoption across diverse sectors.
Automatic Passenger Counting System Industry Market Structure & Innovation Trends
The APCS market exhibits a moderately consolidated structure, with key players holding significant market share. While precise market share figures for each company are proprietary and confidential, IEE SA, SensMax, and Traf-Sys Inc are estimated to collectively hold a xx% market share in 2025. This concentration is influenced by factors such as high entry barriers (significant R&D investments) and the need for specialized expertise in sensor technology and data analytics. Innovation drivers include the rising demand for real-time passenger data for operational efficiency and improved security, along with advancements in AI-powered analytics. Regulatory frameworks, such as data privacy regulations, significantly impact market dynamics. M&A activities within the past five years indicate a growing trend of consolidation, with deal values reaching an estimated xx Million.
- Market Concentration: Moderately consolidated, with key players holding significant share.
- Innovation Drivers: Demand for real-time data, AI-powered analytics, and improved security measures.
- Regulatory Frameworks: Data privacy regulations influence market growth.
- M&A Activity: Significant consolidation observed, with deal values estimated at xx Million over the past five years.
- Product Substitutes: Limited direct substitutes exist, but manual counting methods remain a less efficient alternative.
Automatic Passenger Counting System Industry Market Dynamics & Trends
The APCS market is experiencing robust growth, with a projected Compound Annual Growth Rate (CAGR) of xx% from 2025 to 2033. This growth is primarily driven by the increasing adoption of APCS across various sectors. Technological advancements, such as the integration of AI and IoT capabilities, are improving system accuracy, reliability, and data analytics. Consumer preferences for seamless and efficient travel experiences and increasing focus on improved safety and security measures are also propelling market expansion. Competitive dynamics are characterized by a combination of both cooperation and competition, as companies seek strategic partnerships and alliances to expand market reach and enhance product offerings. Market penetration varies across segments and regions, with the transportation sector showing higher adoption rates.
Dominant Regions & Segments in Automatic Passenger Counting System Industry
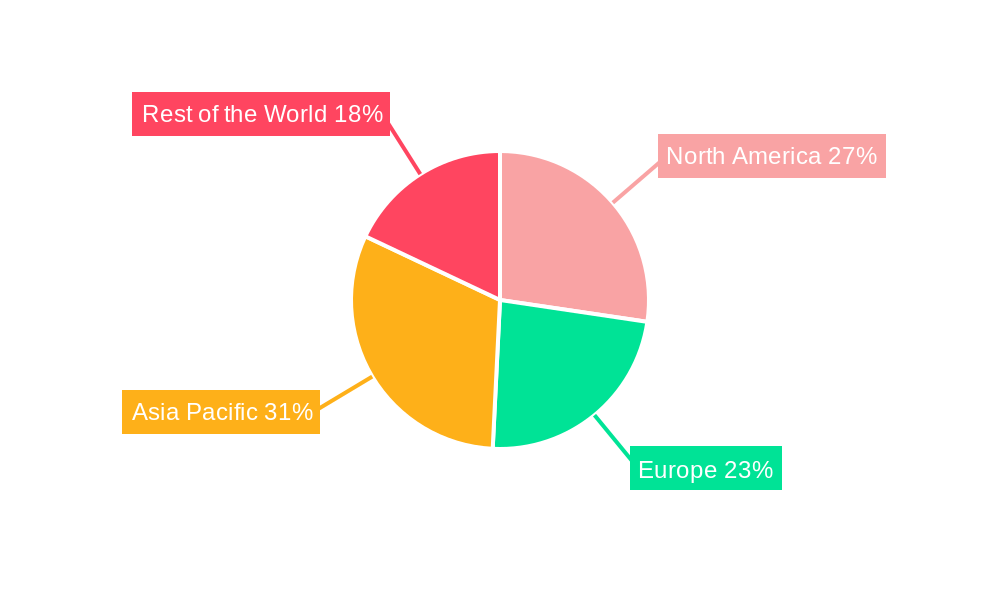
The Transportation sector dominates the APCS market, accounting for approximately xx% of the total market share in 2025. This is primarily due to the increasing demand for real-time passenger data for optimized scheduling, capacity planning, and improved passenger flow management. North America and Europe are currently the leading regions, driven by advanced infrastructure development, stringent safety regulations, and high adoption rates in public transportation systems.
Key Drivers:
- Transportation: Demand for optimized scheduling, capacity planning, and improved passenger flow management.
- Retail: Focus on improving customer experience, enhancing inventory management, and optimizing staffing.
- North America: Advanced infrastructure, stringent safety regulations, and high adoption rates in public transport.
- Europe: Similar to North America, with a focus on smart cities and public transport improvements.
The Hardware segment currently dominates the APCS market by type, driven by continued demand for advanced sensors and counting devices. However, the Software & Services segment is expected to witness faster growth due to the growing need for data analytics and customized solutions.
Automatic Passenger Counting System Industry Product Innovations
Recent product innovations focus on integrating advanced sensor technologies (e.g., 3D sensors, LiDAR), AI-powered analytics for real-time insights, and cloud-based data management for enhanced scalability and accessibility. These advancements enhance the accuracy and efficiency of passenger counting, leading to improved operational efficiency and better decision-making for various industries. New product features such as facial recognition for passenger identification and integration with other smart city technologies are also gaining traction. Companies are focusing on developing user-friendly interfaces and customized solutions to cater to specific market needs.
Report Scope & Segmentation Analysis
This report analyzes the APCS market based on the following segmentations:
By Type:
- Hardware: Includes sensors, counters, and related hardware components. The market size in 2025 is estimated at xx Million, with projected growth driven by technological advancements and increasing demand.
- Software & Services: Includes data analytics platforms, software applications, and related services. Expected to exhibit faster growth than the hardware segment due to the increasing value placed on data-driven insights. The market size in 2025 is projected at xx Million.
By End-user Application:
- Transportation: Dominates the market due to high adoption rates in public transportation and the demand for efficient operations.
- Retail: Growing steadily as businesses seek to optimize customer experience and improve store operations.
- Hospitality: Growing segment driven by the need for optimized occupancy management and improved customer service.
- BFSI (Banking, Financial Services, and Insurance): Relatively smaller segment, but showing increasing adoption for improved security and crowd management.
- Sports & Entertainment: Growing segment due to increased focus on improving crowd management and safety in large venues.
- Other End-user Applications: Includes applications in healthcare, education, and other sectors.
Each segment displays unique growth trajectories and competitive landscapes, influenced by specific industry drivers and challenges.
Key Drivers of Automatic Passenger Counting System Industry Growth
The APCS market's growth is fueled by several factors: the increasing demand for real-time data for improved operational efficiency, the rising need for enhanced security and safety measures, the widespread adoption of smart city initiatives, and technological advancements such as AI and IoT. Government regulations promoting smart transportation systems also drive the adoption of APCS.
Challenges in the Automatic Passenger Counting System Industry Sector
Key challenges include the high initial investment costs for implementing APCS, potential data privacy concerns, the need for robust and reliable infrastructure to support data transmission, and the competitive landscape with various players vying for market share. Supply chain disruptions can also impact the availability and cost of components. Integration complexities with existing systems pose another challenge.
Emerging Opportunities in Automatic Passenger Counting System Industry
Emerging opportunities lie in the integration of APCS with other smart city technologies, the development of more sophisticated analytics capabilities for predictive maintenance and improved decision-making, and expansion into new markets such as healthcare and education. The demand for contactless solutions due to hygiene concerns will also present significant opportunities.
Leading Players in the Automatic Passenger Counting System Industry Market
- IEE SA
- SensMax
- Traf-Sys Inc
- InfraRed Integrated Systems Ltd
- HELLA Aglaia Mobile Vision GmbH
- Eurotech SPA
- ShopperTrak
- Iris GmbH
- Axis Communications AB
- RetailNext Inc
- FLIR Systems Inc
Key Developments in Automatic Passenger Counting System Industry
- 2023: IEE SA launches a new AI-powered APCS solution.
- 2022: SensMax and Traf-Sys Inc announce a strategic partnership.
- 2021: HELLA Aglaia Mobile Vision GmbH releases an updated version of its APCS software with enhanced analytics capabilities.
- 2020: InfraRed Integrated Systems Ltd secured a major contract for APCS deployment in a large transportation hub.
(Note: Further developments and specific dates require more in-depth market research)
Future Outlook for Automatic Passenger Counting System Industry Market
The APCS market is poised for substantial growth, driven by technological innovation, increasing demand for efficient and secure solutions, and the ongoing expansion of smart cities globally. Strategic partnerships and technological advancements are expected to shape the future landscape. Continued focus on data analytics and improved integration with other technologies will create further opportunities for market expansion and innovation.
Automatic Passenger Counting System Industry Segmentation
-
1. Type
- 1.1. Hardware
- 1.2. Software & Services
-
2. End-user Application
- 2.1. Hospitality
- 2.2. Retail
- 2.3. Transportation
- 2.4. BFSI
- 2.5. Sports & Entertainment
- 2.6. Other End-user Applications
Automatic Passenger Counting System Industry Segmentation By Geography
-
1. North America
- 1.1. United States
- 1.2. Canada
-
2. Europe
- 2.1. United Kingdom
- 2.2. Germany
- 2.3. France
- 2.4. Italy
- 2.5. Rest of Europe
-
3. Asia Pacific
- 3.1. China
- 3.2. Japan
- 3.3. India
- 3.4. Australia
- 3.5. Rest of Asia Pacific
-
4. Rest of the World
- 4.1. Latin America
- 4.2. Middle East
Automatic Passenger Counting System Industry REPORT HIGHLIGHTS
| Aspects | Details |
|---|---|
| Study Period | 2019-2033 |
| Base Year | 2024 |
| Estimated Year | 2025 |
| Forecast Period | 2025-2033 |
| Historical Period | 2019-2024 |
| Growth Rate | CAGR of 13.04% from 2019-2033 |
| Segmentation |
|
Table of Contents
- 1. Introduction
- 1.1. Research Scope
- 1.2. Market Segmentation
- 1.3. Research Methodology
- 1.4. Definitions and Assumptions
- 2. Executive Summary
- 2.1. Introduction
- 3. Market Dynamics
- 3.1. Introduction
- 3.2. Market Drivers
- 3.2.1 ; Security
- 3.2.2 Terrorism and Threats Risks Stimulating Building Security; Integration of IoT and Cloud Services
- 3.3. Market Restrains
- 3.3.1. ; Growth of E-commerce has Negatively Impacted the Market
- 3.4. Market Trends
- 3.4.1. Retail Sector to Dominate the Market
- 4. Market Factor Analysis
- 4.1. Porters Five Forces
- 4.2. Supply/Value Chain
- 4.3. PESTEL analysis
- 4.4. Market Entropy
- 4.5. Patent/Trademark Analysis
- 5. Global Automatic Passenger Counting System Industry Analysis, Insights and Forecast, 2019-2031
- 5.1. Market Analysis, Insights and Forecast - by Type
- 5.1.1. Hardware
- 5.1.2. Software & Services
- 5.2. Market Analysis, Insights and Forecast - by End-user Application
- 5.2.1. Hospitality
- 5.2.2. Retail
- 5.2.3. Transportation
- 5.2.4. BFSI
- 5.2.5. Sports & Entertainment
- 5.2.6. Other End-user Applications
- 5.3. Market Analysis, Insights and Forecast - by Region
- 5.3.1. North America
- 5.3.2. Europe
- 5.3.3. Asia Pacific
- 5.3.4. Rest of the World
- 5.1. Market Analysis, Insights and Forecast - by Type
- 6. North America Automatic Passenger Counting System Industry Analysis, Insights and Forecast, 2019-2031
- 6.1. Market Analysis, Insights and Forecast - by Type
- 6.1.1. Hardware
- 6.1.2. Software & Services
- 6.2. Market Analysis, Insights and Forecast - by End-user Application
- 6.2.1. Hospitality
- 6.2.2. Retail
- 6.2.3. Transportation
- 6.2.4. BFSI
- 6.2.5. Sports & Entertainment
- 6.2.6. Other End-user Applications
- 6.1. Market Analysis, Insights and Forecast - by Type
- 7. Europe Automatic Passenger Counting System Industry Analysis, Insights and Forecast, 2019-2031
- 7.1. Market Analysis, Insights and Forecast - by Type
- 7.1.1. Hardware
- 7.1.2. Software & Services
- 7.2. Market Analysis, Insights and Forecast - by End-user Application
- 7.2.1. Hospitality
- 7.2.2. Retail
- 7.2.3. Transportation
- 7.2.4. BFSI
- 7.2.5. Sports & Entertainment
- 7.2.6. Other End-user Applications
- 7.1. Market Analysis, Insights and Forecast - by Type
- 8. Asia Pacific Automatic Passenger Counting System Industry Analysis, Insights and Forecast, 2019-2031
- 8.1. Market Analysis, Insights and Forecast - by Type
- 8.1.1. Hardware
- 8.1.2. Software & Services
- 8.2. Market Analysis, Insights and Forecast - by End-user Application
- 8.2.1. Hospitality
- 8.2.2. Retail
- 8.2.3. Transportation
- 8.2.4. BFSI
- 8.2.5. Sports & Entertainment
- 8.2.6. Other End-user Applications
- 8.1. Market Analysis, Insights and Forecast - by Type
- 9. Rest of the World Automatic Passenger Counting System Industry Analysis, Insights and Forecast, 2019-2031
- 9.1. Market Analysis, Insights and Forecast - by Type
- 9.1.1. Hardware
- 9.1.2. Software & Services
- 9.2. Market Analysis, Insights and Forecast - by End-user Application
- 9.2.1. Hospitality
- 9.2.2. Retail
- 9.2.3. Transportation
- 9.2.4. BFSI
- 9.2.5. Sports & Entertainment
- 9.2.6. Other End-user Applications
- 9.1. Market Analysis, Insights and Forecast - by Type
- 10. North America Automatic Passenger Counting System Industry Analysis, Insights and Forecast, 2019-2031
- 10.1. Market Analysis, Insights and Forecast - By Country/Sub-region
- 10.1.1 United States
- 10.1.2 Canada
- 11. Europe Automatic Passenger Counting System Industry Analysis, Insights and Forecast, 2019-2031
- 11.1. Market Analysis, Insights and Forecast - By Country/Sub-region
- 11.1.1 United Kingdom
- 11.1.2 Germany
- 11.1.3 France
- 11.1.4 Italy
- 11.1.5 Rest of Europe
- 12. Asia Pacific Automatic Passenger Counting System Industry Analysis, Insights and Forecast, 2019-2031
- 12.1. Market Analysis, Insights and Forecast - By Country/Sub-region
- 12.1.1 China
- 12.1.2 Japan
- 12.1.3 India
- 12.1.4 Australia
- 12.1.5 Rest of Asia Pacific
- 13. Rest of the World Automatic Passenger Counting System Industry Analysis, Insights and Forecast, 2019-2031
- 13.1. Market Analysis, Insights and Forecast - By Country/Sub-region
- 13.1.1 Latin America
- 13.1.2 Middle East
- 14. Competitive Analysis
- 14.1. Global Market Share Analysis 2024
- 14.2. Company Profiles
- 14.2.1 IEE SA
- 14.2.1.1. Overview
- 14.2.1.2. Products
- 14.2.1.3. SWOT Analysis
- 14.2.1.4. Recent Developments
- 14.2.1.5. Financials (Based on Availability)
- 14.2.2 SensMax*List Not Exhaustive
- 14.2.2.1. Overview
- 14.2.2.2. Products
- 14.2.2.3. SWOT Analysis
- 14.2.2.4. Recent Developments
- 14.2.2.5. Financials (Based on Availability)
- 14.2.3 Traf-Sys Inc
- 14.2.3.1. Overview
- 14.2.3.2. Products
- 14.2.3.3. SWOT Analysis
- 14.2.3.4. Recent Developments
- 14.2.3.5. Financials (Based on Availability)
- 14.2.4 InfraRed Integrated Systems Ltd
- 14.2.4.1. Overview
- 14.2.4.2. Products
- 14.2.4.3. SWOT Analysis
- 14.2.4.4. Recent Developments
- 14.2.4.5. Financials (Based on Availability)
- 14.2.5 HELLA Aglaia Mobile Vision GmbH
- 14.2.5.1. Overview
- 14.2.5.2. Products
- 14.2.5.3. SWOT Analysis
- 14.2.5.4. Recent Developments
- 14.2.5.5. Financials (Based on Availability)
- 14.2.6 Eurotech SPA
- 14.2.6.1. Overview
- 14.2.6.2. Products
- 14.2.6.3. SWOT Analysis
- 14.2.6.4. Recent Developments
- 14.2.6.5. Financials (Based on Availability)
- 14.2.7 ShopperTrak
- 14.2.7.1. Overview
- 14.2.7.2. Products
- 14.2.7.3. SWOT Analysis
- 14.2.7.4. Recent Developments
- 14.2.7.5. Financials (Based on Availability)
- 14.2.8 Iris GmbH
- 14.2.8.1. Overview
- 14.2.8.2. Products
- 14.2.8.3. SWOT Analysis
- 14.2.8.4. Recent Developments
- 14.2.8.5. Financials (Based on Availability)
- 14.2.9 Axis Communications AB
- 14.2.9.1. Overview
- 14.2.9.2. Products
- 14.2.9.3. SWOT Analysis
- 14.2.9.4. Recent Developments
- 14.2.9.5. Financials (Based on Availability)
- 14.2.10 RetailNext Inc
- 14.2.10.1. Overview
- 14.2.10.2. Products
- 14.2.10.3. SWOT Analysis
- 14.2.10.4. Recent Developments
- 14.2.10.5. Financials (Based on Availability)
- 14.2.11 FLIR Systems Inc
- 14.2.11.1. Overview
- 14.2.11.2. Products
- 14.2.11.3. SWOT Analysis
- 14.2.11.4. Recent Developments
- 14.2.11.5. Financials (Based on Availability)
- 14.2.1 IEE SA
List of Figures
- Figure 1: Global Automatic Passenger Counting System Industry Revenue Breakdown (Million, %) by Region 2024 & 2032
- Figure 2: North America Automatic Passenger Counting System Industry Revenue (Million), by Country 2024 & 2032
- Figure 3: North America Automatic Passenger Counting System Industry Revenue Share (%), by Country 2024 & 2032
- Figure 4: Europe Automatic Passenger Counting System Industry Revenue (Million), by Country 2024 & 2032
- Figure 5: Europe Automatic Passenger Counting System Industry Revenue Share (%), by Country 2024 & 2032
- Figure 6: Asia Pacific Automatic Passenger Counting System Industry Revenue (Million), by Country 2024 & 2032
- Figure 7: Asia Pacific Automatic Passenger Counting System Industry Revenue Share (%), by Country 2024 & 2032
- Figure 8: Rest of the World Automatic Passenger Counting System Industry Revenue (Million), by Country 2024 & 2032
- Figure 9: Rest of the World Automatic Passenger Counting System Industry Revenue Share (%), by Country 2024 & 2032
- Figure 10: North America Automatic Passenger Counting System Industry Revenue (Million), by Type 2024 & 2032
- Figure 11: North America Automatic Passenger Counting System Industry Revenue Share (%), by Type 2024 & 2032
- Figure 12: North America Automatic Passenger Counting System Industry Revenue (Million), by End-user Application 2024 & 2032
- Figure 13: North America Automatic Passenger Counting System Industry Revenue Share (%), by End-user Application 2024 & 2032
- Figure 14: North America Automatic Passenger Counting System Industry Revenue (Million), by Country 2024 & 2032
- Figure 15: North America Automatic Passenger Counting System Industry Revenue Share (%), by Country 2024 & 2032
- Figure 16: Europe Automatic Passenger Counting System Industry Revenue (Million), by Type 2024 & 2032
- Figure 17: Europe Automatic Passenger Counting System Industry Revenue Share (%), by Type 2024 & 2032
- Figure 18: Europe Automatic Passenger Counting System Industry Revenue (Million), by End-user Application 2024 & 2032
- Figure 19: Europe Automatic Passenger Counting System Industry Revenue Share (%), by End-user Application 2024 & 2032
- Figure 20: Europe Automatic Passenger Counting System Industry Revenue (Million), by Country 2024 & 2032
- Figure 21: Europe Automatic Passenger Counting System Industry Revenue Share (%), by Country 2024 & 2032
- Figure 22: Asia Pacific Automatic Passenger Counting System Industry Revenue (Million), by Type 2024 & 2032
- Figure 23: Asia Pacific Automatic Passenger Counting System Industry Revenue Share (%), by Type 2024 & 2032
- Figure 24: Asia Pacific Automatic Passenger Counting System Industry Revenue (Million), by End-user Application 2024 & 2032
- Figure 25: Asia Pacific Automatic Passenger Counting System Industry Revenue Share (%), by End-user Application 2024 & 2032
- Figure 26: Asia Pacific Automatic Passenger Counting System Industry Revenue (Million), by Country 2024 & 2032
- Figure 27: Asia Pacific Automatic Passenger Counting System Industry Revenue Share (%), by Country 2024 & 2032
- Figure 28: Rest of the World Automatic Passenger Counting System Industry Revenue (Million), by Type 2024 & 2032
- Figure 29: Rest of the World Automatic Passenger Counting System Industry Revenue Share (%), by Type 2024 & 2032
- Figure 30: Rest of the World Automatic Passenger Counting System Industry Revenue (Million), by End-user Application 2024 & 2032
- Figure 31: Rest of the World Automatic Passenger Counting System Industry Revenue Share (%), by End-user Application 2024 & 2032
- Figure 32: Rest of the World Automatic Passenger Counting System Industry Revenue (Million), by Country 2024 & 2032
- Figure 33: Rest of the World Automatic Passenger Counting System Industry Revenue Share (%), by Country 2024 & 2032
List of Tables
- Table 1: Global Automatic Passenger Counting System Industry Revenue Million Forecast, by Region 2019 & 2032
- Table 2: Global Automatic Passenger Counting System Industry Revenue Million Forecast, by Type 2019 & 2032
- Table 3: Global Automatic Passenger Counting System Industry Revenue Million Forecast, by End-user Application 2019 & 2032
- Table 4: Global Automatic Passenger Counting System Industry Revenue Million Forecast, by Region 2019 & 2032
- Table 5: Global Automatic Passenger Counting System Industry Revenue Million Forecast, by Country 2019 & 2032
- Table 6: United States Automatic Passenger Counting System Industry Revenue (Million) Forecast, by Application 2019 & 2032
- Table 7: Canada Automatic Passenger Counting System Industry Revenue (Million) Forecast, by Application 2019 & 2032
- Table 8: Global Automatic Passenger Counting System Industry Revenue Million Forecast, by Country 2019 & 2032
- Table 9: United Kingdom Automatic Passenger Counting System Industry Revenue (Million) Forecast, by Application 2019 & 2032
- Table 10: Germany Automatic Passenger Counting System Industry Revenue (Million) Forecast, by Application 2019 & 2032
- Table 11: France Automatic Passenger Counting System Industry Revenue (Million) Forecast, by Application 2019 & 2032
- Table 12: Italy Automatic Passenger Counting System Industry Revenue (Million) Forecast, by Application 2019 & 2032
- Table 13: Rest of Europe Automatic Passenger Counting System Industry Revenue (Million) Forecast, by Application 2019 & 2032
- Table 14: Global Automatic Passenger Counting System Industry Revenue Million Forecast, by Country 2019 & 2032
- Table 15: China Automatic Passenger Counting System Industry Revenue (Million) Forecast, by Application 2019 & 2032
- Table 16: Japan Automatic Passenger Counting System Industry Revenue (Million) Forecast, by Application 2019 & 2032
- Table 17: India Automatic Passenger Counting System Industry Revenue (Million) Forecast, by Application 2019 & 2032
- Table 18: Australia Automatic Passenger Counting System Industry Revenue (Million) Forecast, by Application 2019 & 2032
- Table 19: Rest of Asia Pacific Automatic Passenger Counting System Industry Revenue (Million) Forecast, by Application 2019 & 2032
- Table 20: Global Automatic Passenger Counting System Industry Revenue Million Forecast, by Country 2019 & 2032
- Table 21: Latin America Automatic Passenger Counting System Industry Revenue (Million) Forecast, by Application 2019 & 2032
- Table 22: Middle East Automatic Passenger Counting System Industry Revenue (Million) Forecast, by Application 2019 & 2032
- Table 23: Global Automatic Passenger Counting System Industry Revenue Million Forecast, by Type 2019 & 2032
- Table 24: Global Automatic Passenger Counting System Industry Revenue Million Forecast, by End-user Application 2019 & 2032
- Table 25: Global Automatic Passenger Counting System Industry Revenue Million Forecast, by Country 2019 & 2032
- Table 26: United States Automatic Passenger Counting System Industry Revenue (Million) Forecast, by Application 2019 & 2032
- Table 27: Canada Automatic Passenger Counting System Industry Revenue (Million) Forecast, by Application 2019 & 2032
- Table 28: Global Automatic Passenger Counting System Industry Revenue Million Forecast, by Type 2019 & 2032
- Table 29: Global Automatic Passenger Counting System Industry Revenue Million Forecast, by End-user Application 2019 & 2032
- Table 30: Global Automatic Passenger Counting System Industry Revenue Million Forecast, by Country 2019 & 2032
- Table 31: United Kingdom Automatic Passenger Counting System Industry Revenue (Million) Forecast, by Application 2019 & 2032
- Table 32: Germany Automatic Passenger Counting System Industry Revenue (Million) Forecast, by Application 2019 & 2032
- Table 33: France Automatic Passenger Counting System Industry Revenue (Million) Forecast, by Application 2019 & 2032
- Table 34: Italy Automatic Passenger Counting System Industry Revenue (Million) Forecast, by Application 2019 & 2032
- Table 35: Rest of Europe Automatic Passenger Counting System Industry Revenue (Million) Forecast, by Application 2019 & 2032
- Table 36: Global Automatic Passenger Counting System Industry Revenue Million Forecast, by Type 2019 & 2032
- Table 37: Global Automatic Passenger Counting System Industry Revenue Million Forecast, by End-user Application 2019 & 2032
- Table 38: Global Automatic Passenger Counting System Industry Revenue Million Forecast, by Country 2019 & 2032
- Table 39: China Automatic Passenger Counting System Industry Revenue (Million) Forecast, by Application 2019 & 2032
- Table 40: Japan Automatic Passenger Counting System Industry Revenue (Million) Forecast, by Application 2019 & 2032
- Table 41: India Automatic Passenger Counting System Industry Revenue (Million) Forecast, by Application 2019 & 2032
- Table 42: Australia Automatic Passenger Counting System Industry Revenue (Million) Forecast, by Application 2019 & 2032
- Table 43: Rest of Asia Pacific Automatic Passenger Counting System Industry Revenue (Million) Forecast, by Application 2019 & 2032
- Table 44: Global Automatic Passenger Counting System Industry Revenue Million Forecast, by Type 2019 & 2032
- Table 45: Global Automatic Passenger Counting System Industry Revenue Million Forecast, by End-user Application 2019 & 2032
- Table 46: Global Automatic Passenger Counting System Industry Revenue Million Forecast, by Country 2019 & 2032
- Table 47: Latin America Automatic Passenger Counting System Industry Revenue (Million) Forecast, by Application 2019 & 2032
- Table 48: Middle East Automatic Passenger Counting System Industry Revenue (Million) Forecast, by Application 2019 & 2032
Frequently Asked Questions
1. What is the projected Compound Annual Growth Rate (CAGR) of the Automatic Passenger Counting System Industry?
The projected CAGR is approximately 13.04%.
2. Which companies are prominent players in the Automatic Passenger Counting System Industry?
Key companies in the market include IEE SA, SensMax*List Not Exhaustive, Traf-Sys Inc, InfraRed Integrated Systems Ltd, HELLA Aglaia Mobile Vision GmbH, Eurotech SPA, ShopperTrak, Iris GmbH, Axis Communications AB, RetailNext Inc, FLIR Systems Inc.
3. What are the main segments of the Automatic Passenger Counting System Industry?
The market segments include Type, End-user Application.
4. Can you provide details about the market size?
The market size is estimated to be USD 1.28 Million as of 2022.
5. What are some drivers contributing to market growth?
; Security. Terrorism and Threats Risks Stimulating Building Security; Integration of IoT and Cloud Services.
6. What are the notable trends driving market growth?
Retail Sector to Dominate the Market.
7. Are there any restraints impacting market growth?
; Growth of E-commerce has Negatively Impacted the Market.
8. Can you provide examples of recent developments in the market?
N/A
9. What pricing options are available for accessing the report?
Pricing options include single-user, multi-user, and enterprise licenses priced at USD 4750, USD 5250, and USD 8750 respectively.
10. Is the market size provided in terms of value or volume?
The market size is provided in terms of value, measured in Million.
11. Are there any specific market keywords associated with the report?
Yes, the market keyword associated with the report is "Automatic Passenger Counting System Industry," which aids in identifying and referencing the specific market segment covered.
12. How do I determine which pricing option suits my needs best?
The pricing options vary based on user requirements and access needs. Individual users may opt for single-user licenses, while businesses requiring broader access may choose multi-user or enterprise licenses for cost-effective access to the report.
13. Are there any additional resources or data provided in the Automatic Passenger Counting System Industry report?
While the report offers comprehensive insights, it's advisable to review the specific contents or supplementary materials provided to ascertain if additional resources or data are available.
14. How can I stay updated on further developments or reports in the Automatic Passenger Counting System Industry?
To stay informed about further developments, trends, and reports in the Automatic Passenger Counting System Industry, consider subscribing to industry newsletters, following relevant companies and organizations, or regularly checking reputable industry news sources and publications.
Methodology
Step 1 - Identification of Relevant Samples Size from Population Database


Step 2 - Approaches for Defining Global Market Size (Value, Volume* & Price*)

Note*: In applicable scenarios
Step 3 - Data Sources
Primary Research
- Web Analytics
- Survey Reports
- Research Institute
- Latest Research Reports
- Opinion Leaders
Secondary Research
- Annual Reports
- White Paper
- Latest Press Release
- Industry Association
- Paid Database
- Investor Presentations

Step 4 - Data Triangulation
Involves using different sources of information in order to increase the validity of a study
These sources are likely to be stakeholders in a program - participants, other researchers, program staff, other community members, and so on.
Then we put all data in single framework & apply various statistical tools to find out the dynamic on the market.
During the analysis stage, feedback from the stakeholder groups would be compared to determine areas of agreement as well as areas of divergence


