
Key Insights
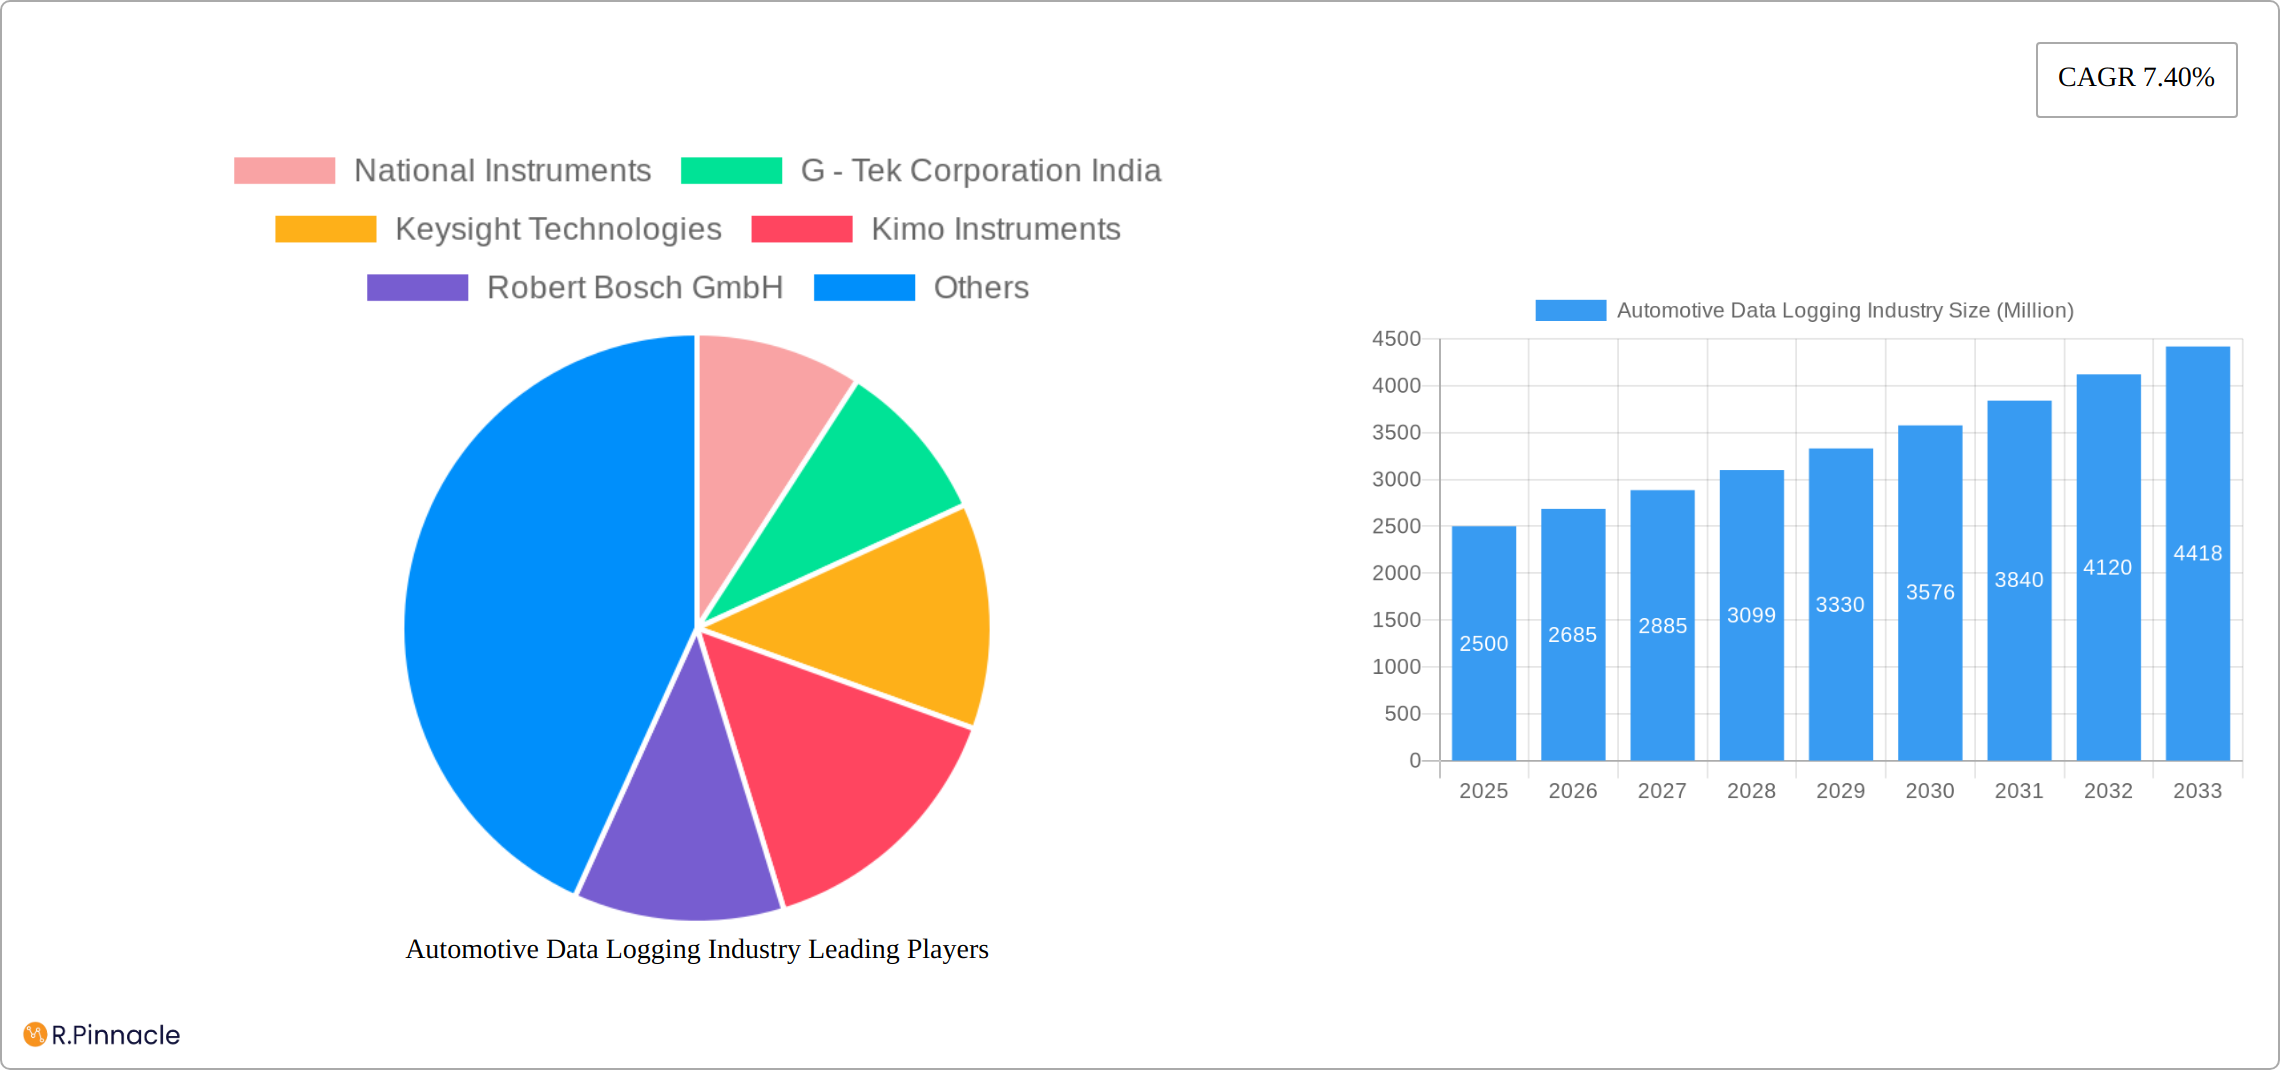
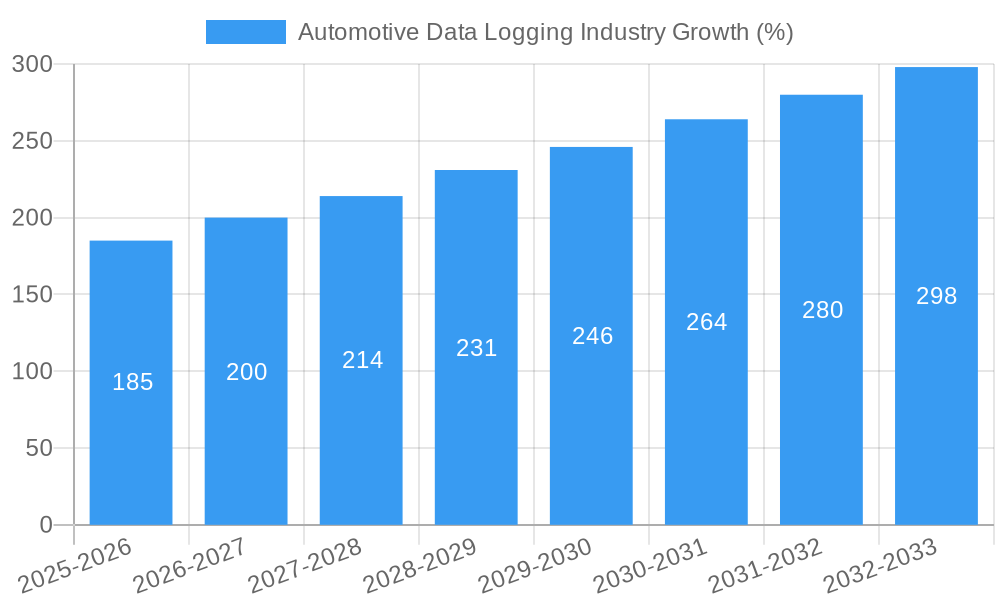
The automotive data logging market is experiencing robust growth, driven by the increasing demand for advanced driver-assistance systems (ADAS), the proliferation of electric vehicles (EVs), and the rising need for enhanced vehicle safety and performance. The market's Compound Annual Growth Rate (CAGR) of 7.40% from 2019 to 2024 indicates a significant upward trajectory. This growth is fueled by several key factors. Firstly, the automotive industry's continuous drive towards innovation, particularly in areas like autonomous driving and connected car technologies, necessitates comprehensive data logging capabilities to monitor vehicle performance and optimize system functionality. Secondly, stringent government regulations regarding vehicle emissions and safety standards are pushing manufacturers to implement advanced data logging solutions to ensure compliance. Thirdly, the growing adoption of data analytics in the automotive sector allows manufacturers to leverage logged data for predictive maintenance, improving operational efficiency and reducing downtime. Finally, the expansion of the EV market is creating new opportunities for data logging solutions specifically tailored to monitor battery performance, charging cycles, and overall vehicle health. We estimate the market size to be approximately $2.5 billion in 2025, based on a logical extrapolation of the given CAGR and considering industry growth patterns.
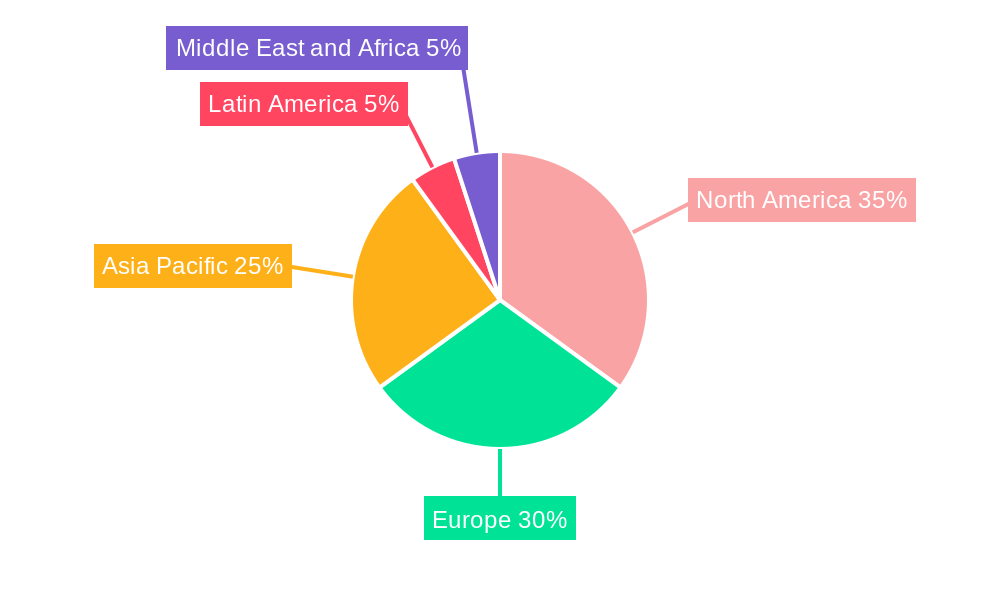
The market segmentation reveals key trends. Within end-user industries, the automotive sector itself holds the largest share, followed by manufacturing and oil & gas. The preference for wireless data logging systems is increasing due to their flexibility and convenience. Multi-channel systems are gaining traction due to their ability to collect more comprehensive data. Temperature and pressure are the most commonly logged parameters, reflecting the importance of monitoring critical vehicle systems. Major players like National Instruments, Keysight Technologies, and Bosch are driving innovation and competition within the market, leading to continuous improvements in data logging technology and integration capabilities. The Asia-Pacific region is projected to witness significant growth, driven by increasing vehicle production and technological advancements in the region. The forecast period of 2025-2033 promises further expansion, driven by ongoing technological advancements and increasing adoption of data-driven strategies across the automotive industry.
Automotive Data Logging Industry Market Report: 2019-2033
This comprehensive report provides a detailed analysis of the Automotive Data Logging Industry, offering invaluable insights for industry professionals, investors, and strategic decision-makers. The report covers the period 2019-2033, with a focus on the estimated year 2025 and forecast period 2025-2033. The market is segmented by end-user industry, deployment type, channel, and input parameter, revealing key trends and growth opportunities within this dynamic sector. The total market size is projected to reach xx Million by 2033.
Automotive Data Logging Industry Market Structure & Innovation Trends
The Automotive Data Logging Industry is characterized by a moderately concentrated market structure, with key players such as National Instruments, Keysight Technologies, Robert Bosch GmbH, and Yokogawa Electric Company holding significant market share. The estimated combined market share of these companies in 2025 is xx%. Innovation is driven by the increasing demand for advanced driver-assistance systems (ADAS), the rise of electric vehicles (EVs), and stringent regulatory requirements for vehicle safety and emissions. Regulatory frameworks like those focusing on cybersecurity and data privacy are also significantly impacting the market. Product substitutes are limited, primarily confined to less sophisticated data acquisition methods. M&A activity has been moderate in recent years, with deal values totaling approximately xx Million between 2019 and 2024. Future M&A activity is anticipated to be driven by the need for companies to expand their technological capabilities and global reach.
- Market Concentration: Moderately concentrated, with top players holding xx% market share in 2025.
- Innovation Drivers: ADAS, EVs, and stringent safety/emission regulations.
- Regulatory Frameworks: Increasing focus on cybersecurity and data privacy.
- M&A Activity: Total deal value of approximately xx Million (2019-2024).
Automotive Data Logging Industry Market Dynamics & Trends
The Automotive Data Logging Industry is experiencing robust growth, driven by the increasing adoption of connected vehicles, the expansion of the EV market, and the growing need for efficient data analysis in vehicle development and testing. The market is witnessing significant technological disruptions, including the integration of artificial intelligence (AI) and machine learning (ML) algorithms for data processing and analysis. Consumer preferences are shifting towards more sophisticated data logging systems that offer enhanced connectivity, real-time data visualization, and seamless integration with other vehicle systems. The competitive landscape is characterized by intense rivalry among established players and emerging companies, leading to continuous product innovation and strategic partnerships. The Compound Annual Growth Rate (CAGR) during the forecast period (2025-2033) is estimated to be xx%, with a market penetration rate of xx% by 2033.
Dominant Regions & Segments in Automotive Data Logging Industry
The Automotive segment dominates the end-user industry, accounting for xx% of the market in 2025. This is followed by the Manufacturing sector. Geographically, North America and Europe are currently leading the market, but Asia-Pacific is expected to experience the highest growth rate during the forecast period due to rapid industrialization and increasing automotive production.
Key Drivers:
- Automotive: High demand for advanced driver-assistance systems (ADAS) and electric vehicles.
- Manufacturing: Need for process optimization and quality control.
- North America/Europe: Established automotive industries and technological advancements.
- Asia-Pacific: Rapid industrialization and growth in automotive manufacturing.
Dominant Segments:
- By Deployment: Wireless data logging systems are gaining traction due to their flexibility and ease of use.
- By Channel: Multi-channel systems are preferred for their ability to collect data from multiple sources simultaneously.
- By Input Parameter: Temperature and pressure sensors are widely used, reflecting the importance of engine performance and environmental monitoring.
Automotive Data Logging Industry Product Innovations
Recent product innovations focus on miniaturization, enhanced wireless connectivity (e.g., 5G), improved data security, and cloud-based data storage and analysis. These advancements cater to the growing demand for real-time data monitoring and sophisticated analytics, improving efficiency in vehicle development and fleet management. The integration of AI and ML algorithms enables automated data analysis and predictive maintenance, offering significant competitive advantages.
Report Scope & Segmentation Analysis
This report provides a comprehensive analysis of the Automotive Data Logging Industry, segmented by:
End-user Industry: Oil & Gas, Manufacturing, Automotive, Power & Utilities, Other End-user Industries. The Automotive segment is projected to grow at a CAGR of xx% during the forecast period.
Deployment: USB Data, Bluetooth Enabled Logger, Web-based Systems, Wireless. Wireless deployments are expected to capture the largest market share due to their increased flexibility.
Channel: Single Channel, Multi-Channel. The multi-channel segment is projected to experience significant growth owing to the increasing need for comprehensive data acquisition.
Input Parameter: Temperature, Pressure, Humidity, Voltage, Other Input Parameters. Temperature and pressure sensors dominate the market due to their crucial role in various applications.
Each segment's growth projection and competitive dynamics are analyzed in detail within the full report.
Key Drivers of Automotive Data Logging Industry Growth
Several factors are driving the growth of the Automotive Data Logging Industry. These include the increasing demand for connected vehicles and autonomous driving technologies, stringent government regulations on vehicle emissions and safety, and the growing need for predictive maintenance in the automotive sector. Technological advancements such as the development of more efficient sensors and data analytics tools further propel market growth.
Challenges in the Automotive Data Logging Industry Sector
The industry faces challenges such as high initial investment costs associated with data logging systems, concerns regarding data security and privacy, and the complexity of integrating data from diverse sources. Supply chain disruptions, particularly the scarcity of certain electronic components, can also impact production and timelines. Furthermore, intense competition among established and emerging players creates pressure on pricing and margins.
Emerging Opportunities in Automotive Data Logging Industry
Emerging opportunities lie in the development of sophisticated data analytics solutions, leveraging AI and ML to extract valuable insights from logged data. Expansion into new markets, such as the agricultural and aerospace sectors, also presents significant growth potential. The increasing adoption of cloud-based data storage and processing platforms offers further opportunities for market expansion and enhanced data accessibility.
Leading Players in the Automotive Data Logging Industry Market
- National Instruments
- G - Tek Corporation India
- Keysight Technologies
- Kimo Instruments
- Robert Bosch GmbH
- Thermo Fisher Scientific
- Yokogawa Electric Company
- HIOKI E E Corporation
- ABB
Key Developments in Automotive Data Logging Industry Industry
- 2022 Q4: National Instruments launched a new data logging system with enhanced AI capabilities.
- 2023 Q1: Keysight Technologies and Robert Bosch GmbH announced a strategic partnership to develop advanced data logging solutions for autonomous vehicles.
- 2023 Q3: Yokogawa Electric Company released a new data logger with improved wireless connectivity and data security features. (Further developments to be added in the full report)
Future Outlook for Automotive Data Logging Industry Market
The Automotive Data Logging Industry is poised for continued growth, driven by the ongoing evolution of the automotive sector, the increasing adoption of connected vehicles and autonomous driving, and the continued development of advanced data analytics technologies. The market will likely see increased consolidation through mergers and acquisitions, leading to a more concentrated market structure. Companies that focus on innovation and the development of advanced data analytics capabilities will be best positioned for success in the years to come.
Automotive Data Logging Industry Segmentation
-
1. Deployment
- 1.1. USB Data
- 1.2. Bluetooth Enabled Logger
- 1.3. Web-based Systems
- 1.4. Wireless
-
2. Channel
- 2.1. Single Channel
- 2.2. Multi-Channel
-
3. Input Parameter
- 3.1. Temperature
- 3.2. Pressure
- 3.3. Humidity
- 3.4. Voltage
- 3.5. Other Input Parameters
-
4. End-user Industry
- 4.1. Oil & Gas
- 4.2. Manufacturing
- 4.3. Automotive
- 4.4. Power & Utilities
- 4.5. Other End-user Industries
Automotive Data Logging Industry Segmentation By Geography
- 1. North America
- 2. Europe
- 3. Asia Pacific
- 4. Latin America
- 5. Middle East and Africa
Automotive Data Logging Industry REPORT HIGHLIGHTS
| Aspects | Details |
|---|---|
| Study Period | 2019-2033 |
| Base Year | 2024 |
| Estimated Year | 2025 |
| Forecast Period | 2025-2033 |
| Historical Period | 2019-2024 |
| Growth Rate | CAGR of 7.40% from 2019-2033 |
| Segmentation |
|
Table of Contents
- 1. Introduction
- 1.1. Research Scope
- 1.2. Market Segmentation
- 1.3. Research Methodology
- 1.4. Definitions and Assumptions
- 2. Executive Summary
- 2.1. Introduction
- 3. Market Dynamics
- 3.1. Introduction
- 3.2. Market Drivers
- 3.2.1. ; High Demand for Measurement and Control Operations
- 3.3. Market Restrains
- 3.3.1. ; High Up-front Associated Costs
- 3.4. Market Trends
- 3.4.1. Oil and Gas is Expected to Hold a Major Market Share
- 4. Market Factor Analysis
- 4.1. Porters Five Forces
- 4.2. Supply/Value Chain
- 4.3. PESTEL analysis
- 4.4. Market Entropy
- 4.5. Patent/Trademark Analysis
- 5. Global Automotive Data Logging Industry Analysis, Insights and Forecast, 2019-2031
- 5.1. Market Analysis, Insights and Forecast - by Deployment
- 5.1.1. USB Data
- 5.1.2. Bluetooth Enabled Logger
- 5.1.3. Web-based Systems
- 5.1.4. Wireless
- 5.2. Market Analysis, Insights and Forecast - by Channel
- 5.2.1. Single Channel
- 5.2.2. Multi-Channel
- 5.3. Market Analysis, Insights and Forecast - by Input Parameter
- 5.3.1. Temperature
- 5.3.2. Pressure
- 5.3.3. Humidity
- 5.3.4. Voltage
- 5.3.5. Other Input Parameters
- 5.4. Market Analysis, Insights and Forecast - by End-user Industry
- 5.4.1. Oil & Gas
- 5.4.2. Manufacturing
- 5.4.3. Automotive
- 5.4.4. Power & Utilities
- 5.4.5. Other End-user Industries
- 5.5. Market Analysis, Insights and Forecast - by Region
- 5.5.1. North America
- 5.5.2. Europe
- 5.5.3. Asia Pacific
- 5.5.4. Latin America
- 5.5.5. Middle East and Africa
- 5.1. Market Analysis, Insights and Forecast - by Deployment
- 6. North America Automotive Data Logging Industry Analysis, Insights and Forecast, 2019-2031
- 6.1. Market Analysis, Insights and Forecast - by Deployment
- 6.1.1. USB Data
- 6.1.2. Bluetooth Enabled Logger
- 6.1.3. Web-based Systems
- 6.1.4. Wireless
- 6.2. Market Analysis, Insights and Forecast - by Channel
- 6.2.1. Single Channel
- 6.2.2. Multi-Channel
- 6.3. Market Analysis, Insights and Forecast - by Input Parameter
- 6.3.1. Temperature
- 6.3.2. Pressure
- 6.3.3. Humidity
- 6.3.4. Voltage
- 6.3.5. Other Input Parameters
- 6.4. Market Analysis, Insights and Forecast - by End-user Industry
- 6.4.1. Oil & Gas
- 6.4.2. Manufacturing
- 6.4.3. Automotive
- 6.4.4. Power & Utilities
- 6.4.5. Other End-user Industries
- 6.1. Market Analysis, Insights and Forecast - by Deployment
- 7. Europe Automotive Data Logging Industry Analysis, Insights and Forecast, 2019-2031
- 7.1. Market Analysis, Insights and Forecast - by Deployment
- 7.1.1. USB Data
- 7.1.2. Bluetooth Enabled Logger
- 7.1.3. Web-based Systems
- 7.1.4. Wireless
- 7.2. Market Analysis, Insights and Forecast - by Channel
- 7.2.1. Single Channel
- 7.2.2. Multi-Channel
- 7.3. Market Analysis, Insights and Forecast - by Input Parameter
- 7.3.1. Temperature
- 7.3.2. Pressure
- 7.3.3. Humidity
- 7.3.4. Voltage
- 7.3.5. Other Input Parameters
- 7.4. Market Analysis, Insights and Forecast - by End-user Industry
- 7.4.1. Oil & Gas
- 7.4.2. Manufacturing
- 7.4.3. Automotive
- 7.4.4. Power & Utilities
- 7.4.5. Other End-user Industries
- 7.1. Market Analysis, Insights and Forecast - by Deployment
- 8. Asia Pacific Automotive Data Logging Industry Analysis, Insights and Forecast, 2019-2031
- 8.1. Market Analysis, Insights and Forecast - by Deployment
- 8.1.1. USB Data
- 8.1.2. Bluetooth Enabled Logger
- 8.1.3. Web-based Systems
- 8.1.4. Wireless
- 8.2. Market Analysis, Insights and Forecast - by Channel
- 8.2.1. Single Channel
- 8.2.2. Multi-Channel
- 8.3. Market Analysis, Insights and Forecast - by Input Parameter
- 8.3.1. Temperature
- 8.3.2. Pressure
- 8.3.3. Humidity
- 8.3.4. Voltage
- 8.3.5. Other Input Parameters
- 8.4. Market Analysis, Insights and Forecast - by End-user Industry
- 8.4.1. Oil & Gas
- 8.4.2. Manufacturing
- 8.4.3. Automotive
- 8.4.4. Power & Utilities
- 8.4.5. Other End-user Industries
- 8.1. Market Analysis, Insights and Forecast - by Deployment
- 9. Latin America Automotive Data Logging Industry Analysis, Insights and Forecast, 2019-2031
- 9.1. Market Analysis, Insights and Forecast - by Deployment
- 9.1.1. USB Data
- 9.1.2. Bluetooth Enabled Logger
- 9.1.3. Web-based Systems
- 9.1.4. Wireless
- 9.2. Market Analysis, Insights and Forecast - by Channel
- 9.2.1. Single Channel
- 9.2.2. Multi-Channel
- 9.3. Market Analysis, Insights and Forecast - by Input Parameter
- 9.3.1. Temperature
- 9.3.2. Pressure
- 9.3.3. Humidity
- 9.3.4. Voltage
- 9.3.5. Other Input Parameters
- 9.4. Market Analysis, Insights and Forecast - by End-user Industry
- 9.4.1. Oil & Gas
- 9.4.2. Manufacturing
- 9.4.3. Automotive
- 9.4.4. Power & Utilities
- 9.4.5. Other End-user Industries
- 9.1. Market Analysis, Insights and Forecast - by Deployment
- 10. Middle East and Africa Automotive Data Logging Industry Analysis, Insights and Forecast, 2019-2031
- 10.1. Market Analysis, Insights and Forecast - by Deployment
- 10.1.1. USB Data
- 10.1.2. Bluetooth Enabled Logger
- 10.1.3. Web-based Systems
- 10.1.4. Wireless
- 10.2. Market Analysis, Insights and Forecast - by Channel
- 10.2.1. Single Channel
- 10.2.2. Multi-Channel
- 10.3. Market Analysis, Insights and Forecast - by Input Parameter
- 10.3.1. Temperature
- 10.3.2. Pressure
- 10.3.3. Humidity
- 10.3.4. Voltage
- 10.3.5. Other Input Parameters
- 10.4. Market Analysis, Insights and Forecast - by End-user Industry
- 10.4.1. Oil & Gas
- 10.4.2. Manufacturing
- 10.4.3. Automotive
- 10.4.4. Power & Utilities
- 10.4.5. Other End-user Industries
- 10.1. Market Analysis, Insights and Forecast - by Deployment
- 11. North America Automotive Data Logging Industry Analysis, Insights and Forecast, 2019-2031
- 11.1. Market Analysis, Insights and Forecast - By Country/Sub-region
- 11.1.1.
- 12. Europe Automotive Data Logging Industry Analysis, Insights and Forecast, 2019-2031
- 12.1. Market Analysis, Insights and Forecast - By Country/Sub-region
- 12.1.1.
- 13. Asia Pacific Automotive Data Logging Industry Analysis, Insights and Forecast, 2019-2031
- 13.1. Market Analysis, Insights and Forecast - By Country/Sub-region
- 13.1.1.
- 14. Latin America Automotive Data Logging Industry Analysis, Insights and Forecast, 2019-2031
- 14.1. Market Analysis, Insights and Forecast - By Country/Sub-region
- 14.1.1.
- 15. Middle East and Africa Automotive Data Logging Industry Analysis, Insights and Forecast, 2019-2031
- 15.1. Market Analysis, Insights and Forecast - By Country/Sub-region
- 15.1.1.
- 16. Competitive Analysis
- 16.1. Global Market Share Analysis 2024
- 16.2. Company Profiles
- 16.2.1 National Instruments
- 16.2.1.1. Overview
- 16.2.1.2. Products
- 16.2.1.3. SWOT Analysis
- 16.2.1.4. Recent Developments
- 16.2.1.5. Financials (Based on Availability)
- 16.2.2 G - Tek Corporation India
- 16.2.2.1. Overview
- 16.2.2.2. Products
- 16.2.2.3. SWOT Analysis
- 16.2.2.4. Recent Developments
- 16.2.2.5. Financials (Based on Availability)
- 16.2.3 Keysight Technologies
- 16.2.3.1. Overview
- 16.2.3.2. Products
- 16.2.3.3. SWOT Analysis
- 16.2.3.4. Recent Developments
- 16.2.3.5. Financials (Based on Availability)
- 16.2.4 Kimo Instruments
- 16.2.4.1. Overview
- 16.2.4.2. Products
- 16.2.4.3. SWOT Analysis
- 16.2.4.4. Recent Developments
- 16.2.4.5. Financials (Based on Availability)
- 16.2.5 Robert Bosch GmbH
- 16.2.5.1. Overview
- 16.2.5.2. Products
- 16.2.5.3. SWOT Analysis
- 16.2.5.4. Recent Developments
- 16.2.5.5. Financials (Based on Availability)
- 16.2.6 Thermo Fisher Scientific
- 16.2.6.1. Overview
- 16.2.6.2. Products
- 16.2.6.3. SWOT Analysis
- 16.2.6.4. Recent Developments
- 16.2.6.5. Financials (Based on Availability)
- 16.2.7 Yokogawa Electric Company
- 16.2.7.1. Overview
- 16.2.7.2. Products
- 16.2.7.3. SWOT Analysis
- 16.2.7.4. Recent Developments
- 16.2.7.5. Financials (Based on Availability)
- 16.2.8 HIOKI E E Corporation*List Not Exhaustive
- 16.2.8.1. Overview
- 16.2.8.2. Products
- 16.2.8.3. SWOT Analysis
- 16.2.8.4. Recent Developments
- 16.2.8.5. Financials (Based on Availability)
- 16.2.9 ABB
- 16.2.9.1. Overview
- 16.2.9.2. Products
- 16.2.9.3. SWOT Analysis
- 16.2.9.4. Recent Developments
- 16.2.9.5. Financials (Based on Availability)
- 16.2.1 National Instruments
List of Figures
- Figure 1: Global Automotive Data Logging Industry Revenue Breakdown (Million, %) by Region 2024 & 2032
- Figure 2: North America Automotive Data Logging Industry Revenue (Million), by Country 2024 & 2032
- Figure 3: North America Automotive Data Logging Industry Revenue Share (%), by Country 2024 & 2032
- Figure 4: Europe Automotive Data Logging Industry Revenue (Million), by Country 2024 & 2032
- Figure 5: Europe Automotive Data Logging Industry Revenue Share (%), by Country 2024 & 2032
- Figure 6: Asia Pacific Automotive Data Logging Industry Revenue (Million), by Country 2024 & 2032
- Figure 7: Asia Pacific Automotive Data Logging Industry Revenue Share (%), by Country 2024 & 2032
- Figure 8: Latin America Automotive Data Logging Industry Revenue (Million), by Country 2024 & 2032
- Figure 9: Latin America Automotive Data Logging Industry Revenue Share (%), by Country 2024 & 2032
- Figure 10: Middle East and Africa Automotive Data Logging Industry Revenue (Million), by Country 2024 & 2032
- Figure 11: Middle East and Africa Automotive Data Logging Industry Revenue Share (%), by Country 2024 & 2032
- Figure 12: North America Automotive Data Logging Industry Revenue (Million), by Deployment 2024 & 2032
- Figure 13: North America Automotive Data Logging Industry Revenue Share (%), by Deployment 2024 & 2032
- Figure 14: North America Automotive Data Logging Industry Revenue (Million), by Channel 2024 & 2032
- Figure 15: North America Automotive Data Logging Industry Revenue Share (%), by Channel 2024 & 2032
- Figure 16: North America Automotive Data Logging Industry Revenue (Million), by Input Parameter 2024 & 2032
- Figure 17: North America Automotive Data Logging Industry Revenue Share (%), by Input Parameter 2024 & 2032
- Figure 18: North America Automotive Data Logging Industry Revenue (Million), by End-user Industry 2024 & 2032
- Figure 19: North America Automotive Data Logging Industry Revenue Share (%), by End-user Industry 2024 & 2032
- Figure 20: North America Automotive Data Logging Industry Revenue (Million), by Country 2024 & 2032
- Figure 21: North America Automotive Data Logging Industry Revenue Share (%), by Country 2024 & 2032
- Figure 22: Europe Automotive Data Logging Industry Revenue (Million), by Deployment 2024 & 2032
- Figure 23: Europe Automotive Data Logging Industry Revenue Share (%), by Deployment 2024 & 2032
- Figure 24: Europe Automotive Data Logging Industry Revenue (Million), by Channel 2024 & 2032
- Figure 25: Europe Automotive Data Logging Industry Revenue Share (%), by Channel 2024 & 2032
- Figure 26: Europe Automotive Data Logging Industry Revenue (Million), by Input Parameter 2024 & 2032
- Figure 27: Europe Automotive Data Logging Industry Revenue Share (%), by Input Parameter 2024 & 2032
- Figure 28: Europe Automotive Data Logging Industry Revenue (Million), by End-user Industry 2024 & 2032
- Figure 29: Europe Automotive Data Logging Industry Revenue Share (%), by End-user Industry 2024 & 2032
- Figure 30: Europe Automotive Data Logging Industry Revenue (Million), by Country 2024 & 2032
- Figure 31: Europe Automotive Data Logging Industry Revenue Share (%), by Country 2024 & 2032
- Figure 32: Asia Pacific Automotive Data Logging Industry Revenue (Million), by Deployment 2024 & 2032
- Figure 33: Asia Pacific Automotive Data Logging Industry Revenue Share (%), by Deployment 2024 & 2032
- Figure 34: Asia Pacific Automotive Data Logging Industry Revenue (Million), by Channel 2024 & 2032
- Figure 35: Asia Pacific Automotive Data Logging Industry Revenue Share (%), by Channel 2024 & 2032
- Figure 36: Asia Pacific Automotive Data Logging Industry Revenue (Million), by Input Parameter 2024 & 2032
- Figure 37: Asia Pacific Automotive Data Logging Industry Revenue Share (%), by Input Parameter 2024 & 2032
- Figure 38: Asia Pacific Automotive Data Logging Industry Revenue (Million), by End-user Industry 2024 & 2032
- Figure 39: Asia Pacific Automotive Data Logging Industry Revenue Share (%), by End-user Industry 2024 & 2032
- Figure 40: Asia Pacific Automotive Data Logging Industry Revenue (Million), by Country 2024 & 2032
- Figure 41: Asia Pacific Automotive Data Logging Industry Revenue Share (%), by Country 2024 & 2032
- Figure 42: Latin America Automotive Data Logging Industry Revenue (Million), by Deployment 2024 & 2032
- Figure 43: Latin America Automotive Data Logging Industry Revenue Share (%), by Deployment 2024 & 2032
- Figure 44: Latin America Automotive Data Logging Industry Revenue (Million), by Channel 2024 & 2032
- Figure 45: Latin America Automotive Data Logging Industry Revenue Share (%), by Channel 2024 & 2032
- Figure 46: Latin America Automotive Data Logging Industry Revenue (Million), by Input Parameter 2024 & 2032
- Figure 47: Latin America Automotive Data Logging Industry Revenue Share (%), by Input Parameter 2024 & 2032
- Figure 48: Latin America Automotive Data Logging Industry Revenue (Million), by End-user Industry 2024 & 2032
- Figure 49: Latin America Automotive Data Logging Industry Revenue Share (%), by End-user Industry 2024 & 2032
- Figure 50: Latin America Automotive Data Logging Industry Revenue (Million), by Country 2024 & 2032
- Figure 51: Latin America Automotive Data Logging Industry Revenue Share (%), by Country 2024 & 2032
- Figure 52: Middle East and Africa Automotive Data Logging Industry Revenue (Million), by Deployment 2024 & 2032
- Figure 53: Middle East and Africa Automotive Data Logging Industry Revenue Share (%), by Deployment 2024 & 2032
- Figure 54: Middle East and Africa Automotive Data Logging Industry Revenue (Million), by Channel 2024 & 2032
- Figure 55: Middle East and Africa Automotive Data Logging Industry Revenue Share (%), by Channel 2024 & 2032
- Figure 56: Middle East and Africa Automotive Data Logging Industry Revenue (Million), by Input Parameter 2024 & 2032
- Figure 57: Middle East and Africa Automotive Data Logging Industry Revenue Share (%), by Input Parameter 2024 & 2032
- Figure 58: Middle East and Africa Automotive Data Logging Industry Revenue (Million), by End-user Industry 2024 & 2032
- Figure 59: Middle East and Africa Automotive Data Logging Industry Revenue Share (%), by End-user Industry 2024 & 2032
- Figure 60: Middle East and Africa Automotive Data Logging Industry Revenue (Million), by Country 2024 & 2032
- Figure 61: Middle East and Africa Automotive Data Logging Industry Revenue Share (%), by Country 2024 & 2032
List of Tables
- Table 1: Global Automotive Data Logging Industry Revenue Million Forecast, by Region 2019 & 2032
- Table 2: Global Automotive Data Logging Industry Revenue Million Forecast, by Deployment 2019 & 2032
- Table 3: Global Automotive Data Logging Industry Revenue Million Forecast, by Channel 2019 & 2032
- Table 4: Global Automotive Data Logging Industry Revenue Million Forecast, by Input Parameter 2019 & 2032
- Table 5: Global Automotive Data Logging Industry Revenue Million Forecast, by End-user Industry 2019 & 2032
- Table 6: Global Automotive Data Logging Industry Revenue Million Forecast, by Region 2019 & 2032
- Table 7: Global Automotive Data Logging Industry Revenue Million Forecast, by Country 2019 & 2032
- Table 8: Automotive Data Logging Industry Revenue (Million) Forecast, by Application 2019 & 2032
- Table 9: Global Automotive Data Logging Industry Revenue Million Forecast, by Country 2019 & 2032
- Table 10: Automotive Data Logging Industry Revenue (Million) Forecast, by Application 2019 & 2032
- Table 11: Global Automotive Data Logging Industry Revenue Million Forecast, by Country 2019 & 2032
- Table 12: Automotive Data Logging Industry Revenue (Million) Forecast, by Application 2019 & 2032
- Table 13: Global Automotive Data Logging Industry Revenue Million Forecast, by Country 2019 & 2032
- Table 14: Automotive Data Logging Industry Revenue (Million) Forecast, by Application 2019 & 2032
- Table 15: Global Automotive Data Logging Industry Revenue Million Forecast, by Country 2019 & 2032
- Table 16: Automotive Data Logging Industry Revenue (Million) Forecast, by Application 2019 & 2032
- Table 17: Global Automotive Data Logging Industry Revenue Million Forecast, by Deployment 2019 & 2032
- Table 18: Global Automotive Data Logging Industry Revenue Million Forecast, by Channel 2019 & 2032
- Table 19: Global Automotive Data Logging Industry Revenue Million Forecast, by Input Parameter 2019 & 2032
- Table 20: Global Automotive Data Logging Industry Revenue Million Forecast, by End-user Industry 2019 & 2032
- Table 21: Global Automotive Data Logging Industry Revenue Million Forecast, by Country 2019 & 2032
- Table 22: Global Automotive Data Logging Industry Revenue Million Forecast, by Deployment 2019 & 2032
- Table 23: Global Automotive Data Logging Industry Revenue Million Forecast, by Channel 2019 & 2032
- Table 24: Global Automotive Data Logging Industry Revenue Million Forecast, by Input Parameter 2019 & 2032
- Table 25: Global Automotive Data Logging Industry Revenue Million Forecast, by End-user Industry 2019 & 2032
- Table 26: Global Automotive Data Logging Industry Revenue Million Forecast, by Country 2019 & 2032
- Table 27: Global Automotive Data Logging Industry Revenue Million Forecast, by Deployment 2019 & 2032
- Table 28: Global Automotive Data Logging Industry Revenue Million Forecast, by Channel 2019 & 2032
- Table 29: Global Automotive Data Logging Industry Revenue Million Forecast, by Input Parameter 2019 & 2032
- Table 30: Global Automotive Data Logging Industry Revenue Million Forecast, by End-user Industry 2019 & 2032
- Table 31: Global Automotive Data Logging Industry Revenue Million Forecast, by Country 2019 & 2032
- Table 32: Global Automotive Data Logging Industry Revenue Million Forecast, by Deployment 2019 & 2032
- Table 33: Global Automotive Data Logging Industry Revenue Million Forecast, by Channel 2019 & 2032
- Table 34: Global Automotive Data Logging Industry Revenue Million Forecast, by Input Parameter 2019 & 2032
- Table 35: Global Automotive Data Logging Industry Revenue Million Forecast, by End-user Industry 2019 & 2032
- Table 36: Global Automotive Data Logging Industry Revenue Million Forecast, by Country 2019 & 2032
- Table 37: Global Automotive Data Logging Industry Revenue Million Forecast, by Deployment 2019 & 2032
- Table 38: Global Automotive Data Logging Industry Revenue Million Forecast, by Channel 2019 & 2032
- Table 39: Global Automotive Data Logging Industry Revenue Million Forecast, by Input Parameter 2019 & 2032
- Table 40: Global Automotive Data Logging Industry Revenue Million Forecast, by End-user Industry 2019 & 2032
- Table 41: Global Automotive Data Logging Industry Revenue Million Forecast, by Country 2019 & 2032
Frequently Asked Questions
1. What is the projected Compound Annual Growth Rate (CAGR) of the Automotive Data Logging Industry?
The projected CAGR is approximately 7.40%.
2. Which companies are prominent players in the Automotive Data Logging Industry?
Key companies in the market include National Instruments, G - Tek Corporation India, Keysight Technologies, Kimo Instruments, Robert Bosch GmbH, Thermo Fisher Scientific, Yokogawa Electric Company, HIOKI E E Corporation*List Not Exhaustive, ABB.
3. What are the main segments of the Automotive Data Logging Industry?
The market segments include Deployment, Channel, Input Parameter, End-user Industry.
4. Can you provide details about the market size?
The market size is estimated to be USD XX Million as of 2022.
5. What are some drivers contributing to market growth?
; High Demand for Measurement and Control Operations.
6. What are the notable trends driving market growth?
Oil and Gas is Expected to Hold a Major Market Share.
7. Are there any restraints impacting market growth?
; High Up-front Associated Costs.
8. Can you provide examples of recent developments in the market?
N/A
9. What pricing options are available for accessing the report?
Pricing options include single-user, multi-user, and enterprise licenses priced at USD 4750, USD 5250, and USD 8750 respectively.
10. Is the market size provided in terms of value or volume?
The market size is provided in terms of value, measured in Million.
11. Are there any specific market keywords associated with the report?
Yes, the market keyword associated with the report is "Automotive Data Logging Industry," which aids in identifying and referencing the specific market segment covered.
12. How do I determine which pricing option suits my needs best?
The pricing options vary based on user requirements and access needs. Individual users may opt for single-user licenses, while businesses requiring broader access may choose multi-user or enterprise licenses for cost-effective access to the report.
13. Are there any additional resources or data provided in the Automotive Data Logging Industry report?
While the report offers comprehensive insights, it's advisable to review the specific contents or supplementary materials provided to ascertain if additional resources or data are available.
14. How can I stay updated on further developments or reports in the Automotive Data Logging Industry?
To stay informed about further developments, trends, and reports in the Automotive Data Logging Industry, consider subscribing to industry newsletters, following relevant companies and organizations, or regularly checking reputable industry news sources and publications.
Methodology
Step 1 - Identification of Relevant Samples Size from Population Database


Step 2 - Approaches for Defining Global Market Size (Value, Volume* & Price*)

Note*: In applicable scenarios
Step 3 - Data Sources
Primary Research
- Web Analytics
- Survey Reports
- Research Institute
- Latest Research Reports
- Opinion Leaders
Secondary Research
- Annual Reports
- White Paper
- Latest Press Release
- Industry Association
- Paid Database
- Investor Presentations

Step 4 - Data Triangulation
Involves using different sources of information in order to increase the validity of a study
These sources are likely to be stakeholders in a program - participants, other researchers, program staff, other community members, and so on.
Then we put all data in single framework & apply various statistical tools to find out the dynamic on the market.
During the analysis stage, feedback from the stakeholder groups would be compared to determine areas of agreement as well as areas of divergence


