
Key Insights
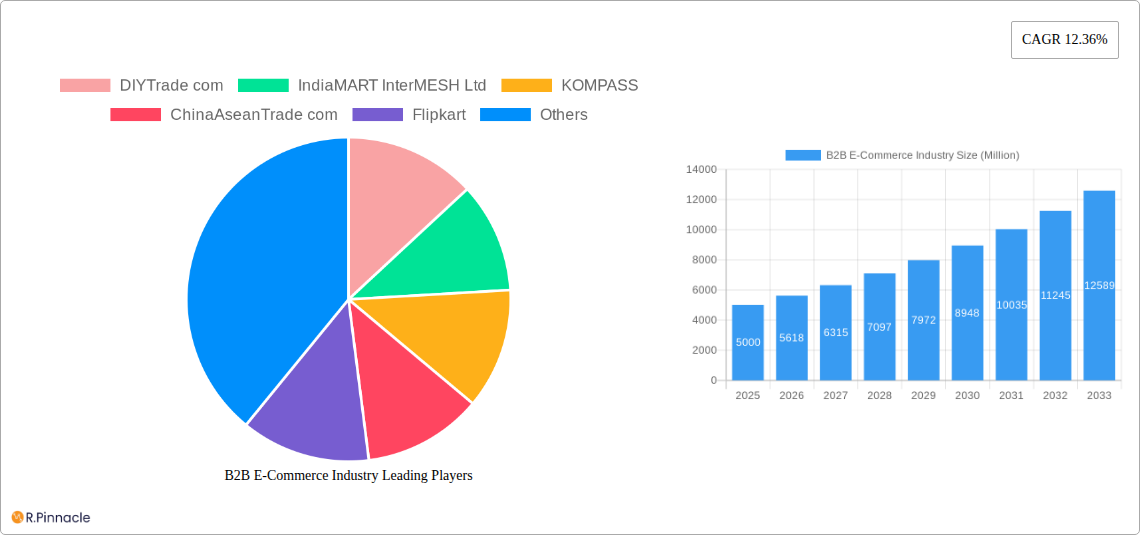
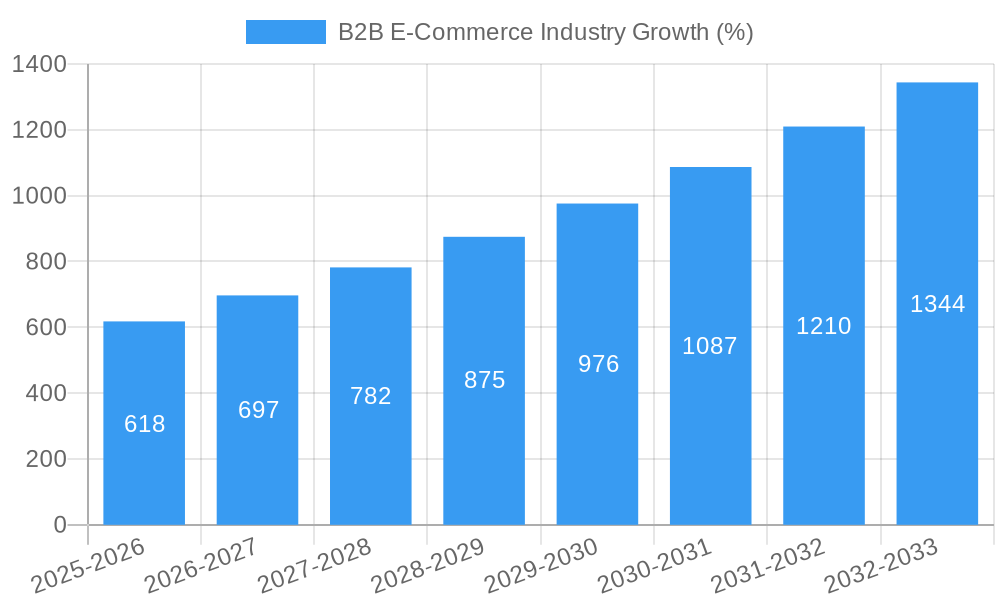
The B2B e-commerce market is experiencing robust growth, driven by the increasing adoption of digital technologies by businesses globally. The market's Compound Annual Growth Rate (CAGR) of 12.36% from 2019-2024 suggests a significant expansion, projected to continue into the forecast period (2025-2033). This growth is fueled by several factors, including the rising demand for improved efficiency and cost reduction in procurement processes, enhanced supply chain visibility, and the expanding reach to new markets facilitated by online platforms. The shift towards digital transformation across various industries is further accelerating the adoption of B2B e-commerce solutions. Key players like Alibaba, Amazon, and IndiaMART are leading this transformation, leveraging their extensive networks and technological capabilities to cater to diverse business needs. The market segmentation by sales channels (direct and marketplace) reflects evolving business strategies, with marketplaces offering broad reach and direct sales allowing for deeper customer relationships. Geographic distribution shows strong growth across North America, Europe, and Asia-Pacific, with developing economies in Asia-Pacific potentially offering significant future growth opportunities.
The competitive landscape is characterized by a mix of established players and emerging niche businesses. Large companies offer comprehensive solutions, while smaller firms may focus on specific industry verticals or provide specialized services. The market's growth will likely be influenced by factors such as evolving technological advancements (e.g., AI, blockchain), increasing cyber security concerns, and the ongoing adaptation of businesses to the nuances of online B2B transactions. Strategies focusing on user experience, secure transactions, and personalized services will be crucial for success in this dynamic and expanding market. Government regulations and initiatives promoting digitalization in various sectors will also play a pivotal role in shaping the future trajectory of the B2B e-commerce landscape. We project continued strong growth driven by these positive factors. This report provides critical insights to businesses entering this market or those looking to optimize their B2B e-commerce strategies.
B2B E-Commerce Market Report: 2019-2033
This comprehensive report provides an in-depth analysis of the B2B e-commerce industry, projecting a market size exceeding $XX Million by 2033. It covers market structure, innovation trends, dynamics, dominant regions, product innovations, and leading players, offering actionable insights for businesses operating within this rapidly evolving sector. The study period spans 2019-2033, with a base year of 2025 and a forecast period of 2025-2033. Historical data from 2019-2024 is also included.
B2B E-Commerce Industry Market Structure & Innovation Trends
This section analyzes the competitive landscape of the B2B e-commerce market, focusing on market concentration, innovation drivers, regulatory frameworks, product substitutes, end-user demographics, and mergers and acquisitions (M&A) activity. The global B2B e-commerce market exhibits a moderately concentrated structure with key players holding significant market shares. For example, Alibaba Group holds an estimated xx% market share, followed by Amazon.com Inc. at xx%, and eBay Inc. at xx%. However, the market is dynamic, with numerous smaller players and ongoing M&A activity. Recent M&A deals, although specific values are unavailable for this report (estimated at $XX Million annually), indicate ongoing consolidation.
- Market Concentration: Moderately concentrated, with a few dominant players and numerous smaller participants.
- Innovation Drivers: Technological advancements (AI, big data analytics, blockchain), increasing demand for digitalization, and the need for efficient supply chain management.
- Regulatory Frameworks: Vary significantly by region, impacting cross-border e-commerce and data privacy.
- Product Substitutes: Traditional B2B sales channels remain significant competitors.
- End-User Demographics: The market is diverse, spanning various industries and company sizes.
- M&A Activities: Frequent M&A activity signals consolidation and strategic expansion within the sector.
B2B E-Commerce Industry Market Dynamics & Trends
The B2B e-commerce market is experiencing rapid growth, driven by several key factors. The increasing adoption of e-commerce platforms by businesses of all sizes is a major driver. Technological advancements, such as artificial intelligence (AI) and machine learning (ML), are enhancing efficiency and personalization, further boosting market growth. Consumer preferences for seamless online experiences and the need for improved supply chain management are also contributing to the market’s expansion. Competitive dynamics are intense, with both established players and new entrants vying for market share. The Compound Annual Growth Rate (CAGR) is projected to be xx% during the forecast period, with market penetration expected to reach xx% by 2033.
Dominant Regions & Segments in B2B E-Commerce Industry
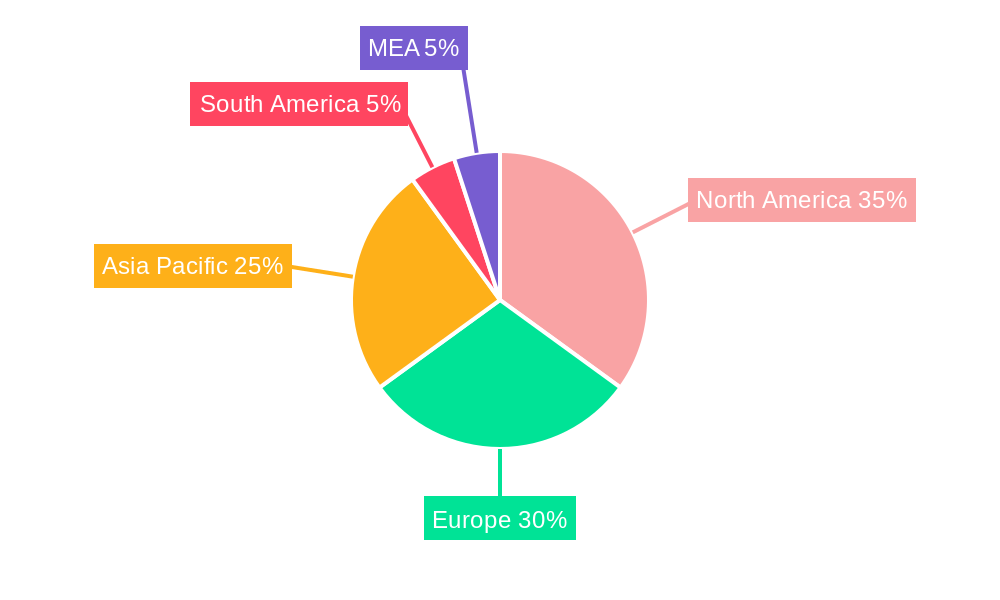
North America and Asia-Pacific currently dominate the B2B e-commerce market, driven by factors such as robust digital infrastructure, strong consumer spending, and supportive government policies. Within the channel segmentation, Marketplace Sales currently holds a larger market share than Direct Sales, although the gap is expected to narrow in coming years.
- Key Drivers in North America: Strong digital infrastructure, high consumer spending, and established e-commerce ecosystems.
- Key Drivers in Asia-Pacific: Rapid economic growth, increasing internet penetration, and a large and growing base of businesses adopting online sales.
- Marketplace Sales Dominance: The ease of use and access to a wider customer base drive the popularity of marketplace models.
- Direct Sales Growth: Businesses increasingly adopt direct-to-consumer (DTC) models for improved brand control and customer relationships.
B2B E-Commerce Industry Product Innovations
The B2B e-commerce industry is witnessing rapid product innovations, fueled by technological advancements. AI-powered personalization, predictive analytics for inventory management, and blockchain for secure transactions are transforming the industry. These innovations are enhancing customer experience, supply chain efficiency, and operational effectiveness. The market fit for these advancements is strong, given the growing demand for digitalization and efficient B2B operations.
Report Scope & Segmentation Analysis
This report segments the B2B e-commerce market by channel:
Direct Sales: This segment is expected to witness steady growth, driven by businesses seeking greater control over their brand and customer relationships. The market size for Direct Sales is projected to reach $XX Million by 2033. Competitive dynamics within this segment are characterized by a mix of established players and emerging entrants.
Marketplace Sales: This segment is currently the larger of the two, with strong growth projected due to the convenience and scalability offered by online marketplaces. The market size for Marketplace Sales is estimated at $XX Million in 2025, growing to $XX Million by 2033. Competition is fierce, with many established and emerging players.
Key Drivers of B2B E-Commerce Industry Growth
Several factors contribute to the growth of the B2B e-commerce industry:
- Technological Advancements: AI, big data, and automation are boosting efficiency and personalization.
- Increased Internet Penetration: The rising adoption of the internet across businesses worldwide facilitates online commerce.
- Government Initiatives: Supportive policies and initiatives in several regions promote digitalization.
- Cost Reduction: E-commerce platforms offer cost savings compared to traditional B2B sales.
Challenges in the B2B E-Commerce Industry Sector
Despite significant growth, the B2B e-commerce industry faces challenges:
- Cybersecurity Threats: The increasing reliance on digital platforms increases vulnerability to cyberattacks.
- Supply Chain Disruptions: Global supply chain issues impact delivery timelines and operational efficiency.
- Regulatory Compliance: Navigating diverse regulatory frameworks across different regions poses a hurdle.
- Competition: The highly competitive landscape requires continuous innovation and adaptation.
Emerging Opportunities in B2B E-Commerce Industry
Significant opportunities exist within the B2B e-commerce industry:
- Expansion into Emerging Markets: Untapped potential exists in regions with growing internet penetration and increasing business adoption of online platforms.
- Integration of Emerging Technologies: AI, blockchain, and IoT offer numerous opportunities for process optimization and enhanced customer experiences.
- Personalized Customer Experiences: Tailored solutions are critical to success in the increasingly competitive B2B e-commerce environment.
Leading Players in the B2B E-Commerce Industry Market
- DIYTrade.com
- IndiaMART InterMESH Ltd
- KOMPASS
- ChinaAseanTrade.com
- Flipkart
- Amazon.com Inc
- Alibaba Group
- eBay Inc
- eworldtrade.com
- Quill Lincolnshire Inc
Key Developments in B2B E-Commerce Industry
August 2022: Razer Merchant Services (RMS) partnered with Atome, expanding Buy Now Pay Later (BNPL) options for B2B transactions. This development reflects the growing demand for flexible payment solutions in B2B e-commerce.
July 2022: Golf Genius and RepSpark integrated their platforms, streamlining ordering processes for golf shop retailers. This improves efficiency and customer service within a niche B2B market.
Future Outlook for B2B E-Commerce Industry Market
The B2B e-commerce market exhibits substantial growth potential. Continued technological advancements, expanding internet access, and increasing business adoption of online sales channels will fuel market expansion. Strategic partnerships, innovative business models, and a focus on personalized customer experiences will be key factors in achieving success in this dynamic market. The long-term outlook is positive, with significant opportunities for growth and innovation.
B2B E-Commerce Industry Segmentation
-
1. Channel
- 1.1. Direct Sales
- 1.2. Marketplace Sales
B2B E-Commerce Industry Segmentation By Geography
- 1. North America
- 2. Europe
- 3. Asia Pacific
- 4. Latin America
- 5. Middle East and Africa
B2B E-Commerce Industry REPORT HIGHLIGHTS
| Aspects | Details |
|---|---|
| Study Period | 2019-2033 |
| Base Year | 2024 |
| Estimated Year | 2025 |
| Forecast Period | 2025-2033 |
| Historical Period | 2019-2024 |
| Growth Rate | CAGR of 12.36% from 2019-2033 |
| Segmentation |
|
Table of Contents
- 1. Introduction
- 1.1. Research Scope
- 1.2. Market Segmentation
- 1.3. Research Methodology
- 1.4. Definitions and Assumptions
- 2. Executive Summary
- 2.1. Introduction
- 3. Market Dynamics
- 3.1. Introduction
- 3.2. Market Drivers
- 3.2.1. Innovative Business Solutions and Increased digitalization in B2B e-commerce; Omnichannel Business Model
- 3.3. Market Restrains
- 3.3.1. Paid version of some applications can challenge further penetration
- 3.4. Market Trends
- 3.4.1. Increase in Digitalization across the B2B e-commerce is driving growth
- 4. Market Factor Analysis
- 4.1. Porters Five Forces
- 4.2. Supply/Value Chain
- 4.3. PESTEL analysis
- 4.4. Market Entropy
- 4.5. Patent/Trademark Analysis
- 5. Global B2B E-Commerce Industry Analysis, Insights and Forecast, 2019-2031
- 5.1. Market Analysis, Insights and Forecast - by Channel
- 5.1.1. Direct Sales
- 5.1.2. Marketplace Sales
- 5.2. Market Analysis, Insights and Forecast - by Region
- 5.2.1. North America
- 5.2.2. Europe
- 5.2.3. Asia Pacific
- 5.2.4. Latin America
- 5.2.5. Middle East and Africa
- 5.1. Market Analysis, Insights and Forecast - by Channel
- 6. North America B2B E-Commerce Industry Analysis, Insights and Forecast, 2019-2031
- 6.1. Market Analysis, Insights and Forecast - by Channel
- 6.1.1. Direct Sales
- 6.1.2. Marketplace Sales
- 6.1. Market Analysis, Insights and Forecast - by Channel
- 7. Europe B2B E-Commerce Industry Analysis, Insights and Forecast, 2019-2031
- 7.1. Market Analysis, Insights and Forecast - by Channel
- 7.1.1. Direct Sales
- 7.1.2. Marketplace Sales
- 7.1. Market Analysis, Insights and Forecast - by Channel
- 8. Asia Pacific B2B E-Commerce Industry Analysis, Insights and Forecast, 2019-2031
- 8.1. Market Analysis, Insights and Forecast - by Channel
- 8.1.1. Direct Sales
- 8.1.2. Marketplace Sales
- 8.1. Market Analysis, Insights and Forecast - by Channel
- 9. Latin America B2B E-Commerce Industry Analysis, Insights and Forecast, 2019-2031
- 9.1. Market Analysis, Insights and Forecast - by Channel
- 9.1.1. Direct Sales
- 9.1.2. Marketplace Sales
- 9.1. Market Analysis, Insights and Forecast - by Channel
- 10. Middle East and Africa B2B E-Commerce Industry Analysis, Insights and Forecast, 2019-2031
- 10.1. Market Analysis, Insights and Forecast - by Channel
- 10.1.1. Direct Sales
- 10.1.2. Marketplace Sales
- 10.1. Market Analysis, Insights and Forecast - by Channel
- 11. North America B2B E-Commerce Industry Analysis, Insights and Forecast, 2019-2031
- 11.1. Market Analysis, Insights and Forecast - By Country/Sub-region
- 11.1.1 United States
- 11.1.2 Canada
- 11.1.3 Mexico
- 12. Europe B2B E-Commerce Industry Analysis, Insights and Forecast, 2019-2031
- 12.1. Market Analysis, Insights and Forecast - By Country/Sub-region
- 12.1.1 Germany
- 12.1.2 United Kingdom
- 12.1.3 France
- 12.1.4 Spain
- 12.1.5 Italy
- 12.1.6 Spain
- 12.1.7 Belgium
- 12.1.8 Netherland
- 12.1.9 Nordics
- 12.1.10 Rest of Europe
- 13. Asia Pacific B2B E-Commerce Industry Analysis, Insights and Forecast, 2019-2031
- 13.1. Market Analysis, Insights and Forecast - By Country/Sub-region
- 13.1.1 China
- 13.1.2 Japan
- 13.1.3 India
- 13.1.4 South Korea
- 13.1.5 Southeast Asia
- 13.1.6 Australia
- 13.1.7 Indonesia
- 13.1.8 Phillipes
- 13.1.9 Singapore
- 13.1.10 Thailandc
- 13.1.11 Rest of Asia Pacific
- 14. South America B2B E-Commerce Industry Analysis, Insights and Forecast, 2019-2031
- 14.1. Market Analysis, Insights and Forecast - By Country/Sub-region
- 14.1.1 Brazil
- 14.1.2 Argentina
- 14.1.3 Peru
- 14.1.4 Chile
- 14.1.5 Colombia
- 14.1.6 Ecuador
- 14.1.7 Venezuela
- 14.1.8 Rest of South America
- 15. North America B2B E-Commerce Industry Analysis, Insights and Forecast, 2019-2031
- 15.1. Market Analysis, Insights and Forecast - By Country/Sub-region
- 15.1.1 United States
- 15.1.2 Canada
- 15.1.3 Mexico
- 16. MEA B2B E-Commerce Industry Analysis, Insights and Forecast, 2019-2031
- 16.1. Market Analysis, Insights and Forecast - By Country/Sub-region
- 16.1.1 United Arab Emirates
- 16.1.2 Saudi Arabia
- 16.1.3 South Africa
- 16.1.4 Rest of Middle East and Africa
- 17. Competitive Analysis
- 17.1. Global Market Share Analysis 2024
- 17.2. Company Profiles
- 17.2.1 DIYTrade com
- 17.2.1.1. Overview
- 17.2.1.2. Products
- 17.2.1.3. SWOT Analysis
- 17.2.1.4. Recent Developments
- 17.2.1.5. Financials (Based on Availability)
- 17.2.2 IndiaMART InterMESH Ltd
- 17.2.2.1. Overview
- 17.2.2.2. Products
- 17.2.2.3. SWOT Analysis
- 17.2.2.4. Recent Developments
- 17.2.2.5. Financials (Based on Availability)
- 17.2.3 KOMPASS
- 17.2.3.1. Overview
- 17.2.3.2. Products
- 17.2.3.3. SWOT Analysis
- 17.2.3.4. Recent Developments
- 17.2.3.5. Financials (Based on Availability)
- 17.2.4 ChinaAseanTrade com
- 17.2.4.1. Overview
- 17.2.4.2. Products
- 17.2.4.3. SWOT Analysis
- 17.2.4.4. Recent Developments
- 17.2.4.5. Financials (Based on Availability)
- 17.2.5 Flipkart
- 17.2.5.1. Overview
- 17.2.5.2. Products
- 17.2.5.3. SWOT Analysis
- 17.2.5.4. Recent Developments
- 17.2.5.5. Financials (Based on Availability)
- 17.2.6 Amazon com Inc
- 17.2.6.1. Overview
- 17.2.6.2. Products
- 17.2.6.3. SWOT Analysis
- 17.2.6.4. Recent Developments
- 17.2.6.5. Financials (Based on Availability)
- 17.2.7 Alibaba Group
- 17.2.7.1. Overview
- 17.2.7.2. Products
- 17.2.7.3. SWOT Analysis
- 17.2.7.4. Recent Developments
- 17.2.7.5. Financials (Based on Availability)
- 17.2.8 eBay Inc
- 17.2.8.1. Overview
- 17.2.8.2. Products
- 17.2.8.3. SWOT Analysis
- 17.2.8.4. Recent Developments
- 17.2.8.5. Financials (Based on Availability)
- 17.2.9 eworldtrade com
- 17.2.9.1. Overview
- 17.2.9.2. Products
- 17.2.9.3. SWOT Analysis
- 17.2.9.4. Recent Developments
- 17.2.9.5. Financials (Based on Availability)
- 17.2.10 Quill Lincolnshire Inc
- 17.2.10.1. Overview
- 17.2.10.2. Products
- 17.2.10.3. SWOT Analysis
- 17.2.10.4. Recent Developments
- 17.2.10.5. Financials (Based on Availability)
- 17.2.1 DIYTrade com
List of Figures
- Figure 1: Global B2B E-Commerce Industry Revenue Breakdown (Million, %) by Region 2024 & 2032
- Figure 2: Global B2B E-Commerce Industry Volume Breakdown (K Unit, %) by Region 2024 & 2032
- Figure 3: North America B2B E-Commerce Industry Revenue (Million), by Country 2024 & 2032
- Figure 4: North America B2B E-Commerce Industry Volume (K Unit), by Country 2024 & 2032
- Figure 5: North America B2B E-Commerce Industry Revenue Share (%), by Country 2024 & 2032
- Figure 6: North America B2B E-Commerce Industry Volume Share (%), by Country 2024 & 2032
- Figure 7: Europe B2B E-Commerce Industry Revenue (Million), by Country 2024 & 2032
- Figure 8: Europe B2B E-Commerce Industry Volume (K Unit), by Country 2024 & 2032
- Figure 9: Europe B2B E-Commerce Industry Revenue Share (%), by Country 2024 & 2032
- Figure 10: Europe B2B E-Commerce Industry Volume Share (%), by Country 2024 & 2032
- Figure 11: Asia Pacific B2B E-Commerce Industry Revenue (Million), by Country 2024 & 2032
- Figure 12: Asia Pacific B2B E-Commerce Industry Volume (K Unit), by Country 2024 & 2032
- Figure 13: Asia Pacific B2B E-Commerce Industry Revenue Share (%), by Country 2024 & 2032
- Figure 14: Asia Pacific B2B E-Commerce Industry Volume Share (%), by Country 2024 & 2032
- Figure 15: South America B2B E-Commerce Industry Revenue (Million), by Country 2024 & 2032
- Figure 16: South America B2B E-Commerce Industry Volume (K Unit), by Country 2024 & 2032
- Figure 17: South America B2B E-Commerce Industry Revenue Share (%), by Country 2024 & 2032
- Figure 18: South America B2B E-Commerce Industry Volume Share (%), by Country 2024 & 2032
- Figure 19: North America B2B E-Commerce Industry Revenue (Million), by Country 2024 & 2032
- Figure 20: North America B2B E-Commerce Industry Volume (K Unit), by Country 2024 & 2032
- Figure 21: North America B2B E-Commerce Industry Revenue Share (%), by Country 2024 & 2032
- Figure 22: North America B2B E-Commerce Industry Volume Share (%), by Country 2024 & 2032
- Figure 23: MEA B2B E-Commerce Industry Revenue (Million), by Country 2024 & 2032
- Figure 24: MEA B2B E-Commerce Industry Volume (K Unit), by Country 2024 & 2032
- Figure 25: MEA B2B E-Commerce Industry Revenue Share (%), by Country 2024 & 2032
- Figure 26: MEA B2B E-Commerce Industry Volume Share (%), by Country 2024 & 2032
- Figure 27: North America B2B E-Commerce Industry Revenue (Million), by Channel 2024 & 2032
- Figure 28: North America B2B E-Commerce Industry Volume (K Unit), by Channel 2024 & 2032
- Figure 29: North America B2B E-Commerce Industry Revenue Share (%), by Channel 2024 & 2032
- Figure 30: North America B2B E-Commerce Industry Volume Share (%), by Channel 2024 & 2032
- Figure 31: North America B2B E-Commerce Industry Revenue (Million), by Country 2024 & 2032
- Figure 32: North America B2B E-Commerce Industry Volume (K Unit), by Country 2024 & 2032
- Figure 33: North America B2B E-Commerce Industry Revenue Share (%), by Country 2024 & 2032
- Figure 34: North America B2B E-Commerce Industry Volume Share (%), by Country 2024 & 2032
- Figure 35: Europe B2B E-Commerce Industry Revenue (Million), by Channel 2024 & 2032
- Figure 36: Europe B2B E-Commerce Industry Volume (K Unit), by Channel 2024 & 2032
- Figure 37: Europe B2B E-Commerce Industry Revenue Share (%), by Channel 2024 & 2032
- Figure 38: Europe B2B E-Commerce Industry Volume Share (%), by Channel 2024 & 2032
- Figure 39: Europe B2B E-Commerce Industry Revenue (Million), by Country 2024 & 2032
- Figure 40: Europe B2B E-Commerce Industry Volume (K Unit), by Country 2024 & 2032
- Figure 41: Europe B2B E-Commerce Industry Revenue Share (%), by Country 2024 & 2032
- Figure 42: Europe B2B E-Commerce Industry Volume Share (%), by Country 2024 & 2032
- Figure 43: Asia Pacific B2B E-Commerce Industry Revenue (Million), by Channel 2024 & 2032
- Figure 44: Asia Pacific B2B E-Commerce Industry Volume (K Unit), by Channel 2024 & 2032
- Figure 45: Asia Pacific B2B E-Commerce Industry Revenue Share (%), by Channel 2024 & 2032
- Figure 46: Asia Pacific B2B E-Commerce Industry Volume Share (%), by Channel 2024 & 2032
- Figure 47: Asia Pacific B2B E-Commerce Industry Revenue (Million), by Country 2024 & 2032
- Figure 48: Asia Pacific B2B E-Commerce Industry Volume (K Unit), by Country 2024 & 2032
- Figure 49: Asia Pacific B2B E-Commerce Industry Revenue Share (%), by Country 2024 & 2032
- Figure 50: Asia Pacific B2B E-Commerce Industry Volume Share (%), by Country 2024 & 2032
- Figure 51: Latin America B2B E-Commerce Industry Revenue (Million), by Channel 2024 & 2032
- Figure 52: Latin America B2B E-Commerce Industry Volume (K Unit), by Channel 2024 & 2032
- Figure 53: Latin America B2B E-Commerce Industry Revenue Share (%), by Channel 2024 & 2032
- Figure 54: Latin America B2B E-Commerce Industry Volume Share (%), by Channel 2024 & 2032
- Figure 55: Latin America B2B E-Commerce Industry Revenue (Million), by Country 2024 & 2032
- Figure 56: Latin America B2B E-Commerce Industry Volume (K Unit), by Country 2024 & 2032
- Figure 57: Latin America B2B E-Commerce Industry Revenue Share (%), by Country 2024 & 2032
- Figure 58: Latin America B2B E-Commerce Industry Volume Share (%), by Country 2024 & 2032
- Figure 59: Middle East and Africa B2B E-Commerce Industry Revenue (Million), by Channel 2024 & 2032
- Figure 60: Middle East and Africa B2B E-Commerce Industry Volume (K Unit), by Channel 2024 & 2032
- Figure 61: Middle East and Africa B2B E-Commerce Industry Revenue Share (%), by Channel 2024 & 2032
- Figure 62: Middle East and Africa B2B E-Commerce Industry Volume Share (%), by Channel 2024 & 2032
- Figure 63: Middle East and Africa B2B E-Commerce Industry Revenue (Million), by Country 2024 & 2032
- Figure 64: Middle East and Africa B2B E-Commerce Industry Volume (K Unit), by Country 2024 & 2032
- Figure 65: Middle East and Africa B2B E-Commerce Industry Revenue Share (%), by Country 2024 & 2032
- Figure 66: Middle East and Africa B2B E-Commerce Industry Volume Share (%), by Country 2024 & 2032
List of Tables
- Table 1: Global B2B E-Commerce Industry Revenue Million Forecast, by Region 2019 & 2032
- Table 2: Global B2B E-Commerce Industry Volume K Unit Forecast, by Region 2019 & 2032
- Table 3: Global B2B E-Commerce Industry Revenue Million Forecast, by Channel 2019 & 2032
- Table 4: Global B2B E-Commerce Industry Volume K Unit Forecast, by Channel 2019 & 2032
- Table 5: Global B2B E-Commerce Industry Revenue Million Forecast, by Region 2019 & 2032
- Table 6: Global B2B E-Commerce Industry Volume K Unit Forecast, by Region 2019 & 2032
- Table 7: Global B2B E-Commerce Industry Revenue Million Forecast, by Country 2019 & 2032
- Table 8: Global B2B E-Commerce Industry Volume K Unit Forecast, by Country 2019 & 2032
- Table 9: United States B2B E-Commerce Industry Revenue (Million) Forecast, by Application 2019 & 2032
- Table 10: United States B2B E-Commerce Industry Volume (K Unit) Forecast, by Application 2019 & 2032
- Table 11: Canada B2B E-Commerce Industry Revenue (Million) Forecast, by Application 2019 & 2032
- Table 12: Canada B2B E-Commerce Industry Volume (K Unit) Forecast, by Application 2019 & 2032
- Table 13: Mexico B2B E-Commerce Industry Revenue (Million) Forecast, by Application 2019 & 2032
- Table 14: Mexico B2B E-Commerce Industry Volume (K Unit) Forecast, by Application 2019 & 2032
- Table 15: Global B2B E-Commerce Industry Revenue Million Forecast, by Country 2019 & 2032
- Table 16: Global B2B E-Commerce Industry Volume K Unit Forecast, by Country 2019 & 2032
- Table 17: Germany B2B E-Commerce Industry Revenue (Million) Forecast, by Application 2019 & 2032
- Table 18: Germany B2B E-Commerce Industry Volume (K Unit) Forecast, by Application 2019 & 2032
- Table 19: United Kingdom B2B E-Commerce Industry Revenue (Million) Forecast, by Application 2019 & 2032
- Table 20: United Kingdom B2B E-Commerce Industry Volume (K Unit) Forecast, by Application 2019 & 2032
- Table 21: France B2B E-Commerce Industry Revenue (Million) Forecast, by Application 2019 & 2032
- Table 22: France B2B E-Commerce Industry Volume (K Unit) Forecast, by Application 2019 & 2032
- Table 23: Spain B2B E-Commerce Industry Revenue (Million) Forecast, by Application 2019 & 2032
- Table 24: Spain B2B E-Commerce Industry Volume (K Unit) Forecast, by Application 2019 & 2032
- Table 25: Italy B2B E-Commerce Industry Revenue (Million) Forecast, by Application 2019 & 2032
- Table 26: Italy B2B E-Commerce Industry Volume (K Unit) Forecast, by Application 2019 & 2032
- Table 27: Spain B2B E-Commerce Industry Revenue (Million) Forecast, by Application 2019 & 2032
- Table 28: Spain B2B E-Commerce Industry Volume (K Unit) Forecast, by Application 2019 & 2032
- Table 29: Belgium B2B E-Commerce Industry Revenue (Million) Forecast, by Application 2019 & 2032
- Table 30: Belgium B2B E-Commerce Industry Volume (K Unit) Forecast, by Application 2019 & 2032
- Table 31: Netherland B2B E-Commerce Industry Revenue (Million) Forecast, by Application 2019 & 2032
- Table 32: Netherland B2B E-Commerce Industry Volume (K Unit) Forecast, by Application 2019 & 2032
- Table 33: Nordics B2B E-Commerce Industry Revenue (Million) Forecast, by Application 2019 & 2032
- Table 34: Nordics B2B E-Commerce Industry Volume (K Unit) Forecast, by Application 2019 & 2032
- Table 35: Rest of Europe B2B E-Commerce Industry Revenue (Million) Forecast, by Application 2019 & 2032
- Table 36: Rest of Europe B2B E-Commerce Industry Volume (K Unit) Forecast, by Application 2019 & 2032
- Table 37: Global B2B E-Commerce Industry Revenue Million Forecast, by Country 2019 & 2032
- Table 38: Global B2B E-Commerce Industry Volume K Unit Forecast, by Country 2019 & 2032
- Table 39: China B2B E-Commerce Industry Revenue (Million) Forecast, by Application 2019 & 2032
- Table 40: China B2B E-Commerce Industry Volume (K Unit) Forecast, by Application 2019 & 2032
- Table 41: Japan B2B E-Commerce Industry Revenue (Million) Forecast, by Application 2019 & 2032
- Table 42: Japan B2B E-Commerce Industry Volume (K Unit) Forecast, by Application 2019 & 2032
- Table 43: India B2B E-Commerce Industry Revenue (Million) Forecast, by Application 2019 & 2032
- Table 44: India B2B E-Commerce Industry Volume (K Unit) Forecast, by Application 2019 & 2032
- Table 45: South Korea B2B E-Commerce Industry Revenue (Million) Forecast, by Application 2019 & 2032
- Table 46: South Korea B2B E-Commerce Industry Volume (K Unit) Forecast, by Application 2019 & 2032
- Table 47: Southeast Asia B2B E-Commerce Industry Revenue (Million) Forecast, by Application 2019 & 2032
- Table 48: Southeast Asia B2B E-Commerce Industry Volume (K Unit) Forecast, by Application 2019 & 2032
- Table 49: Australia B2B E-Commerce Industry Revenue (Million) Forecast, by Application 2019 & 2032
- Table 50: Australia B2B E-Commerce Industry Volume (K Unit) Forecast, by Application 2019 & 2032
- Table 51: Indonesia B2B E-Commerce Industry Revenue (Million) Forecast, by Application 2019 & 2032
- Table 52: Indonesia B2B E-Commerce Industry Volume (K Unit) Forecast, by Application 2019 & 2032
- Table 53: Phillipes B2B E-Commerce Industry Revenue (Million) Forecast, by Application 2019 & 2032
- Table 54: Phillipes B2B E-Commerce Industry Volume (K Unit) Forecast, by Application 2019 & 2032
- Table 55: Singapore B2B E-Commerce Industry Revenue (Million) Forecast, by Application 2019 & 2032
- Table 56: Singapore B2B E-Commerce Industry Volume (K Unit) Forecast, by Application 2019 & 2032
- Table 57: Thailandc B2B E-Commerce Industry Revenue (Million) Forecast, by Application 2019 & 2032
- Table 58: Thailandc B2B E-Commerce Industry Volume (K Unit) Forecast, by Application 2019 & 2032
- Table 59: Rest of Asia Pacific B2B E-Commerce Industry Revenue (Million) Forecast, by Application 2019 & 2032
- Table 60: Rest of Asia Pacific B2B E-Commerce Industry Volume (K Unit) Forecast, by Application 2019 & 2032
- Table 61: Global B2B E-Commerce Industry Revenue Million Forecast, by Country 2019 & 2032
- Table 62: Global B2B E-Commerce Industry Volume K Unit Forecast, by Country 2019 & 2032
- Table 63: Brazil B2B E-Commerce Industry Revenue (Million) Forecast, by Application 2019 & 2032
- Table 64: Brazil B2B E-Commerce Industry Volume (K Unit) Forecast, by Application 2019 & 2032
- Table 65: Argentina B2B E-Commerce Industry Revenue (Million) Forecast, by Application 2019 & 2032
- Table 66: Argentina B2B E-Commerce Industry Volume (K Unit) Forecast, by Application 2019 & 2032
- Table 67: Peru B2B E-Commerce Industry Revenue (Million) Forecast, by Application 2019 & 2032
- Table 68: Peru B2B E-Commerce Industry Volume (K Unit) Forecast, by Application 2019 & 2032
- Table 69: Chile B2B E-Commerce Industry Revenue (Million) Forecast, by Application 2019 & 2032
- Table 70: Chile B2B E-Commerce Industry Volume (K Unit) Forecast, by Application 2019 & 2032
- Table 71: Colombia B2B E-Commerce Industry Revenue (Million) Forecast, by Application 2019 & 2032
- Table 72: Colombia B2B E-Commerce Industry Volume (K Unit) Forecast, by Application 2019 & 2032
- Table 73: Ecuador B2B E-Commerce Industry Revenue (Million) Forecast, by Application 2019 & 2032
- Table 74: Ecuador B2B E-Commerce Industry Volume (K Unit) Forecast, by Application 2019 & 2032
- Table 75: Venezuela B2B E-Commerce Industry Revenue (Million) Forecast, by Application 2019 & 2032
- Table 76: Venezuela B2B E-Commerce Industry Volume (K Unit) Forecast, by Application 2019 & 2032
- Table 77: Rest of South America B2B E-Commerce Industry Revenue (Million) Forecast, by Application 2019 & 2032
- Table 78: Rest of South America B2B E-Commerce Industry Volume (K Unit) Forecast, by Application 2019 & 2032
- Table 79: Global B2B E-Commerce Industry Revenue Million Forecast, by Country 2019 & 2032
- Table 80: Global B2B E-Commerce Industry Volume K Unit Forecast, by Country 2019 & 2032
- Table 81: United States B2B E-Commerce Industry Revenue (Million) Forecast, by Application 2019 & 2032
- Table 82: United States B2B E-Commerce Industry Volume (K Unit) Forecast, by Application 2019 & 2032
- Table 83: Canada B2B E-Commerce Industry Revenue (Million) Forecast, by Application 2019 & 2032
- Table 84: Canada B2B E-Commerce Industry Volume (K Unit) Forecast, by Application 2019 & 2032
- Table 85: Mexico B2B E-Commerce Industry Revenue (Million) Forecast, by Application 2019 & 2032
- Table 86: Mexico B2B E-Commerce Industry Volume (K Unit) Forecast, by Application 2019 & 2032
- Table 87: Global B2B E-Commerce Industry Revenue Million Forecast, by Country 2019 & 2032
- Table 88: Global B2B E-Commerce Industry Volume K Unit Forecast, by Country 2019 & 2032
- Table 89: United Arab Emirates B2B E-Commerce Industry Revenue (Million) Forecast, by Application 2019 & 2032
- Table 90: United Arab Emirates B2B E-Commerce Industry Volume (K Unit) Forecast, by Application 2019 & 2032
- Table 91: Saudi Arabia B2B E-Commerce Industry Revenue (Million) Forecast, by Application 2019 & 2032
- Table 92: Saudi Arabia B2B E-Commerce Industry Volume (K Unit) Forecast, by Application 2019 & 2032
- Table 93: South Africa B2B E-Commerce Industry Revenue (Million) Forecast, by Application 2019 & 2032
- Table 94: South Africa B2B E-Commerce Industry Volume (K Unit) Forecast, by Application 2019 & 2032
- Table 95: Rest of Middle East and Africa B2B E-Commerce Industry Revenue (Million) Forecast, by Application 2019 & 2032
- Table 96: Rest of Middle East and Africa B2B E-Commerce Industry Volume (K Unit) Forecast, by Application 2019 & 2032
- Table 97: Global B2B E-Commerce Industry Revenue Million Forecast, by Channel 2019 & 2032
- Table 98: Global B2B E-Commerce Industry Volume K Unit Forecast, by Channel 2019 & 2032
- Table 99: Global B2B E-Commerce Industry Revenue Million Forecast, by Country 2019 & 2032
- Table 100: Global B2B E-Commerce Industry Volume K Unit Forecast, by Country 2019 & 2032
- Table 101: Global B2B E-Commerce Industry Revenue Million Forecast, by Channel 2019 & 2032
- Table 102: Global B2B E-Commerce Industry Volume K Unit Forecast, by Channel 2019 & 2032
- Table 103: Global B2B E-Commerce Industry Revenue Million Forecast, by Country 2019 & 2032
- Table 104: Global B2B E-Commerce Industry Volume K Unit Forecast, by Country 2019 & 2032
- Table 105: Global B2B E-Commerce Industry Revenue Million Forecast, by Channel 2019 & 2032
- Table 106: Global B2B E-Commerce Industry Volume K Unit Forecast, by Channel 2019 & 2032
- Table 107: Global B2B E-Commerce Industry Revenue Million Forecast, by Country 2019 & 2032
- Table 108: Global B2B E-Commerce Industry Volume K Unit Forecast, by Country 2019 & 2032
- Table 109: Global B2B E-Commerce Industry Revenue Million Forecast, by Channel 2019 & 2032
- Table 110: Global B2B E-Commerce Industry Volume K Unit Forecast, by Channel 2019 & 2032
- Table 111: Global B2B E-Commerce Industry Revenue Million Forecast, by Country 2019 & 2032
- Table 112: Global B2B E-Commerce Industry Volume K Unit Forecast, by Country 2019 & 2032
- Table 113: Global B2B E-Commerce Industry Revenue Million Forecast, by Channel 2019 & 2032
- Table 114: Global B2B E-Commerce Industry Volume K Unit Forecast, by Channel 2019 & 2032
- Table 115: Global B2B E-Commerce Industry Revenue Million Forecast, by Country 2019 & 2032
- Table 116: Global B2B E-Commerce Industry Volume K Unit Forecast, by Country 2019 & 2032
Frequently Asked Questions
1. What is the projected Compound Annual Growth Rate (CAGR) of the B2B E-Commerce Industry?
The projected CAGR is approximately 12.36%.
2. Which companies are prominent players in the B2B E-Commerce Industry?
Key companies in the market include DIYTrade com, IndiaMART InterMESH Ltd, KOMPASS, ChinaAseanTrade com, Flipkart, Amazon com Inc, Alibaba Group, eBay Inc, eworldtrade com, Quill Lincolnshire Inc.
3. What are the main segments of the B2B E-Commerce Industry?
The market segments include Channel.
4. Can you provide details about the market size?
The market size is estimated to be USD XX Million as of 2022.
5. What are some drivers contributing to market growth?
Innovative Business Solutions and Increased digitalization in B2B e-commerce; Omnichannel Business Model.
6. What are the notable trends driving market growth?
Increase in Digitalization across the B2B e-commerce is driving growth.
7. Are there any restraints impacting market growth?
Paid version of some applications can challenge further penetration.
8. Can you provide examples of recent developments in the market?
August 2022 - Razer Merchant Services (RMS), the B2B arm of Razer Fintech, partnered with Atome, an Asia-based Buy Now Pay Later (BNPL) service. This partnership is aimed to enable flexible deferred payment acceptance during checkout at online and offline RMS merchants.
9. What pricing options are available for accessing the report?
Pricing options include single-user, multi-user, and enterprise licenses priced at USD 4750, USD 5250, and USD 8750 respectively.
10. Is the market size provided in terms of value or volume?
The market size is provided in terms of value, measured in Million and volume, measured in K Unit.
11. Are there any specific market keywords associated with the report?
Yes, the market keyword associated with the report is "B2B E-Commerce Industry," which aids in identifying and referencing the specific market segment covered.
12. How do I determine which pricing option suits my needs best?
The pricing options vary based on user requirements and access needs. Individual users may opt for single-user licenses, while businesses requiring broader access may choose multi-user or enterprise licenses for cost-effective access to the report.
13. Are there any additional resources or data provided in the B2B E-Commerce Industry report?
While the report offers comprehensive insights, it's advisable to review the specific contents or supplementary materials provided to ascertain if additional resources or data are available.
14. How can I stay updated on further developments or reports in the B2B E-Commerce Industry?
To stay informed about further developments, trends, and reports in the B2B E-Commerce Industry, consider subscribing to industry newsletters, following relevant companies and organizations, or regularly checking reputable industry news sources and publications.
Methodology
Step 1 - Identification of Relevant Samples Size from Population Database


Step 2 - Approaches for Defining Global Market Size (Value, Volume* & Price*)

Note*: In applicable scenarios
Step 3 - Data Sources
Primary Research
- Web Analytics
- Survey Reports
- Research Institute
- Latest Research Reports
- Opinion Leaders
Secondary Research
- Annual Reports
- White Paper
- Latest Press Release
- Industry Association
- Paid Database
- Investor Presentations

Step 4 - Data Triangulation
Involves using different sources of information in order to increase the validity of a study
These sources are likely to be stakeholders in a program - participants, other researchers, program staff, other community members, and so on.
Then we put all data in single framework & apply various statistical tools to find out the dynamic on the market.
During the analysis stage, feedback from the stakeholder groups would be compared to determine areas of agreement as well as areas of divergence


