
Key Insights
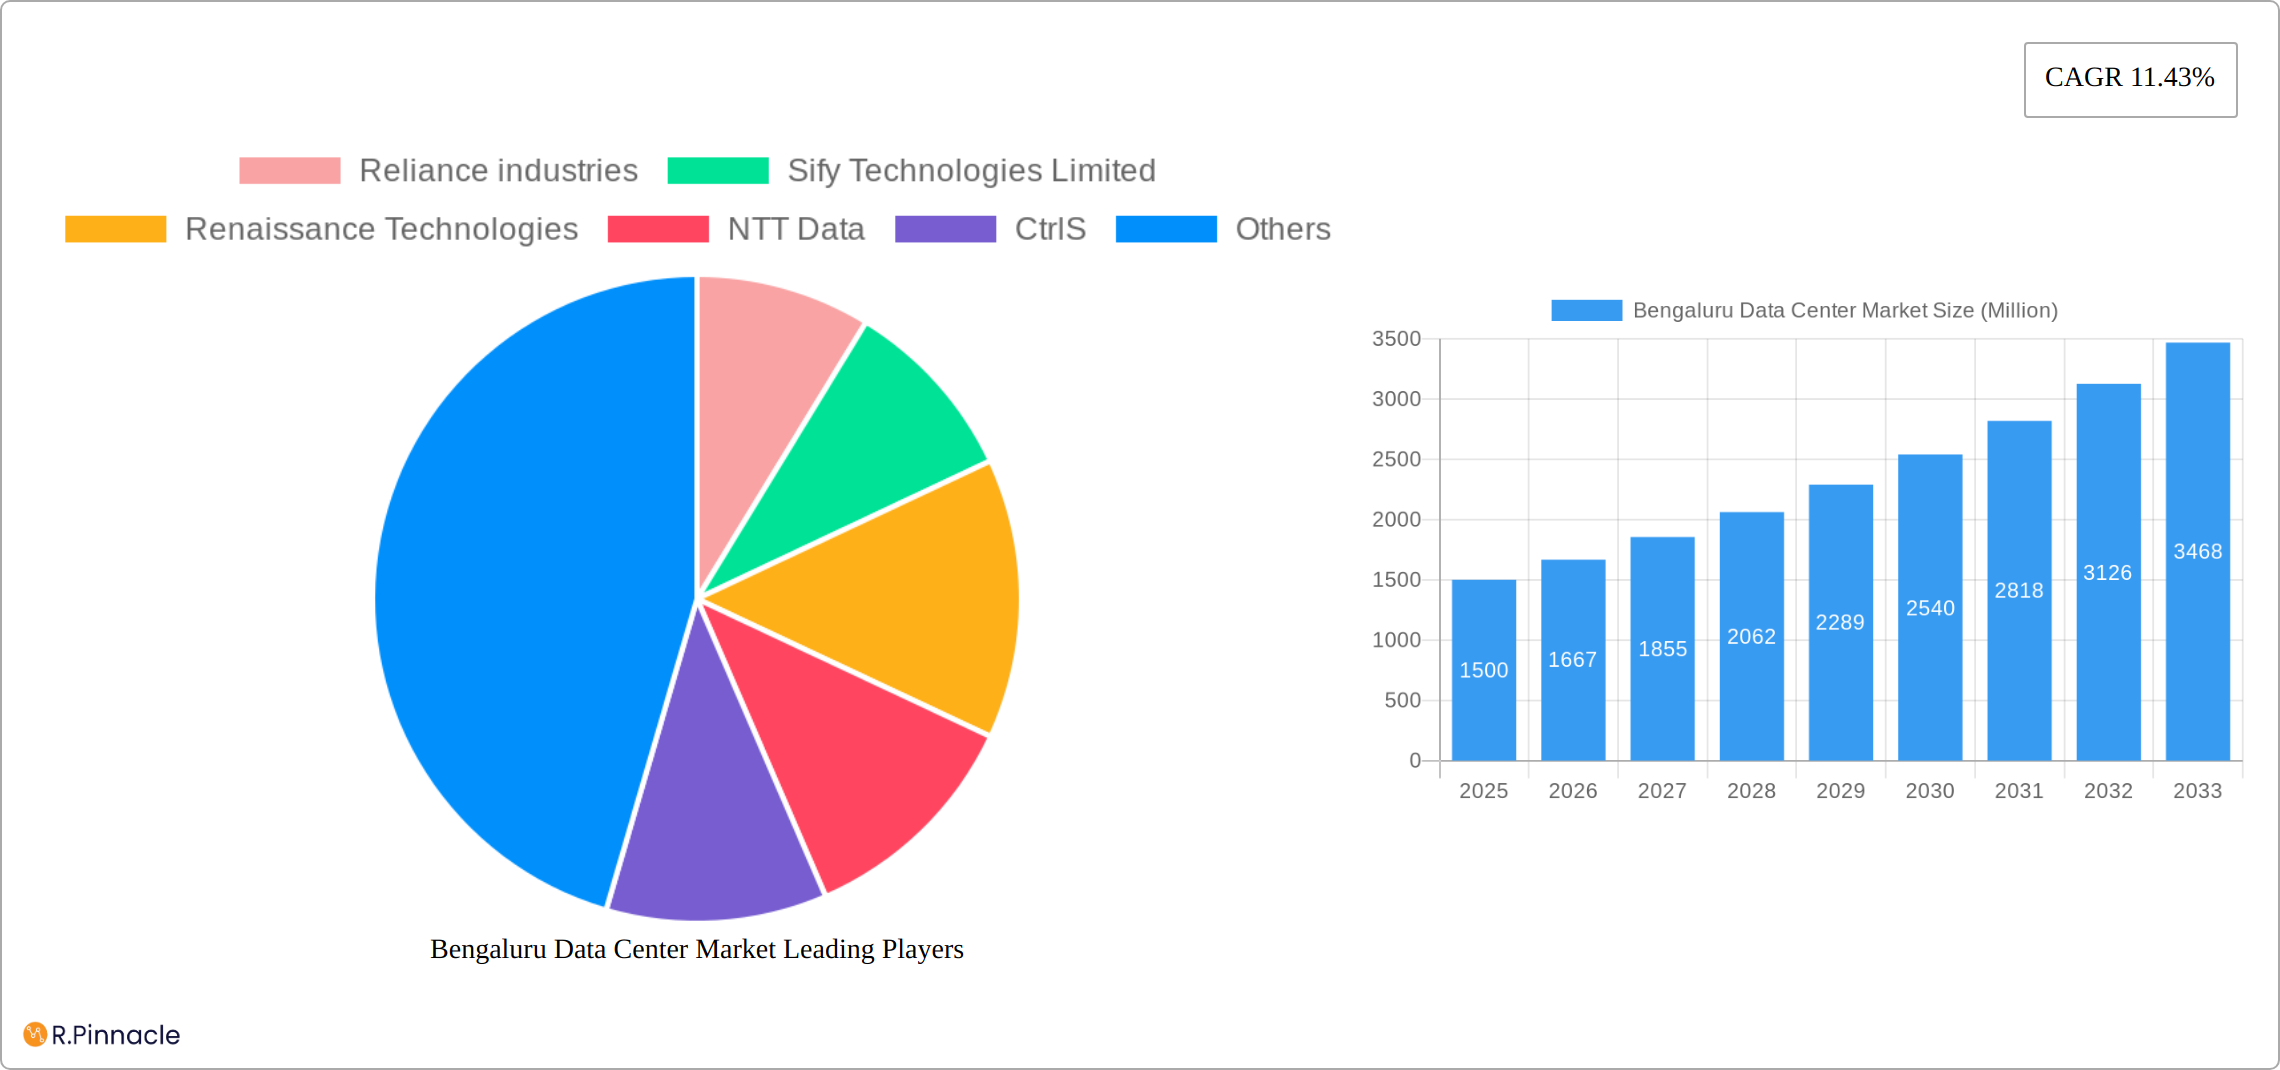
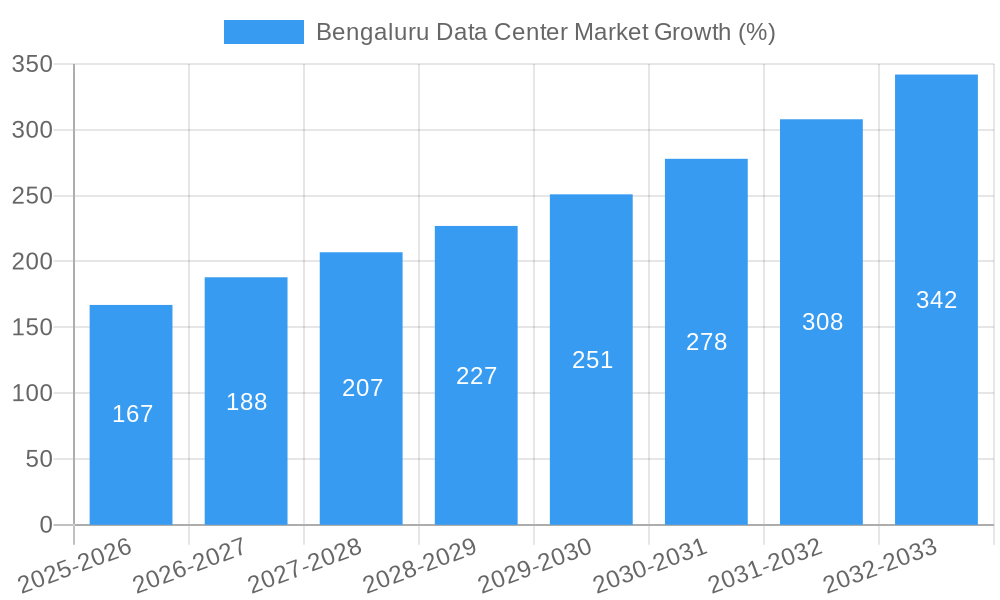
The Bengaluru data center market is experiencing robust growth, driven by a surge in digital transformation initiatives, the burgeoning IT sector, and increasing cloud adoption across various industries. A compound annual growth rate (CAGR) of 11.43% from 2019 to 2024 suggests a significant expansion, and this positive trajectory is expected to continue through 2033. The market is segmented by tier type (Tier 1, Tier 2, Tier 3, Tier 4), absorption (utilized, non-utilized), colocation type (retail, wholesale, hyperscale), end-user (cloud & IT, telecom, media & entertainment, government, BFSI, manufacturing, e-commerce, others), and data center size (small, medium, large, massive, mega). Key players like Reliance Industries, Sify Technologies, NTT Data, CtrlS, and Nxtra Data are actively shaping the market landscape, investing in infrastructure and services to meet the rising demand. The strong presence of major IT companies and a supportive government policy further fuels this growth. While specific market size figures are not provided, the high CAGR and involvement of major players imply a substantial and rapidly expanding market with significant investment opportunities. Competition is likely intense, particularly in the hyperscale and wholesale colocation segments. Future growth will depend on factors such as infrastructure development, power availability, and government regulations supporting the industry.
The continued growth in the Bengaluru data center market is fueled by several key factors. The city's established reputation as a major IT hub attracts significant investment in data center infrastructure. The increasing demand for cloud services and digital transformation across industries creates a substantial need for data center capacity. Furthermore, the strategic location of Bengaluru, combined with a relatively skilled workforce, makes it an attractive location for both domestic and international companies to establish their data center operations. However, challenges remain including the need for consistent power supply, managing land acquisition costs, and navigating regulatory frameworks. Nonetheless, the long-term outlook for the Bengaluru data center market remains exceptionally positive, with considerable growth potential in the coming years.
Bengaluru Data Center Market Report: 2019-2033
This comprehensive report provides a detailed analysis of the Bengaluru data center market, offering invaluable insights for industry professionals, investors, and strategists. Covering the period 2019-2033, with a base year of 2025 and a forecast period of 2025-2033, this report leverages extensive data analysis and expert insights to illuminate the market's structure, dynamics, and future potential.
Bengaluru Data Center Market Structure & Innovation Trends
This section analyzes the competitive landscape of the Bengaluru data center market, focusing on market concentration, innovation drivers, regulatory frameworks, and M&A activities. The report examines the market share held by key players, including Reliance Industries, Sify Technologies Limited, Renaissance Technologies, NTT Data, CtrlS, Nxtra Data Limited, STT Telemedia, ESDS Software Solutions Company, and Tulip Data Center Services Private Limited (list not exhaustive). The analysis includes an assessment of the market share (in MW) for each company. Further, it explores the influence of regulatory frameworks on market growth, the impact of substitute products, and the demographics of end-users. M&A activity is analyzed, including deal values and their effects on market consolidation. The report also identifies key innovation drivers, such as advancements in cloud computing, AI, and IoT, and their impact on market growth. It provides a detailed understanding of the market's structure, paving the way for strategic decision-making.
Bengaluru Data Center Market Dynamics & Trends
This section delves into the market's dynamic nature, examining growth drivers, technological disruptions, consumer preferences, and competitive dynamics. It incorporates key metrics such as CAGR and market penetration to illustrate the market's growth trajectory. The analysis encompasses the impact of factors like increasing data consumption, the rise of cloud computing, and the growing adoption of hyperscale data centers. It also explores the influence of technological disruptions, such as the emergence of edge computing and new cooling technologies, and examines shifting consumer preferences toward energy-efficient and sustainable data center solutions. The competitive dynamics are assessed, highlighting strategies employed by leading players to maintain their market position. The report provides a comprehensive understanding of the market's evolving trends, enabling strategic planning for future success. The CAGR for the forecast period is projected to be xx%. Market penetration in the utilized segment is estimated at xx% by 2033.
Dominant Regions & Segments in Bengaluru Data Center Market
This section identifies the leading regions, segments, and drivers within the Bengaluru data center market. Using a detailed analysis across multiple segments, this section identifies the dominant segments.
By Tier Type: The report analyzes the market share and growth prospects of Tier 1, Tier 2, and Tier 3 data centers. The dominance of a specific tier is analyzed, considering factors like cost, resilience, and infrastructure availability.
By Absorption: The report examines the market size and growth trends of utilized and non-utilized capacity, identifying the factors contributing to the dominance of one over the other.
By Colocation Type: This section analyzes the market share and growth potential of retail, wholesale, and hyperscale colocation services, highlighting the drivers for dominance in each type.
By End User: The report assesses the market share and growth trajectory of each end-user segment: Cloud & IT, Telecom, Media & Entertainment, Government, BFSI, Manufacturing, E-commerce, and Other End Users. The reasons behind the dominance of a specific segment are explored.
By DC Size: The analysis covers Small, Medium, Large, Massive, and Mega data center sizes, identifying the most prevalent size and the factors that contribute to its dominance.
Economic policies supporting the IT sector, robust infrastructure, and a skilled workforce are significant drivers of dominance in specific regions and segments.
Bengaluru Data Center Market Product Innovations
This section summarizes recent product developments, applications, and their competitive advantages within the Bengaluru data center market. The focus is on technological trends, such as advancements in energy efficiency, cooling technologies, and security features. The report also analyzes the market fit of these innovations, assessing their impact on market competitiveness and consumer preferences. The analysis highlights the adoption of innovative technologies like AI-powered monitoring systems and improved power usage effectiveness (PUE) to enhance efficiency and sustainability.
Report Scope & Segmentation Analysis
This report segments the Bengaluru data center market across various parameters: Tier Type (Tier 1, Tier 2, Tier 3), Absorption (Utilized, Non-Utilized), Colocation Type (Retail, Wholesale, Hyperscale), End User (Cloud & IT, Telecom, Media & Entertainment, Government, BFSI, Manufacturing, E-commerce, Other End Users), and DC Size (Small, Medium, Large, Massive, Mega). Each segment's growth projections, market size (in Million USD), and competitive dynamics are analyzed, offering a comprehensive overview of the market's structure and potential. For each segment, the report provides an in-depth analysis of market size, growth projections, and competitive dynamics, explaining the reasons for observed differences in growth patterns.
Key Drivers of Bengaluru Data Center Market Growth
The Bengaluru data center market is driven by several factors. The expanding IT and cloud computing sectors, increasing data consumption, and the government's initiatives promoting digitalization are major growth catalysts. Furthermore, the availability of skilled manpower and relatively lower operational costs compared to other global locations make Bengaluru an attractive destination for data center investments. These factors have created a significant demand for data center facilities, leading to substantial market growth.
Challenges in the Bengaluru Data Center Market Sector
The Bengaluru data center market faces challenges like land scarcity and high real estate costs, which can lead to increased operational expenses. The sector also grapples with power supply constraints, requiring substantial investments in backup power infrastructure. Regulatory complexities and competition from established players also pose challenges to new entrants. These factors can significantly impact the market's growth trajectory. For example, land scarcity contributes to a xx% increase in infrastructure costs.
Emerging Opportunities in Bengaluru Data Center Market
Emerging opportunities in the Bengaluru data center market include the increasing adoption of edge computing, demand for energy-efficient solutions, and the growth of hyperscale data centers. Government initiatives supporting the digital economy create further opportunities. The increasing focus on sustainability and the rise of AI and machine learning also present growth avenues. These trends suggest a bright future for innovative solutions within the market.
Leading Players in the Bengaluru Data Center Market Market
- Reliance Industries
- Sify Technologies Limited
- Renaissance Technologies
- NTT Data
- CtrlS
- Nxtra Data Limited
- STT Telemedia
- ESDS Software Solutions Company
- Tulip Data Center Services Private Limited
- List Not Exhaustive
The report further provides a detailed market share analysis (in terms of MW) for these companies.
Key Developments in Bengaluru Data Center Market Industry
March 2023: The Web Werks and Iron Mountain Data Centres Joint Venture (IMDC) opened their first data center in Bengaluru's Whitefield neighborhood, a 4MW, Tier III facility. This development strengthens Bengaluru's position as a data center hub in Southern India.
April 2022: Web Werks and Teleindia Networks invested approximately USD 95.8 Million and USD 12.8 Million respectively, in setting up data center units in Bangalore. This highlights the continued investment in the Bengaluru data center market.
Future Outlook for Bengaluru Data Center Market Market
The Bengaluru data center market exhibits strong growth potential, driven by the burgeoning IT sector, increasing digitalization, and supportive government policies. The demand for cloud services, hyperscale data centers, and edge computing will continue to fuel market expansion. Strategic investments in infrastructure and innovative technologies will be crucial for players seeking to capitalize on these opportunities. The market is projected to witness significant growth in the coming years, offering lucrative prospects for investors and businesses.
Bengaluru Data Center Market Segmentation
-
1. DC Size
- 1.1. Small
- 1.2. Medium
- 1.3. Large
- 1.4. Massive
- 1.5. Mega
-
2. Tier Type
- 2.1. Tier 1 & 2
- 2.2. Tier 3
- 2.3. Tier 4
-
3. Absorption
-
3.1. Utilized
-
3.1.1. By Colocation Type
- 3.1.1.1. Retail
- 3.1.1.2. Wholescale
- 3.1.1.3. Hyperscale
-
3.1.2. By End User
- 3.1.2.1. Cloud & IT
- 3.1.2.2. Telecom
- 3.1.2.3. Media & Entertainment
- 3.1.2.4. Government
- 3.1.2.5. BFSI
- 3.1.2.6. Manufacturing
- 3.1.2.7. E-Commerce
- 3.1.2.8. Other End Users
-
3.1.1. By Colocation Type
- 3.2. Non-Utilized
-
3.1. Utilized
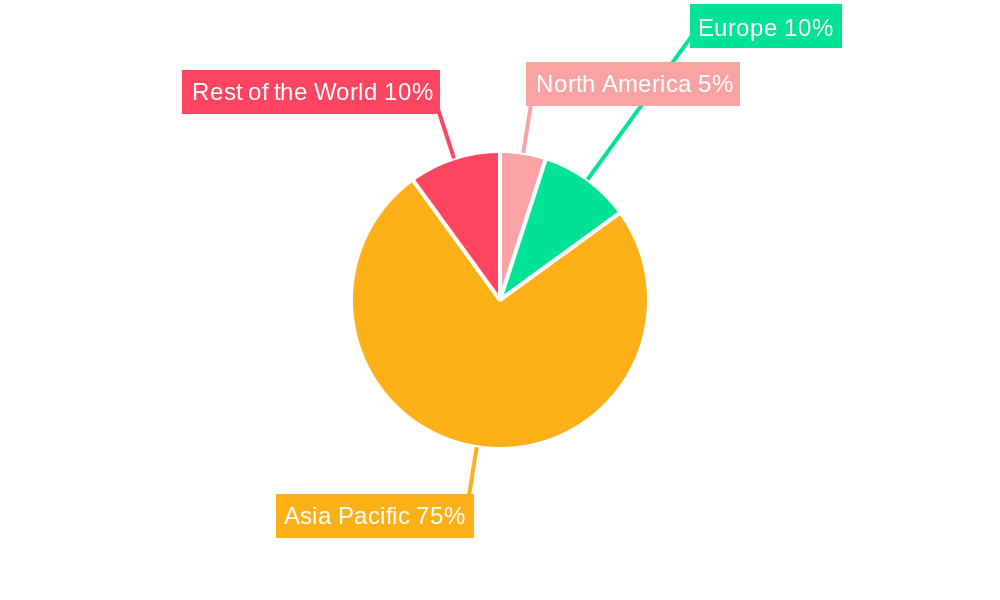
Bengaluru Data Center Market Segmentation By Geography
-
1. North America
- 1.1. United States
- 1.2. Canada
- 1.3. Mexico
-
2. South America
- 2.1. Brazil
- 2.2. Argentina
- 2.3. Rest of South America
-
3. Europe
- 3.1. United Kingdom
- 3.2. Germany
- 3.3. France
- 3.4. Italy
- 3.5. Spain
- 3.6. Russia
- 3.7. Benelux
- 3.8. Nordics
- 3.9. Rest of Europe
-
4. Middle East & Africa
- 4.1. Turkey
- 4.2. Israel
- 4.3. GCC
- 4.4. North Africa
- 4.5. South Africa
- 4.6. Rest of Middle East & Africa
-
5. Asia Pacific
- 5.1. China
- 5.2. India
- 5.3. Japan
- 5.4. South Korea
- 5.5. ASEAN
- 5.6. Oceania
- 5.7. Rest of Asia Pacific
Bengaluru Data Center Market REPORT HIGHLIGHTS
| Aspects | Details |
|---|---|
| Study Period | 2019-2033 |
| Base Year | 2024 |
| Estimated Year | 2025 |
| Forecast Period | 2025-2033 |
| Historical Period | 2019-2024 |
| Growth Rate | CAGR of 11.43% from 2019-2033 |
| Segmentation |
|
Table of Contents
- 1. Introduction
- 1.1. Research Scope
- 1.2. Market Segmentation
- 1.3. Research Methodology
- 1.4. Definitions and Assumptions
- 2. Executive Summary
- 2.1. Introduction
- 3. Market Dynamics
- 3.1. Introduction
- 3.2. Market Drivers
- 3.2.1. Reduction in Power Consumption With the Use of Silicon Photonics Based Transceivers; Growing Need for High-Speed Connectivity and High Data Transfer Capabilities Across Data Centers
- 3.3. Market Restrains
- 3.3.1. Risk of Thermal Effect
- 3.4. Market Trends
- 3.4.1. Government policies would advance the Investment of Data Centre
- 4. Market Factor Analysis
- 4.1. Porters Five Forces
- 4.2. Supply/Value Chain
- 4.3. PESTEL analysis
- 4.4. Market Entropy
- 4.5. Patent/Trademark Analysis
- 5. Global Bengaluru Data Center Market Analysis, Insights and Forecast, 2019-2031
- 5.1. Market Analysis, Insights and Forecast - by DC Size
- 5.1.1. Small
- 5.1.2. Medium
- 5.1.3. Large
- 5.1.4. Massive
- 5.1.5. Mega
- 5.2. Market Analysis, Insights and Forecast - by Tier Type
- 5.2.1. Tier 1 & 2
- 5.2.2. Tier 3
- 5.2.3. Tier 4
- 5.3. Market Analysis, Insights and Forecast - by Absorption
- 5.3.1. Utilized
- 5.3.1.1. By Colocation Type
- 5.3.1.1.1. Retail
- 5.3.1.1.2. Wholescale
- 5.3.1.1.3. Hyperscale
- 5.3.1.2. By End User
- 5.3.1.2.1. Cloud & IT
- 5.3.1.2.2. Telecom
- 5.3.1.2.3. Media & Entertainment
- 5.3.1.2.4. Government
- 5.3.1.2.5. BFSI
- 5.3.1.2.6. Manufacturing
- 5.3.1.2.7. E-Commerce
- 5.3.1.2.8. Other End Users
- 5.3.1.1. By Colocation Type
- 5.3.2. Non-Utilized
- 5.3.1. Utilized
- 5.4. Market Analysis, Insights and Forecast - by Region
- 5.4.1. North America
- 5.4.2. South America
- 5.4.3. Europe
- 5.4.4. Middle East & Africa
- 5.4.5. Asia Pacific
- 5.1. Market Analysis, Insights and Forecast - by DC Size
- 6. North America Bengaluru Data Center Market Analysis, Insights and Forecast, 2019-2031
- 6.1. Market Analysis, Insights and Forecast - by DC Size
- 6.1.1. Small
- 6.1.2. Medium
- 6.1.3. Large
- 6.1.4. Massive
- 6.1.5. Mega
- 6.2. Market Analysis, Insights and Forecast - by Tier Type
- 6.2.1. Tier 1 & 2
- 6.2.2. Tier 3
- 6.2.3. Tier 4
- 6.3. Market Analysis, Insights and Forecast - by Absorption
- 6.3.1. Utilized
- 6.3.1.1. By Colocation Type
- 6.3.1.1.1. Retail
- 6.3.1.1.2. Wholescale
- 6.3.1.1.3. Hyperscale
- 6.3.1.2. By End User
- 6.3.1.2.1. Cloud & IT
- 6.3.1.2.2. Telecom
- 6.3.1.2.3. Media & Entertainment
- 6.3.1.2.4. Government
- 6.3.1.2.5. BFSI
- 6.3.1.2.6. Manufacturing
- 6.3.1.2.7. E-Commerce
- 6.3.1.2.8. Other End Users
- 6.3.1.1. By Colocation Type
- 6.3.2. Non-Utilized
- 6.3.1. Utilized
- 6.1. Market Analysis, Insights and Forecast - by DC Size
- 7. South America Bengaluru Data Center Market Analysis, Insights and Forecast, 2019-2031
- 7.1. Market Analysis, Insights and Forecast - by DC Size
- 7.1.1. Small
- 7.1.2. Medium
- 7.1.3. Large
- 7.1.4. Massive
- 7.1.5. Mega
- 7.2. Market Analysis, Insights and Forecast - by Tier Type
- 7.2.1. Tier 1 & 2
- 7.2.2. Tier 3
- 7.2.3. Tier 4
- 7.3. Market Analysis, Insights and Forecast - by Absorption
- 7.3.1. Utilized
- 7.3.1.1. By Colocation Type
- 7.3.1.1.1. Retail
- 7.3.1.1.2. Wholescale
- 7.3.1.1.3. Hyperscale
- 7.3.1.2. By End User
- 7.3.1.2.1. Cloud & IT
- 7.3.1.2.2. Telecom
- 7.3.1.2.3. Media & Entertainment
- 7.3.1.2.4. Government
- 7.3.1.2.5. BFSI
- 7.3.1.2.6. Manufacturing
- 7.3.1.2.7. E-Commerce
- 7.3.1.2.8. Other End Users
- 7.3.1.1. By Colocation Type
- 7.3.2. Non-Utilized
- 7.3.1. Utilized
- 7.1. Market Analysis, Insights and Forecast - by DC Size
- 8. Europe Bengaluru Data Center Market Analysis, Insights and Forecast, 2019-2031
- 8.1. Market Analysis, Insights and Forecast - by DC Size
- 8.1.1. Small
- 8.1.2. Medium
- 8.1.3. Large
- 8.1.4. Massive
- 8.1.5. Mega
- 8.2. Market Analysis, Insights and Forecast - by Tier Type
- 8.2.1. Tier 1 & 2
- 8.2.2. Tier 3
- 8.2.3. Tier 4
- 8.3. Market Analysis, Insights and Forecast - by Absorption
- 8.3.1. Utilized
- 8.3.1.1. By Colocation Type
- 8.3.1.1.1. Retail
- 8.3.1.1.2. Wholescale
- 8.3.1.1.3. Hyperscale
- 8.3.1.2. By End User
- 8.3.1.2.1. Cloud & IT
- 8.3.1.2.2. Telecom
- 8.3.1.2.3. Media & Entertainment
- 8.3.1.2.4. Government
- 8.3.1.2.5. BFSI
- 8.3.1.2.6. Manufacturing
- 8.3.1.2.7. E-Commerce
- 8.3.1.2.8. Other End Users
- 8.3.1.1. By Colocation Type
- 8.3.2. Non-Utilized
- 8.3.1. Utilized
- 8.1. Market Analysis, Insights and Forecast - by DC Size
- 9. Middle East & Africa Bengaluru Data Center Market Analysis, Insights and Forecast, 2019-2031
- 9.1. Market Analysis, Insights and Forecast - by DC Size
- 9.1.1. Small
- 9.1.2. Medium
- 9.1.3. Large
- 9.1.4. Massive
- 9.1.5. Mega
- 9.2. Market Analysis, Insights and Forecast - by Tier Type
- 9.2.1. Tier 1 & 2
- 9.2.2. Tier 3
- 9.2.3. Tier 4
- 9.3. Market Analysis, Insights and Forecast - by Absorption
- 9.3.1. Utilized
- 9.3.1.1. By Colocation Type
- 9.3.1.1.1. Retail
- 9.3.1.1.2. Wholescale
- 9.3.1.1.3. Hyperscale
- 9.3.1.2. By End User
- 9.3.1.2.1. Cloud & IT
- 9.3.1.2.2. Telecom
- 9.3.1.2.3. Media & Entertainment
- 9.3.1.2.4. Government
- 9.3.1.2.5. BFSI
- 9.3.1.2.6. Manufacturing
- 9.3.1.2.7. E-Commerce
- 9.3.1.2.8. Other End Users
- 9.3.1.1. By Colocation Type
- 9.3.2. Non-Utilized
- 9.3.1. Utilized
- 9.1. Market Analysis, Insights and Forecast - by DC Size
- 10. Asia Pacific Bengaluru Data Center Market Analysis, Insights and Forecast, 2019-2031
- 10.1. Market Analysis, Insights and Forecast - by DC Size
- 10.1.1. Small
- 10.1.2. Medium
- 10.1.3. Large
- 10.1.4. Massive
- 10.1.5. Mega
- 10.2. Market Analysis, Insights and Forecast - by Tier Type
- 10.2.1. Tier 1 & 2
- 10.2.2. Tier 3
- 10.2.3. Tier 4
- 10.3. Market Analysis, Insights and Forecast - by Absorption
- 10.3.1. Utilized
- 10.3.1.1. By Colocation Type
- 10.3.1.1.1. Retail
- 10.3.1.1.2. Wholescale
- 10.3.1.1.3. Hyperscale
- 10.3.1.2. By End User
- 10.3.1.2.1. Cloud & IT
- 10.3.1.2.2. Telecom
- 10.3.1.2.3. Media & Entertainment
- 10.3.1.2.4. Government
- 10.3.1.2.5. BFSI
- 10.3.1.2.6. Manufacturing
- 10.3.1.2.7. E-Commerce
- 10.3.1.2.8. Other End Users
- 10.3.1.1. By Colocation Type
- 10.3.2. Non-Utilized
- 10.3.1. Utilized
- 10.1. Market Analysis, Insights and Forecast - by DC Size
- 11. North America Bengaluru Data Center Market Analysis, Insights and Forecast, 2019-2031
- 11.1. Market Analysis, Insights and Forecast - By Country/Sub-region
- 11.1.1.
- 12. Europe Bengaluru Data Center Market Analysis, Insights and Forecast, 2019-2031
- 12.1. Market Analysis, Insights and Forecast - By Country/Sub-region
- 12.1.1.
- 13. Asia Pacific Bengaluru Data Center Market Analysis, Insights and Forecast, 2019-2031
- 13.1. Market Analysis, Insights and Forecast - By Country/Sub-region
- 13.1.1.
- 14. Rest of the World Bengaluru Data Center Market Analysis, Insights and Forecast, 2019-2031
- 14.1. Market Analysis, Insights and Forecast - By Country/Sub-region
- 14.1.1.
- 15. Competitive Analysis
- 15.1. Global Market Share Analysis 2024
- 15.2. Company Profiles
- 15.2.1 Reliance industries
- 15.2.1.1. Overview
- 15.2.1.2. Products
- 15.2.1.3. SWOT Analysis
- 15.2.1.4. Recent Developments
- 15.2.1.5. Financials (Based on Availability)
- 15.2.2 Sify Technologies Limited
- 15.2.2.1. Overview
- 15.2.2.2. Products
- 15.2.2.3. SWOT Analysis
- 15.2.2.4. Recent Developments
- 15.2.2.5. Financials (Based on Availability)
- 15.2.3 Renaissance Technologies
- 15.2.3.1. Overview
- 15.2.3.2. Products
- 15.2.3.3. SWOT Analysis
- 15.2.3.4. Recent Developments
- 15.2.3.5. Financials (Based on Availability)
- 15.2.4 NTT Data
- 15.2.4.1. Overview
- 15.2.4.2. Products
- 15.2.4.3. SWOT Analysis
- 15.2.4.4. Recent Developments
- 15.2.4.5. Financials (Based on Availability)
- 15.2.5 CtrlS
- 15.2.5.1. Overview
- 15.2.5.2. Products
- 15.2.5.3. SWOT Analysis
- 15.2.5.4. Recent Developments
- 15.2.5.5. Financials (Based on Availability)
- 15.2.6 Nxtra Data Limited
- 15.2.6.1. Overview
- 15.2.6.2. Products
- 15.2.6.3. SWOT Analysis
- 15.2.6.4. Recent Developments
- 15.2.6.5. Financials (Based on Availability)
- 15.2.7 STT Telemedia
- 15.2.7.1. Overview
- 15.2.7.2. Products
- 15.2.7.3. SWOT Analysis
- 15.2.7.4. Recent Developments
- 15.2.7.5. Financials (Based on Availability)
- 15.2.8 ESDS Software Solutions Company
- 15.2.8.1. Overview
- 15.2.8.2. Products
- 15.2.8.3. SWOT Analysis
- 15.2.8.4. Recent Developments
- 15.2.8.5. Financials (Based on Availability)
- 15.2.9 Tulip Data Center Services Private Limited*List Not Exhaustive 7 2 Market share analysis (In terms of MW)7 3 List of Companie
- 15.2.9.1. Overview
- 15.2.9.2. Products
- 15.2.9.3. SWOT Analysis
- 15.2.9.4. Recent Developments
- 15.2.9.5. Financials (Based on Availability)
- 15.2.1 Reliance industries
List of Figures
- Figure 1: Global Bengaluru Data Center Market Revenue Breakdown (Million, %) by Region 2024 & 2032
- Figure 2: Global Bengaluru Data Center Market Volume Breakdown (megawatt, %) by Region 2024 & 2032
- Figure 3: North America Bengaluru Data Center Market Revenue (Million), by Country 2024 & 2032
- Figure 4: North America Bengaluru Data Center Market Volume (megawatt), by Country 2024 & 2032
- Figure 5: North America Bengaluru Data Center Market Revenue Share (%), by Country 2024 & 2032
- Figure 6: North America Bengaluru Data Center Market Volume Share (%), by Country 2024 & 2032
- Figure 7: Europe Bengaluru Data Center Market Revenue (Million), by Country 2024 & 2032
- Figure 8: Europe Bengaluru Data Center Market Volume (megawatt), by Country 2024 & 2032
- Figure 9: Europe Bengaluru Data Center Market Revenue Share (%), by Country 2024 & 2032
- Figure 10: Europe Bengaluru Data Center Market Volume Share (%), by Country 2024 & 2032
- Figure 11: Asia Pacific Bengaluru Data Center Market Revenue (Million), by Country 2024 & 2032
- Figure 12: Asia Pacific Bengaluru Data Center Market Volume (megawatt), by Country 2024 & 2032
- Figure 13: Asia Pacific Bengaluru Data Center Market Revenue Share (%), by Country 2024 & 2032
- Figure 14: Asia Pacific Bengaluru Data Center Market Volume Share (%), by Country 2024 & 2032
- Figure 15: Rest of the World Bengaluru Data Center Market Revenue (Million), by Country 2024 & 2032
- Figure 16: Rest of the World Bengaluru Data Center Market Volume (megawatt), by Country 2024 & 2032
- Figure 17: Rest of the World Bengaluru Data Center Market Revenue Share (%), by Country 2024 & 2032
- Figure 18: Rest of the World Bengaluru Data Center Market Volume Share (%), by Country 2024 & 2032
- Figure 19: North America Bengaluru Data Center Market Revenue (Million), by DC Size 2024 & 2032
- Figure 20: North America Bengaluru Data Center Market Volume (megawatt), by DC Size 2024 & 2032
- Figure 21: North America Bengaluru Data Center Market Revenue Share (%), by DC Size 2024 & 2032
- Figure 22: North America Bengaluru Data Center Market Volume Share (%), by DC Size 2024 & 2032
- Figure 23: North America Bengaluru Data Center Market Revenue (Million), by Tier Type 2024 & 2032
- Figure 24: North America Bengaluru Data Center Market Volume (megawatt), by Tier Type 2024 & 2032
- Figure 25: North America Bengaluru Data Center Market Revenue Share (%), by Tier Type 2024 & 2032
- Figure 26: North America Bengaluru Data Center Market Volume Share (%), by Tier Type 2024 & 2032
- Figure 27: North America Bengaluru Data Center Market Revenue (Million), by Absorption 2024 & 2032
- Figure 28: North America Bengaluru Data Center Market Volume (megawatt), by Absorption 2024 & 2032
- Figure 29: North America Bengaluru Data Center Market Revenue Share (%), by Absorption 2024 & 2032
- Figure 30: North America Bengaluru Data Center Market Volume Share (%), by Absorption 2024 & 2032
- Figure 31: North America Bengaluru Data Center Market Revenue (Million), by Country 2024 & 2032
- Figure 32: North America Bengaluru Data Center Market Volume (megawatt), by Country 2024 & 2032
- Figure 33: North America Bengaluru Data Center Market Revenue Share (%), by Country 2024 & 2032
- Figure 34: North America Bengaluru Data Center Market Volume Share (%), by Country 2024 & 2032
- Figure 35: South America Bengaluru Data Center Market Revenue (Million), by DC Size 2024 & 2032
- Figure 36: South America Bengaluru Data Center Market Volume (megawatt), by DC Size 2024 & 2032
- Figure 37: South America Bengaluru Data Center Market Revenue Share (%), by DC Size 2024 & 2032
- Figure 38: South America Bengaluru Data Center Market Volume Share (%), by DC Size 2024 & 2032
- Figure 39: South America Bengaluru Data Center Market Revenue (Million), by Tier Type 2024 & 2032
- Figure 40: South America Bengaluru Data Center Market Volume (megawatt), by Tier Type 2024 & 2032
- Figure 41: South America Bengaluru Data Center Market Revenue Share (%), by Tier Type 2024 & 2032
- Figure 42: South America Bengaluru Data Center Market Volume Share (%), by Tier Type 2024 & 2032
- Figure 43: South America Bengaluru Data Center Market Revenue (Million), by Absorption 2024 & 2032
- Figure 44: South America Bengaluru Data Center Market Volume (megawatt), by Absorption 2024 & 2032
- Figure 45: South America Bengaluru Data Center Market Revenue Share (%), by Absorption 2024 & 2032
- Figure 46: South America Bengaluru Data Center Market Volume Share (%), by Absorption 2024 & 2032
- Figure 47: South America Bengaluru Data Center Market Revenue (Million), by Country 2024 & 2032
- Figure 48: South America Bengaluru Data Center Market Volume (megawatt), by Country 2024 & 2032
- Figure 49: South America Bengaluru Data Center Market Revenue Share (%), by Country 2024 & 2032
- Figure 50: South America Bengaluru Data Center Market Volume Share (%), by Country 2024 & 2032
- Figure 51: Europe Bengaluru Data Center Market Revenue (Million), by DC Size 2024 & 2032
- Figure 52: Europe Bengaluru Data Center Market Volume (megawatt), by DC Size 2024 & 2032
- Figure 53: Europe Bengaluru Data Center Market Revenue Share (%), by DC Size 2024 & 2032
- Figure 54: Europe Bengaluru Data Center Market Volume Share (%), by DC Size 2024 & 2032
- Figure 55: Europe Bengaluru Data Center Market Revenue (Million), by Tier Type 2024 & 2032
- Figure 56: Europe Bengaluru Data Center Market Volume (megawatt), by Tier Type 2024 & 2032
- Figure 57: Europe Bengaluru Data Center Market Revenue Share (%), by Tier Type 2024 & 2032
- Figure 58: Europe Bengaluru Data Center Market Volume Share (%), by Tier Type 2024 & 2032
- Figure 59: Europe Bengaluru Data Center Market Revenue (Million), by Absorption 2024 & 2032
- Figure 60: Europe Bengaluru Data Center Market Volume (megawatt), by Absorption 2024 & 2032
- Figure 61: Europe Bengaluru Data Center Market Revenue Share (%), by Absorption 2024 & 2032
- Figure 62: Europe Bengaluru Data Center Market Volume Share (%), by Absorption 2024 & 2032
- Figure 63: Europe Bengaluru Data Center Market Revenue (Million), by Country 2024 & 2032
- Figure 64: Europe Bengaluru Data Center Market Volume (megawatt), by Country 2024 & 2032
- Figure 65: Europe Bengaluru Data Center Market Revenue Share (%), by Country 2024 & 2032
- Figure 66: Europe Bengaluru Data Center Market Volume Share (%), by Country 2024 & 2032
- Figure 67: Middle East & Africa Bengaluru Data Center Market Revenue (Million), by DC Size 2024 & 2032
- Figure 68: Middle East & Africa Bengaluru Data Center Market Volume (megawatt), by DC Size 2024 & 2032
- Figure 69: Middle East & Africa Bengaluru Data Center Market Revenue Share (%), by DC Size 2024 & 2032
- Figure 70: Middle East & Africa Bengaluru Data Center Market Volume Share (%), by DC Size 2024 & 2032
- Figure 71: Middle East & Africa Bengaluru Data Center Market Revenue (Million), by Tier Type 2024 & 2032
- Figure 72: Middle East & Africa Bengaluru Data Center Market Volume (megawatt), by Tier Type 2024 & 2032
- Figure 73: Middle East & Africa Bengaluru Data Center Market Revenue Share (%), by Tier Type 2024 & 2032
- Figure 74: Middle East & Africa Bengaluru Data Center Market Volume Share (%), by Tier Type 2024 & 2032
- Figure 75: Middle East & Africa Bengaluru Data Center Market Revenue (Million), by Absorption 2024 & 2032
- Figure 76: Middle East & Africa Bengaluru Data Center Market Volume (megawatt), by Absorption 2024 & 2032
- Figure 77: Middle East & Africa Bengaluru Data Center Market Revenue Share (%), by Absorption 2024 & 2032
- Figure 78: Middle East & Africa Bengaluru Data Center Market Volume Share (%), by Absorption 2024 & 2032
- Figure 79: Middle East & Africa Bengaluru Data Center Market Revenue (Million), by Country 2024 & 2032
- Figure 80: Middle East & Africa Bengaluru Data Center Market Volume (megawatt), by Country 2024 & 2032
- Figure 81: Middle East & Africa Bengaluru Data Center Market Revenue Share (%), by Country 2024 & 2032
- Figure 82: Middle East & Africa Bengaluru Data Center Market Volume Share (%), by Country 2024 & 2032
- Figure 83: Asia Pacific Bengaluru Data Center Market Revenue (Million), by DC Size 2024 & 2032
- Figure 84: Asia Pacific Bengaluru Data Center Market Volume (megawatt), by DC Size 2024 & 2032
- Figure 85: Asia Pacific Bengaluru Data Center Market Revenue Share (%), by DC Size 2024 & 2032
- Figure 86: Asia Pacific Bengaluru Data Center Market Volume Share (%), by DC Size 2024 & 2032
- Figure 87: Asia Pacific Bengaluru Data Center Market Revenue (Million), by Tier Type 2024 & 2032
- Figure 88: Asia Pacific Bengaluru Data Center Market Volume (megawatt), by Tier Type 2024 & 2032
- Figure 89: Asia Pacific Bengaluru Data Center Market Revenue Share (%), by Tier Type 2024 & 2032
- Figure 90: Asia Pacific Bengaluru Data Center Market Volume Share (%), by Tier Type 2024 & 2032
- Figure 91: Asia Pacific Bengaluru Data Center Market Revenue (Million), by Absorption 2024 & 2032
- Figure 92: Asia Pacific Bengaluru Data Center Market Volume (megawatt), by Absorption 2024 & 2032
- Figure 93: Asia Pacific Bengaluru Data Center Market Revenue Share (%), by Absorption 2024 & 2032
- Figure 94: Asia Pacific Bengaluru Data Center Market Volume Share (%), by Absorption 2024 & 2032
- Figure 95: Asia Pacific Bengaluru Data Center Market Revenue (Million), by Country 2024 & 2032
- Figure 96: Asia Pacific Bengaluru Data Center Market Volume (megawatt), by Country 2024 & 2032
- Figure 97: Asia Pacific Bengaluru Data Center Market Revenue Share (%), by Country 2024 & 2032
- Figure 98: Asia Pacific Bengaluru Data Center Market Volume Share (%), by Country 2024 & 2032
List of Tables
- Table 1: Global Bengaluru Data Center Market Revenue Million Forecast, by Region 2019 & 2032
- Table 2: Global Bengaluru Data Center Market Volume megawatt Forecast, by Region 2019 & 2032
- Table 3: Global Bengaluru Data Center Market Revenue Million Forecast, by DC Size 2019 & 2032
- Table 4: Global Bengaluru Data Center Market Volume megawatt Forecast, by DC Size 2019 & 2032
- Table 5: Global Bengaluru Data Center Market Revenue Million Forecast, by Tier Type 2019 & 2032
- Table 6: Global Bengaluru Data Center Market Volume megawatt Forecast, by Tier Type 2019 & 2032
- Table 7: Global Bengaluru Data Center Market Revenue Million Forecast, by Absorption 2019 & 2032
- Table 8: Global Bengaluru Data Center Market Volume megawatt Forecast, by Absorption 2019 & 2032
- Table 9: Global Bengaluru Data Center Market Revenue Million Forecast, by Region 2019 & 2032
- Table 10: Global Bengaluru Data Center Market Volume megawatt Forecast, by Region 2019 & 2032
- Table 11: Global Bengaluru Data Center Market Revenue Million Forecast, by Country 2019 & 2032
- Table 12: Global Bengaluru Data Center Market Volume megawatt Forecast, by Country 2019 & 2032
- Table 13: Bengaluru Data Center Market Revenue (Million) Forecast, by Application 2019 & 2032
- Table 14: Bengaluru Data Center Market Volume (megawatt) Forecast, by Application 2019 & 2032
- Table 15: Global Bengaluru Data Center Market Revenue Million Forecast, by Country 2019 & 2032
- Table 16: Global Bengaluru Data Center Market Volume megawatt Forecast, by Country 2019 & 2032
- Table 17: Bengaluru Data Center Market Revenue (Million) Forecast, by Application 2019 & 2032
- Table 18: Bengaluru Data Center Market Volume (megawatt) Forecast, by Application 2019 & 2032
- Table 19: Global Bengaluru Data Center Market Revenue Million Forecast, by Country 2019 & 2032
- Table 20: Global Bengaluru Data Center Market Volume megawatt Forecast, by Country 2019 & 2032
- Table 21: Bengaluru Data Center Market Revenue (Million) Forecast, by Application 2019 & 2032
- Table 22: Bengaluru Data Center Market Volume (megawatt) Forecast, by Application 2019 & 2032
- Table 23: Global Bengaluru Data Center Market Revenue Million Forecast, by Country 2019 & 2032
- Table 24: Global Bengaluru Data Center Market Volume megawatt Forecast, by Country 2019 & 2032
- Table 25: Bengaluru Data Center Market Revenue (Million) Forecast, by Application 2019 & 2032
- Table 26: Bengaluru Data Center Market Volume (megawatt) Forecast, by Application 2019 & 2032
- Table 27: Global Bengaluru Data Center Market Revenue Million Forecast, by DC Size 2019 & 2032
- Table 28: Global Bengaluru Data Center Market Volume megawatt Forecast, by DC Size 2019 & 2032
- Table 29: Global Bengaluru Data Center Market Revenue Million Forecast, by Tier Type 2019 & 2032
- Table 30: Global Bengaluru Data Center Market Volume megawatt Forecast, by Tier Type 2019 & 2032
- Table 31: Global Bengaluru Data Center Market Revenue Million Forecast, by Absorption 2019 & 2032
- Table 32: Global Bengaluru Data Center Market Volume megawatt Forecast, by Absorption 2019 & 2032
- Table 33: Global Bengaluru Data Center Market Revenue Million Forecast, by Country 2019 & 2032
- Table 34: Global Bengaluru Data Center Market Volume megawatt Forecast, by Country 2019 & 2032
- Table 35: United States Bengaluru Data Center Market Revenue (Million) Forecast, by Application 2019 & 2032
- Table 36: United States Bengaluru Data Center Market Volume (megawatt) Forecast, by Application 2019 & 2032
- Table 37: Canada Bengaluru Data Center Market Revenue (Million) Forecast, by Application 2019 & 2032
- Table 38: Canada Bengaluru Data Center Market Volume (megawatt) Forecast, by Application 2019 & 2032
- Table 39: Mexico Bengaluru Data Center Market Revenue (Million) Forecast, by Application 2019 & 2032
- Table 40: Mexico Bengaluru Data Center Market Volume (megawatt) Forecast, by Application 2019 & 2032
- Table 41: Global Bengaluru Data Center Market Revenue Million Forecast, by DC Size 2019 & 2032
- Table 42: Global Bengaluru Data Center Market Volume megawatt Forecast, by DC Size 2019 & 2032
- Table 43: Global Bengaluru Data Center Market Revenue Million Forecast, by Tier Type 2019 & 2032
- Table 44: Global Bengaluru Data Center Market Volume megawatt Forecast, by Tier Type 2019 & 2032
- Table 45: Global Bengaluru Data Center Market Revenue Million Forecast, by Absorption 2019 & 2032
- Table 46: Global Bengaluru Data Center Market Volume megawatt Forecast, by Absorption 2019 & 2032
- Table 47: Global Bengaluru Data Center Market Revenue Million Forecast, by Country 2019 & 2032
- Table 48: Global Bengaluru Data Center Market Volume megawatt Forecast, by Country 2019 & 2032
- Table 49: Brazil Bengaluru Data Center Market Revenue (Million) Forecast, by Application 2019 & 2032
- Table 50: Brazil Bengaluru Data Center Market Volume (megawatt) Forecast, by Application 2019 & 2032
- Table 51: Argentina Bengaluru Data Center Market Revenue (Million) Forecast, by Application 2019 & 2032
- Table 52: Argentina Bengaluru Data Center Market Volume (megawatt) Forecast, by Application 2019 & 2032
- Table 53: Rest of South America Bengaluru Data Center Market Revenue (Million) Forecast, by Application 2019 & 2032
- Table 54: Rest of South America Bengaluru Data Center Market Volume (megawatt) Forecast, by Application 2019 & 2032
- Table 55: Global Bengaluru Data Center Market Revenue Million Forecast, by DC Size 2019 & 2032
- Table 56: Global Bengaluru Data Center Market Volume megawatt Forecast, by DC Size 2019 & 2032
- Table 57: Global Bengaluru Data Center Market Revenue Million Forecast, by Tier Type 2019 & 2032
- Table 58: Global Bengaluru Data Center Market Volume megawatt Forecast, by Tier Type 2019 & 2032
- Table 59: Global Bengaluru Data Center Market Revenue Million Forecast, by Absorption 2019 & 2032
- Table 60: Global Bengaluru Data Center Market Volume megawatt Forecast, by Absorption 2019 & 2032
- Table 61: Global Bengaluru Data Center Market Revenue Million Forecast, by Country 2019 & 2032
- Table 62: Global Bengaluru Data Center Market Volume megawatt Forecast, by Country 2019 & 2032
- Table 63: United Kingdom Bengaluru Data Center Market Revenue (Million) Forecast, by Application 2019 & 2032
- Table 64: United Kingdom Bengaluru Data Center Market Volume (megawatt) Forecast, by Application 2019 & 2032
- Table 65: Germany Bengaluru Data Center Market Revenue (Million) Forecast, by Application 2019 & 2032
- Table 66: Germany Bengaluru Data Center Market Volume (megawatt) Forecast, by Application 2019 & 2032
- Table 67: France Bengaluru Data Center Market Revenue (Million) Forecast, by Application 2019 & 2032
- Table 68: France Bengaluru Data Center Market Volume (megawatt) Forecast, by Application 2019 & 2032
- Table 69: Italy Bengaluru Data Center Market Revenue (Million) Forecast, by Application 2019 & 2032
- Table 70: Italy Bengaluru Data Center Market Volume (megawatt) Forecast, by Application 2019 & 2032
- Table 71: Spain Bengaluru Data Center Market Revenue (Million) Forecast, by Application 2019 & 2032
- Table 72: Spain Bengaluru Data Center Market Volume (megawatt) Forecast, by Application 2019 & 2032
- Table 73: Russia Bengaluru Data Center Market Revenue (Million) Forecast, by Application 2019 & 2032
- Table 74: Russia Bengaluru Data Center Market Volume (megawatt) Forecast, by Application 2019 & 2032
- Table 75: Benelux Bengaluru Data Center Market Revenue (Million) Forecast, by Application 2019 & 2032
- Table 76: Benelux Bengaluru Data Center Market Volume (megawatt) Forecast, by Application 2019 & 2032
- Table 77: Nordics Bengaluru Data Center Market Revenue (Million) Forecast, by Application 2019 & 2032
- Table 78: Nordics Bengaluru Data Center Market Volume (megawatt) Forecast, by Application 2019 & 2032
- Table 79: Rest of Europe Bengaluru Data Center Market Revenue (Million) Forecast, by Application 2019 & 2032
- Table 80: Rest of Europe Bengaluru Data Center Market Volume (megawatt) Forecast, by Application 2019 & 2032
- Table 81: Global Bengaluru Data Center Market Revenue Million Forecast, by DC Size 2019 & 2032
- Table 82: Global Bengaluru Data Center Market Volume megawatt Forecast, by DC Size 2019 & 2032
- Table 83: Global Bengaluru Data Center Market Revenue Million Forecast, by Tier Type 2019 & 2032
- Table 84: Global Bengaluru Data Center Market Volume megawatt Forecast, by Tier Type 2019 & 2032
- Table 85: Global Bengaluru Data Center Market Revenue Million Forecast, by Absorption 2019 & 2032
- Table 86: Global Bengaluru Data Center Market Volume megawatt Forecast, by Absorption 2019 & 2032
- Table 87: Global Bengaluru Data Center Market Revenue Million Forecast, by Country 2019 & 2032
- Table 88: Global Bengaluru Data Center Market Volume megawatt Forecast, by Country 2019 & 2032
- Table 89: Turkey Bengaluru Data Center Market Revenue (Million) Forecast, by Application 2019 & 2032
- Table 90: Turkey Bengaluru Data Center Market Volume (megawatt) Forecast, by Application 2019 & 2032
- Table 91: Israel Bengaluru Data Center Market Revenue (Million) Forecast, by Application 2019 & 2032
- Table 92: Israel Bengaluru Data Center Market Volume (megawatt) Forecast, by Application 2019 & 2032
- Table 93: GCC Bengaluru Data Center Market Revenue (Million) Forecast, by Application 2019 & 2032
- Table 94: GCC Bengaluru Data Center Market Volume (megawatt) Forecast, by Application 2019 & 2032
- Table 95: North Africa Bengaluru Data Center Market Revenue (Million) Forecast, by Application 2019 & 2032
- Table 96: North Africa Bengaluru Data Center Market Volume (megawatt) Forecast, by Application 2019 & 2032
- Table 97: South Africa Bengaluru Data Center Market Revenue (Million) Forecast, by Application 2019 & 2032
- Table 98: South Africa Bengaluru Data Center Market Volume (megawatt) Forecast, by Application 2019 & 2032
- Table 99: Rest of Middle East & Africa Bengaluru Data Center Market Revenue (Million) Forecast, by Application 2019 & 2032
- Table 100: Rest of Middle East & Africa Bengaluru Data Center Market Volume (megawatt) Forecast, by Application 2019 & 2032
- Table 101: Global Bengaluru Data Center Market Revenue Million Forecast, by DC Size 2019 & 2032
- Table 102: Global Bengaluru Data Center Market Volume megawatt Forecast, by DC Size 2019 & 2032
- Table 103: Global Bengaluru Data Center Market Revenue Million Forecast, by Tier Type 2019 & 2032
- Table 104: Global Bengaluru Data Center Market Volume megawatt Forecast, by Tier Type 2019 & 2032
- Table 105: Global Bengaluru Data Center Market Revenue Million Forecast, by Absorption 2019 & 2032
- Table 106: Global Bengaluru Data Center Market Volume megawatt Forecast, by Absorption 2019 & 2032
- Table 107: Global Bengaluru Data Center Market Revenue Million Forecast, by Country 2019 & 2032
- Table 108: Global Bengaluru Data Center Market Volume megawatt Forecast, by Country 2019 & 2032
- Table 109: China Bengaluru Data Center Market Revenue (Million) Forecast, by Application 2019 & 2032
- Table 110: China Bengaluru Data Center Market Volume (megawatt) Forecast, by Application 2019 & 2032
- Table 111: India Bengaluru Data Center Market Revenue (Million) Forecast, by Application 2019 & 2032
- Table 112: India Bengaluru Data Center Market Volume (megawatt) Forecast, by Application 2019 & 2032
- Table 113: Japan Bengaluru Data Center Market Revenue (Million) Forecast, by Application 2019 & 2032
- Table 114: Japan Bengaluru Data Center Market Volume (megawatt) Forecast, by Application 2019 & 2032
- Table 115: South Korea Bengaluru Data Center Market Revenue (Million) Forecast, by Application 2019 & 2032
- Table 116: South Korea Bengaluru Data Center Market Volume (megawatt) Forecast, by Application 2019 & 2032
- Table 117: ASEAN Bengaluru Data Center Market Revenue (Million) Forecast, by Application 2019 & 2032
- Table 118: ASEAN Bengaluru Data Center Market Volume (megawatt) Forecast, by Application 2019 & 2032
- Table 119: Oceania Bengaluru Data Center Market Revenue (Million) Forecast, by Application 2019 & 2032
- Table 120: Oceania Bengaluru Data Center Market Volume (megawatt) Forecast, by Application 2019 & 2032
- Table 121: Rest of Asia Pacific Bengaluru Data Center Market Revenue (Million) Forecast, by Application 2019 & 2032
- Table 122: Rest of Asia Pacific Bengaluru Data Center Market Volume (megawatt) Forecast, by Application 2019 & 2032
Frequently Asked Questions
1. What is the projected Compound Annual Growth Rate (CAGR) of the Bengaluru Data Center Market?
The projected CAGR is approximately 11.43%.
2. Which companies are prominent players in the Bengaluru Data Center Market?
Key companies in the market include Reliance industries, Sify Technologies Limited, Renaissance Technologies, NTT Data, CtrlS, Nxtra Data Limited, STT Telemedia, ESDS Software Solutions Company, Tulip Data Center Services Private Limited*List Not Exhaustive 7 2 Market share analysis (In terms of MW)7 3 List of Companie.
3. What are the main segments of the Bengaluru Data Center Market?
The market segments include DC Size, Tier Type, Absorption.
4. Can you provide details about the market size?
The market size is estimated to be USD XX Million as of 2022.
5. What are some drivers contributing to market growth?
Reduction in Power Consumption With the Use of Silicon Photonics Based Transceivers; Growing Need for High-Speed Connectivity and High Data Transfer Capabilities Across Data Centers.
6. What are the notable trends driving market growth?
Government policies would advance the Investment of Data Centre.
7. Are there any restraints impacting market growth?
Risk of Thermal Effect.
8. Can you provide examples of recent developments in the market?
March 2023 - The Web Werks and Iron Mountain Data Centres Joint Venture (IMDC) announced opening their first data center on their Bengaluru, India, campus in March 2023. The data center is ideally situated as a gateway to Southern India because it is located in the prestigious Whitefield neighborhood of Bengaluru. The BLR-1 is a Tier III data center with 80,000 square feet of space that can accommodate up to 4MW of IT load.
9. What pricing options are available for accessing the report?
Pricing options include single-user, multi-user, and enterprise licenses priced at USD 3800, USD 4500, and USD 5800 respectively.
10. Is the market size provided in terms of value or volume?
The market size is provided in terms of value, measured in Million and volume, measured in megawatt.
11. Are there any specific market keywords associated with the report?
Yes, the market keyword associated with the report is "Bengaluru Data Center Market," which aids in identifying and referencing the specific market segment covered.
12. How do I determine which pricing option suits my needs best?
The pricing options vary based on user requirements and access needs. Individual users may opt for single-user licenses, while businesses requiring broader access may choose multi-user or enterprise licenses for cost-effective access to the report.
13. Are there any additional resources or data provided in the Bengaluru Data Center Market report?
While the report offers comprehensive insights, it's advisable to review the specific contents or supplementary materials provided to ascertain if additional resources or data are available.
14. How can I stay updated on further developments or reports in the Bengaluru Data Center Market?
To stay informed about further developments, trends, and reports in the Bengaluru Data Center Market, consider subscribing to industry newsletters, following relevant companies and organizations, or regularly checking reputable industry news sources and publications.
Methodology
Step 1 - Identification of Relevant Samples Size from Population Database


Step 2 - Approaches for Defining Global Market Size (Value, Volume* & Price*)

Note*: In applicable scenarios
Step 3 - Data Sources
Primary Research
- Web Analytics
- Survey Reports
- Research Institute
- Latest Research Reports
- Opinion Leaders
Secondary Research
- Annual Reports
- White Paper
- Latest Press Release
- Industry Association
- Paid Database
- Investor Presentations

Step 4 - Data Triangulation
Involves using different sources of information in order to increase the validity of a study
These sources are likely to be stakeholders in a program - participants, other researchers, program staff, other community members, and so on.
Then we put all data in single framework & apply various statistical tools to find out the dynamic on the market.
During the analysis stage, feedback from the stakeholder groups would be compared to determine areas of agreement as well as areas of divergence


