
Key Insights
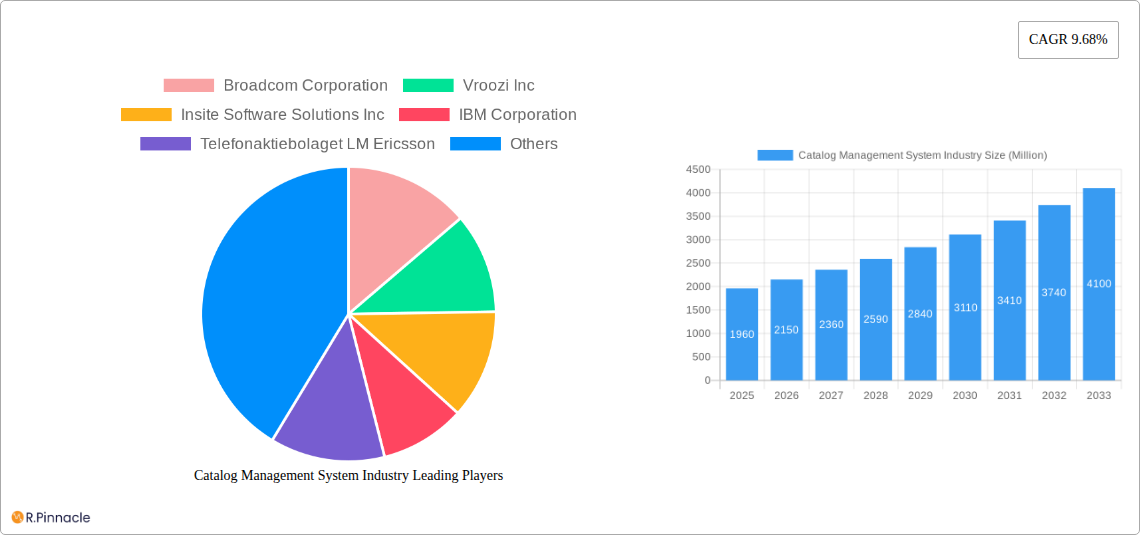
The Catalog Management System (CMS) market is experiencing robust growth, projected to reach \$1.96 billion in 2025 and exhibiting a Compound Annual Growth Rate (CAGR) of 9.68% from 2025 to 2033. This expansion is fueled by several key drivers. The increasing need for businesses to manage complex product and service offerings efficiently across various channels (e-commerce, mobile, physical stores) is a primary factor. Furthermore, the rise of omnichannel commerce and the demand for personalized customer experiences are driving adoption. Businesses are leveraging CMS solutions to improve data accuracy, streamline operations, reduce manual effort associated with catalog updates, and ultimately enhance customer satisfaction and revenue generation. The shift towards cloud-based deployments also contributes significantly to market growth, offering scalability, flexibility, and cost-effectiveness. While the market is experiencing significant growth, challenges such as high initial investment costs and the complexities of integrating CMS with existing enterprise systems could potentially act as restraints in some segments.
Segment-wise analysis reveals a dynamic landscape. The cloud deployment type is expected to dominate the market due to the benefits mentioned above. Product catalogs currently hold a larger market share compared to service catalogs, however, both segments are anticipated to witness substantial growth. Among industry verticals, retail and e-commerce, along with IT and telecom, are currently leading the adoption, primarily driven by the need for efficient inventory management and streamlined sales processes. However, other sectors like BFSI, media and entertainment, and travel and hospitality are showing increasing interest and are poised for significant future growth as they increasingly embrace digital transformation initiatives and require robust catalog management capabilities. The competitive landscape is characterized by a mix of established players like IBM and SAP alongside emerging innovative companies. This competitive environment fosters innovation and drives the development of advanced CMS solutions with enhanced features.
Catalog Management System Industry Market Report: 2019-2033
This comprehensive report provides a detailed analysis of the Catalog Management System (CMS) industry, offering invaluable insights for industry professionals, investors, and strategic planners. The report covers the period 2019-2033, with a focus on the estimated year 2025 and a forecast period of 2025-2033. The market is segmented by type (Service Catalogs, Product Catalogs), deployment type (Cloud, On-premises), and industry vertical (IT and Telecom, Retail and E-commerce, BFSI, Media and Entertainment, Travel and Hospitality, Other). The global market is projected to reach xx Million by 2033, exhibiting a significant CAGR.
Catalog Management System Industry Market Structure & Innovation Trends
The Catalog Management System market exhibits a moderately consolidated structure, with key players such as Broadcom Corporation, IBM Corporation, SAP SE, and Oracle Corporation holding significant market share. However, a number of smaller, specialized vendors also contribute significantly. The combined market share of the top 5 players in 2024 was estimated at xx%. Innovation is driven by the need for enhanced functionality, improved user experience, and seamless integration with existing enterprise systems. Regulatory frameworks, such as data privacy regulations (GDPR, CCPA), are increasingly influencing CMS development. Product substitutes, such as manual catalog management processes, are gradually losing ground due to their inefficiencies. The market has witnessed several M&A activities in recent years, with deal values totaling xx Million over the past five years. These acquisitions have predominantly focused on expanding product portfolios and enhancing technological capabilities.
- Market Concentration: Moderately Consolidated
- Innovation Drivers: Enhanced functionality, improved UX, seamless integration.
- Regulatory Frameworks: GDPR, CCPA, etc.
- M&A Activity: xx Million in deal value over the past 5 years.
Catalog Management System Industry Market Dynamics & Trends
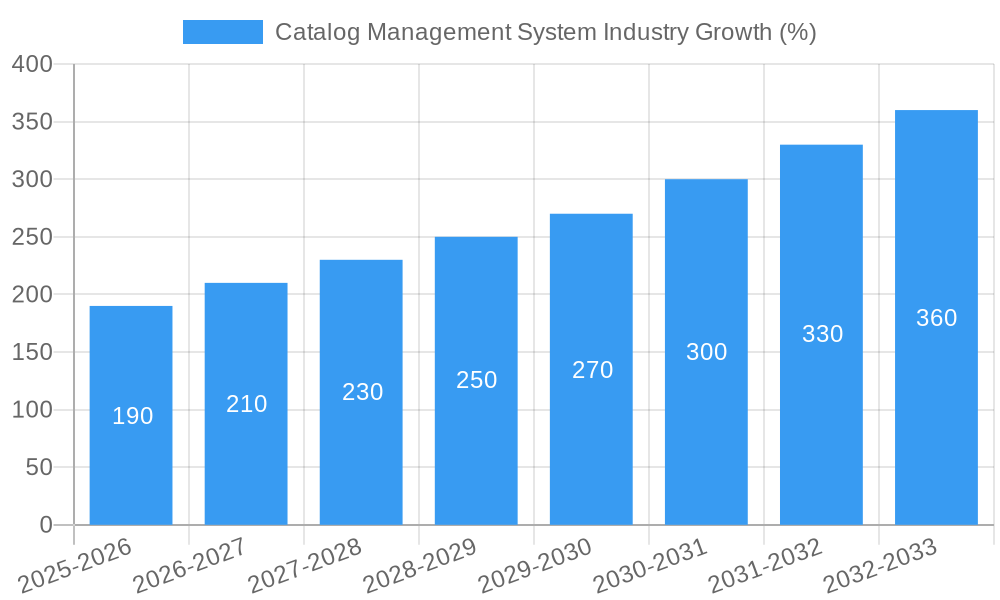
The CMS market is experiencing robust growth, driven by the increasing adoption of e-commerce, the need for efficient inventory management, and the rising demand for personalized customer experiences. Technological advancements, such as AI-powered catalog optimization and automation tools, are further fueling market expansion. Consumer preferences are shifting towards user-friendly interfaces and mobile-accessible catalogs. The competitive landscape is characterized by intense rivalry among established players and emerging startups, resulting in continuous product innovation and price competition. The market is expected to experience a CAGR of xx% during the forecast period (2025-2033), with significant penetration gains in the retail and e-commerce sectors.
Dominant Regions & Segments in Catalog Management System Industry
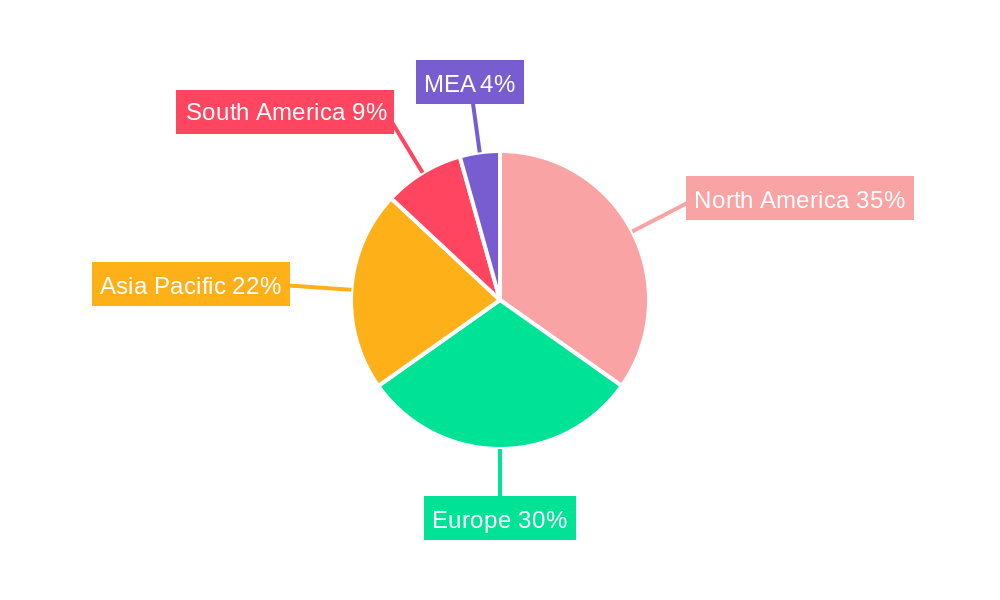
North America currently holds the dominant position in the CMS market, driven by high technological adoption rates, robust e-commerce infrastructure, and the presence of major industry players. However, Asia-Pacific is anticipated to demonstrate strong growth in the coming years, fueled by rapid economic expansion and increasing digitalization.
By Type:
- Product Catalogs: Dominates the market due to higher demand from e-commerce businesses.
- Service Catalogs: Experiencing significant growth driven by the rise of IT service management (ITSM) solutions.
By Deployment Type:
- Cloud: Fastest-growing segment due to scalability, cost-effectiveness, and ease of deployment.
- On-Premises: Still significant, primarily in enterprises with stringent security requirements.
By Industry Vertical:
Retail and E-commerce: Largest segment, driven by the need for efficient product catalog management.
IT and Telecom: Strong growth due to the rising demand for service catalog management.
Key Drivers (North America): High tech adoption, robust e-commerce infrastructure.
Key Drivers (Asia-Pacific): Rapid economic expansion, increasing digitalization.
Catalog Management System Industry Product Innovations
Recent product innovations include AI-powered catalog optimization, advanced search functionalities, and integration with various enterprise resource planning (ERP) systems. These advancements enhance the accuracy, efficiency, and user experience of CMS solutions, making them essential tools for businesses of all sizes. The integration of machine learning algorithms allows for automated catalog updates, improved product recommendations, and personalized customer experiences. This focus on improved user experience and automation reflects a strong market fit within the evolving needs of modern businesses.
Report Scope & Segmentation Analysis
This report provides a comprehensive analysis of the Catalog Management System market, segmented by type (Service Catalogs and Product Catalogs), deployment type (Cloud and On-premises), and industry vertical (IT and Telecom, Retail and E-commerce, BFSI, Media and Entertainment, Travel and Hospitality, and Other). Each segment's growth projections, market sizes, and competitive dynamics are thoroughly examined, providing a detailed understanding of the market landscape.
Key Drivers of Catalog Management System Industry Growth
The growth of the Catalog Management System industry is propelled by several key factors, including the rapid expansion of e-commerce, the increasing demand for efficient inventory management, and the growing need for personalized customer experiences. Technological advancements, such as AI-powered catalog optimization and automation tools, are further accelerating market growth. Government initiatives promoting digitalization in various sectors also contribute significantly to market expansion.
Challenges in the Catalog Management System Industry Sector
Challenges facing the CMS industry include the high initial investment costs associated with implementing CMS solutions, the need for skilled personnel to manage and maintain these systems, and the ongoing need to adapt to evolving data privacy regulations. Competition from both established players and new entrants also poses a significant challenge. Furthermore, ensuring seamless integration with legacy systems can be complex and time-consuming.
Emerging Opportunities in Catalog Management System Industry
Emerging opportunities exist in the integration of augmented reality (AR) and virtual reality (VR) technologies into CMS solutions, enabling immersive product visualization and improved customer engagement. The expansion of CMS solutions into new industry verticals, such as healthcare and education, also presents significant growth potential. The increasing adoption of headless commerce architectures offers opportunities for greater flexibility and customization.
Leading Players in the Catalog Management System Industry Market
- Broadcom Corporation
- Vroozi Inc
- Insite Software Solutions Inc
- IBM Corporation
- Telefonaktiebolaget LM Ericsson
- Coupa Software Inc
- GEP Worldwide
- Amdocs
- Fujitsu Limited
- Zycus Inc
- Sellercloud Inc
- ServiceNow Inc
- Salsify Inc
- Oracle Corporation
- Comarch SA
- Plytix com Ap
- Proactis Holdings Plc
- SAP SE
Key Developments in Catalog Management System Industry
- 2024 Q4: IBM announced a major upgrade to its CMS platform, incorporating AI-powered search capabilities.
- 2023 Q3: SAP SE acquired a smaller CMS provider to expand its product portfolio.
- 2022 Q1: Broadcom Corporation launched a new cloud-based CMS solution. (Further key developments need to be added based on available data.)
Future Outlook for Catalog Management System Industry Market
The future of the Catalog Management System market looks promising, driven by the continuous growth of e-commerce, technological advancements such as AI and machine learning, and the increasing demand for efficient and personalized customer experiences. Strategic opportunities exist for companies focusing on innovation, seamless integrations, and superior user experiences, particularly in emerging markets. The market is poised for sustained growth throughout the forecast period.
Catalog Management System Industry Segmentation
-
1. Type
- 1.1. Service Catalogs
- 1.2. Product Catalogs
-
2. Deployment Type
- 2.1. Cloud
- 2.2. On-Premises
-
3. Industry Vertical
- 3.1. IT and Telecom
- 3.2. Retail and E-commerce
- 3.3. BFSI
- 3.4. Media and Entertainment
- 3.5. Travel and Hospitality
- 3.6. Other Industry Verticals
Catalog Management System Industry Segmentation By Geography
- 1. North America
- 2. Europe
- 3. Asia
- 4. Australia and New Zealand
- 5. Latin America
- 6. Middle East and Africa
Catalog Management System Industry REPORT HIGHLIGHTS
| Aspects | Details |
|---|---|
| Study Period | 2019-2033 |
| Base Year | 2024 |
| Estimated Year | 2025 |
| Forecast Period | 2025-2033 |
| Historical Period | 2019-2024 |
| Growth Rate | CAGR of 9.68% from 2019-2033 |
| Segmentation |
|
Table of Contents
- 1. Introduction
- 1.1. Research Scope
- 1.2. Market Segmentation
- 1.3. Research Methodology
- 1.4. Definitions and Assumptions
- 2. Executive Summary
- 2.1. Introduction
- 3. Market Dynamics
- 3.1. Introduction
- 3.2. Market Drivers
- 3.2.1. Growing Digital Transformation Initiatives; Necessity of Centralized Systems for Improved Marketing and Selling
- 3.3. Market Restrains
- 3.3.1. Privacy and Security Concerns
- 3.4. Market Trends
- 3.4.1. Growing Digital Transformation Initiatives Drives the Market
- 4. Market Factor Analysis
- 4.1. Porters Five Forces
- 4.2. Supply/Value Chain
- 4.3. PESTEL analysis
- 4.4. Market Entropy
- 4.5. Patent/Trademark Analysis
- 5. Global Catalog Management System Industry Analysis, Insights and Forecast, 2019-2031
- 5.1. Market Analysis, Insights and Forecast - by Type
- 5.1.1. Service Catalogs
- 5.1.2. Product Catalogs
- 5.2. Market Analysis, Insights and Forecast - by Deployment Type
- 5.2.1. Cloud
- 5.2.2. On-Premises
- 5.3. Market Analysis, Insights and Forecast - by Industry Vertical
- 5.3.1. IT and Telecom
- 5.3.2. Retail and E-commerce
- 5.3.3. BFSI
- 5.3.4. Media and Entertainment
- 5.3.5. Travel and Hospitality
- 5.3.6. Other Industry Verticals
- 5.4. Market Analysis, Insights and Forecast - by Region
- 5.4.1. North America
- 5.4.2. Europe
- 5.4.3. Asia
- 5.4.4. Australia and New Zealand
- 5.4.5. Latin America
- 5.4.6. Middle East and Africa
- 5.1. Market Analysis, Insights and Forecast - by Type
- 6. North America Catalog Management System Industry Analysis, Insights and Forecast, 2019-2031
- 6.1. Market Analysis, Insights and Forecast - by Type
- 6.1.1. Service Catalogs
- 6.1.2. Product Catalogs
- 6.2. Market Analysis, Insights and Forecast - by Deployment Type
- 6.2.1. Cloud
- 6.2.2. On-Premises
- 6.3. Market Analysis, Insights and Forecast - by Industry Vertical
- 6.3.1. IT and Telecom
- 6.3.2. Retail and E-commerce
- 6.3.3. BFSI
- 6.3.4. Media and Entertainment
- 6.3.5. Travel and Hospitality
- 6.3.6. Other Industry Verticals
- 6.1. Market Analysis, Insights and Forecast - by Type
- 7. Europe Catalog Management System Industry Analysis, Insights and Forecast, 2019-2031
- 7.1. Market Analysis, Insights and Forecast - by Type
- 7.1.1. Service Catalogs
- 7.1.2. Product Catalogs
- 7.2. Market Analysis, Insights and Forecast - by Deployment Type
- 7.2.1. Cloud
- 7.2.2. On-Premises
- 7.3. Market Analysis, Insights and Forecast - by Industry Vertical
- 7.3.1. IT and Telecom
- 7.3.2. Retail and E-commerce
- 7.3.3. BFSI
- 7.3.4. Media and Entertainment
- 7.3.5. Travel and Hospitality
- 7.3.6. Other Industry Verticals
- 7.1. Market Analysis, Insights and Forecast - by Type
- 8. Asia Catalog Management System Industry Analysis, Insights and Forecast, 2019-2031
- 8.1. Market Analysis, Insights and Forecast - by Type
- 8.1.1. Service Catalogs
- 8.1.2. Product Catalogs
- 8.2. Market Analysis, Insights and Forecast - by Deployment Type
- 8.2.1. Cloud
- 8.2.2. On-Premises
- 8.3. Market Analysis, Insights and Forecast - by Industry Vertical
- 8.3.1. IT and Telecom
- 8.3.2. Retail and E-commerce
- 8.3.3. BFSI
- 8.3.4. Media and Entertainment
- 8.3.5. Travel and Hospitality
- 8.3.6. Other Industry Verticals
- 8.1. Market Analysis, Insights and Forecast - by Type
- 9. Australia and New Zealand Catalog Management System Industry Analysis, Insights and Forecast, 2019-2031
- 9.1. Market Analysis, Insights and Forecast - by Type
- 9.1.1. Service Catalogs
- 9.1.2. Product Catalogs
- 9.2. Market Analysis, Insights and Forecast - by Deployment Type
- 9.2.1. Cloud
- 9.2.2. On-Premises
- 9.3. Market Analysis, Insights and Forecast - by Industry Vertical
- 9.3.1. IT and Telecom
- 9.3.2. Retail and E-commerce
- 9.3.3. BFSI
- 9.3.4. Media and Entertainment
- 9.3.5. Travel and Hospitality
- 9.3.6. Other Industry Verticals
- 9.1. Market Analysis, Insights and Forecast - by Type
- 10. Latin America Catalog Management System Industry Analysis, Insights and Forecast, 2019-2031
- 10.1. Market Analysis, Insights and Forecast - by Type
- 10.1.1. Service Catalogs
- 10.1.2. Product Catalogs
- 10.2. Market Analysis, Insights and Forecast - by Deployment Type
- 10.2.1. Cloud
- 10.2.2. On-Premises
- 10.3. Market Analysis, Insights and Forecast - by Industry Vertical
- 10.3.1. IT and Telecom
- 10.3.2. Retail and E-commerce
- 10.3.3. BFSI
- 10.3.4. Media and Entertainment
- 10.3.5. Travel and Hospitality
- 10.3.6. Other Industry Verticals
- 10.1. Market Analysis, Insights and Forecast - by Type
- 11. Middle East and Africa Catalog Management System Industry Analysis, Insights and Forecast, 2019-2031
- 11.1. Market Analysis, Insights and Forecast - by Type
- 11.1.1. Service Catalogs
- 11.1.2. Product Catalogs
- 11.2. Market Analysis, Insights and Forecast - by Deployment Type
- 11.2.1. Cloud
- 11.2.2. On-Premises
- 11.3. Market Analysis, Insights and Forecast - by Industry Vertical
- 11.3.1. IT and Telecom
- 11.3.2. Retail and E-commerce
- 11.3.3. BFSI
- 11.3.4. Media and Entertainment
- 11.3.5. Travel and Hospitality
- 11.3.6. Other Industry Verticals
- 11.1. Market Analysis, Insights and Forecast - by Type
- 12. North America Catalog Management System Industry Analysis, Insights and Forecast, 2019-2031
- 12.1. Market Analysis, Insights and Forecast - By Country/Sub-region
- 12.1.1 United States
- 12.1.2 Canada
- 12.1.3 Mexico
- 13. Europe Catalog Management System Industry Analysis, Insights and Forecast, 2019-2031
- 13.1. Market Analysis, Insights and Forecast - By Country/Sub-region
- 13.1.1 Germany
- 13.1.2 United Kingdom
- 13.1.3 France
- 13.1.4 Spain
- 13.1.5 Italy
- 13.1.6 Spain
- 13.1.7 Belgium
- 13.1.8 Netherland
- 13.1.9 Nordics
- 13.1.10 Rest of Europe
- 14. Asia Pacific Catalog Management System Industry Analysis, Insights and Forecast, 2019-2031
- 14.1. Market Analysis, Insights and Forecast - By Country/Sub-region
- 14.1.1 China
- 14.1.2 Japan
- 14.1.3 India
- 14.1.4 South Korea
- 14.1.5 Southeast Asia
- 14.1.6 Australia
- 14.1.7 Indonesia
- 14.1.8 Phillipes
- 14.1.9 Singapore
- 14.1.10 Thailandc
- 14.1.11 Rest of Asia Pacific
- 15. South America Catalog Management System Industry Analysis, Insights and Forecast, 2019-2031
- 15.1. Market Analysis, Insights and Forecast - By Country/Sub-region
- 15.1.1 Brazil
- 15.1.2 Argentina
- 15.1.3 Peru
- 15.1.4 Chile
- 15.1.5 Colombia
- 15.1.6 Ecuador
- 15.1.7 Venezuela
- 15.1.8 Rest of South America
- 16. North America Catalog Management System Industry Analysis, Insights and Forecast, 2019-2031
- 16.1. Market Analysis, Insights and Forecast - By Country/Sub-region
- 16.1.1 United States
- 16.1.2 Canada
- 16.1.3 Mexico
- 17. MEA Catalog Management System Industry Analysis, Insights and Forecast, 2019-2031
- 17.1. Market Analysis, Insights and Forecast - By Country/Sub-region
- 17.1.1 United Arab Emirates
- 17.1.2 Saudi Arabia
- 17.1.3 South Africa
- 17.1.4 Rest of Middle East and Africa
- 18. Competitive Analysis
- 18.1. Global Market Share Analysis 2024
- 18.2. Company Profiles
- 18.2.1 Broadcom Corporation
- 18.2.1.1. Overview
- 18.2.1.2. Products
- 18.2.1.3. SWOT Analysis
- 18.2.1.4. Recent Developments
- 18.2.1.5. Financials (Based on Availability)
- 18.2.2 Vroozi Inc
- 18.2.2.1. Overview
- 18.2.2.2. Products
- 18.2.2.3. SWOT Analysis
- 18.2.2.4. Recent Developments
- 18.2.2.5. Financials (Based on Availability)
- 18.2.3 Insite Software Solutions Inc
- 18.2.3.1. Overview
- 18.2.3.2. Products
- 18.2.3.3. SWOT Analysis
- 18.2.3.4. Recent Developments
- 18.2.3.5. Financials (Based on Availability)
- 18.2.4 IBM Corporation
- 18.2.4.1. Overview
- 18.2.4.2. Products
- 18.2.4.3. SWOT Analysis
- 18.2.4.4. Recent Developments
- 18.2.4.5. Financials (Based on Availability)
- 18.2.5 Telefonaktiebolaget LM Ericsson
- 18.2.5.1. Overview
- 18.2.5.2. Products
- 18.2.5.3. SWOT Analysis
- 18.2.5.4. Recent Developments
- 18.2.5.5. Financials (Based on Availability)
- 18.2.6 Coupa Software Inc
- 18.2.6.1. Overview
- 18.2.6.2. Products
- 18.2.6.3. SWOT Analysis
- 18.2.6.4. Recent Developments
- 18.2.6.5. Financials (Based on Availability)
- 18.2.7 GEP Worldwide
- 18.2.7.1. Overview
- 18.2.7.2. Products
- 18.2.7.3. SWOT Analysis
- 18.2.7.4. Recent Developments
- 18.2.7.5. Financials (Based on Availability)
- 18.2.8 Amdocs
- 18.2.8.1. Overview
- 18.2.8.2. Products
- 18.2.8.3. SWOT Analysis
- 18.2.8.4. Recent Developments
- 18.2.8.5. Financials (Based on Availability)
- 18.2.9 Fujitsu Limited
- 18.2.9.1. Overview
- 18.2.9.2. Products
- 18.2.9.3. SWOT Analysis
- 18.2.9.4. Recent Developments
- 18.2.9.5. Financials (Based on Availability)
- 18.2.10 Zycus Inc
- 18.2.10.1. Overview
- 18.2.10.2. Products
- 18.2.10.3. SWOT Analysis
- 18.2.10.4. Recent Developments
- 18.2.10.5. Financials (Based on Availability)
- 18.2.11 Sellercloud Inc
- 18.2.11.1. Overview
- 18.2.11.2. Products
- 18.2.11.3. SWOT Analysis
- 18.2.11.4. Recent Developments
- 18.2.11.5. Financials (Based on Availability)
- 18.2.12 ServiceNow Inc
- 18.2.12.1. Overview
- 18.2.12.2. Products
- 18.2.12.3. SWOT Analysis
- 18.2.12.4. Recent Developments
- 18.2.12.5. Financials (Based on Availability)
- 18.2.13 Salsify Inc
- 18.2.13.1. Overview
- 18.2.13.2. Products
- 18.2.13.3. SWOT Analysis
- 18.2.13.4. Recent Developments
- 18.2.13.5. Financials (Based on Availability)
- 18.2.14 Oracle Corporation
- 18.2.14.1. Overview
- 18.2.14.2. Products
- 18.2.14.3. SWOT Analysis
- 18.2.14.4. Recent Developments
- 18.2.14.5. Financials (Based on Availability)
- 18.2.15 Comarch SA
- 18.2.15.1. Overview
- 18.2.15.2. Products
- 18.2.15.3. SWOT Analysis
- 18.2.15.4. Recent Developments
- 18.2.15.5. Financials (Based on Availability)
- 18.2.16 Plytix com Ap
- 18.2.16.1. Overview
- 18.2.16.2. Products
- 18.2.16.3. SWOT Analysis
- 18.2.16.4. Recent Developments
- 18.2.16.5. Financials (Based on Availability)
- 18.2.17 Proactis Holdings Plc
- 18.2.17.1. Overview
- 18.2.17.2. Products
- 18.2.17.3. SWOT Analysis
- 18.2.17.4. Recent Developments
- 18.2.17.5. Financials (Based on Availability)
- 18.2.18 SAP SE
- 18.2.18.1. Overview
- 18.2.18.2. Products
- 18.2.18.3. SWOT Analysis
- 18.2.18.4. Recent Developments
- 18.2.18.5. Financials (Based on Availability)
- 18.2.1 Broadcom Corporation
List of Figures
- Figure 1: Global Catalog Management System Industry Revenue Breakdown (Million, %) by Region 2024 & 2032
- Figure 2: North America Catalog Management System Industry Revenue (Million), by Country 2024 & 2032
- Figure 3: North America Catalog Management System Industry Revenue Share (%), by Country 2024 & 2032
- Figure 4: Europe Catalog Management System Industry Revenue (Million), by Country 2024 & 2032
- Figure 5: Europe Catalog Management System Industry Revenue Share (%), by Country 2024 & 2032
- Figure 6: Asia Pacific Catalog Management System Industry Revenue (Million), by Country 2024 & 2032
- Figure 7: Asia Pacific Catalog Management System Industry Revenue Share (%), by Country 2024 & 2032
- Figure 8: South America Catalog Management System Industry Revenue (Million), by Country 2024 & 2032
- Figure 9: South America Catalog Management System Industry Revenue Share (%), by Country 2024 & 2032
- Figure 10: North America Catalog Management System Industry Revenue (Million), by Country 2024 & 2032
- Figure 11: North America Catalog Management System Industry Revenue Share (%), by Country 2024 & 2032
- Figure 12: MEA Catalog Management System Industry Revenue (Million), by Country 2024 & 2032
- Figure 13: MEA Catalog Management System Industry Revenue Share (%), by Country 2024 & 2032
- Figure 14: North America Catalog Management System Industry Revenue (Million), by Type 2024 & 2032
- Figure 15: North America Catalog Management System Industry Revenue Share (%), by Type 2024 & 2032
- Figure 16: North America Catalog Management System Industry Revenue (Million), by Deployment Type 2024 & 2032
- Figure 17: North America Catalog Management System Industry Revenue Share (%), by Deployment Type 2024 & 2032
- Figure 18: North America Catalog Management System Industry Revenue (Million), by Industry Vertical 2024 & 2032
- Figure 19: North America Catalog Management System Industry Revenue Share (%), by Industry Vertical 2024 & 2032
- Figure 20: North America Catalog Management System Industry Revenue (Million), by Country 2024 & 2032
- Figure 21: North America Catalog Management System Industry Revenue Share (%), by Country 2024 & 2032
- Figure 22: Europe Catalog Management System Industry Revenue (Million), by Type 2024 & 2032
- Figure 23: Europe Catalog Management System Industry Revenue Share (%), by Type 2024 & 2032
- Figure 24: Europe Catalog Management System Industry Revenue (Million), by Deployment Type 2024 & 2032
- Figure 25: Europe Catalog Management System Industry Revenue Share (%), by Deployment Type 2024 & 2032
- Figure 26: Europe Catalog Management System Industry Revenue (Million), by Industry Vertical 2024 & 2032
- Figure 27: Europe Catalog Management System Industry Revenue Share (%), by Industry Vertical 2024 & 2032
- Figure 28: Europe Catalog Management System Industry Revenue (Million), by Country 2024 & 2032
- Figure 29: Europe Catalog Management System Industry Revenue Share (%), by Country 2024 & 2032
- Figure 30: Asia Catalog Management System Industry Revenue (Million), by Type 2024 & 2032
- Figure 31: Asia Catalog Management System Industry Revenue Share (%), by Type 2024 & 2032
- Figure 32: Asia Catalog Management System Industry Revenue (Million), by Deployment Type 2024 & 2032
- Figure 33: Asia Catalog Management System Industry Revenue Share (%), by Deployment Type 2024 & 2032
- Figure 34: Asia Catalog Management System Industry Revenue (Million), by Industry Vertical 2024 & 2032
- Figure 35: Asia Catalog Management System Industry Revenue Share (%), by Industry Vertical 2024 & 2032
- Figure 36: Asia Catalog Management System Industry Revenue (Million), by Country 2024 & 2032
- Figure 37: Asia Catalog Management System Industry Revenue Share (%), by Country 2024 & 2032
- Figure 38: Australia and New Zealand Catalog Management System Industry Revenue (Million), by Type 2024 & 2032
- Figure 39: Australia and New Zealand Catalog Management System Industry Revenue Share (%), by Type 2024 & 2032
- Figure 40: Australia and New Zealand Catalog Management System Industry Revenue (Million), by Deployment Type 2024 & 2032
- Figure 41: Australia and New Zealand Catalog Management System Industry Revenue Share (%), by Deployment Type 2024 & 2032
- Figure 42: Australia and New Zealand Catalog Management System Industry Revenue (Million), by Industry Vertical 2024 & 2032
- Figure 43: Australia and New Zealand Catalog Management System Industry Revenue Share (%), by Industry Vertical 2024 & 2032
- Figure 44: Australia and New Zealand Catalog Management System Industry Revenue (Million), by Country 2024 & 2032
- Figure 45: Australia and New Zealand Catalog Management System Industry Revenue Share (%), by Country 2024 & 2032
- Figure 46: Latin America Catalog Management System Industry Revenue (Million), by Type 2024 & 2032
- Figure 47: Latin America Catalog Management System Industry Revenue Share (%), by Type 2024 & 2032
- Figure 48: Latin America Catalog Management System Industry Revenue (Million), by Deployment Type 2024 & 2032
- Figure 49: Latin America Catalog Management System Industry Revenue Share (%), by Deployment Type 2024 & 2032
- Figure 50: Latin America Catalog Management System Industry Revenue (Million), by Industry Vertical 2024 & 2032
- Figure 51: Latin America Catalog Management System Industry Revenue Share (%), by Industry Vertical 2024 & 2032
- Figure 52: Latin America Catalog Management System Industry Revenue (Million), by Country 2024 & 2032
- Figure 53: Latin America Catalog Management System Industry Revenue Share (%), by Country 2024 & 2032
- Figure 54: Middle East and Africa Catalog Management System Industry Revenue (Million), by Type 2024 & 2032
- Figure 55: Middle East and Africa Catalog Management System Industry Revenue Share (%), by Type 2024 & 2032
- Figure 56: Middle East and Africa Catalog Management System Industry Revenue (Million), by Deployment Type 2024 & 2032
- Figure 57: Middle East and Africa Catalog Management System Industry Revenue Share (%), by Deployment Type 2024 & 2032
- Figure 58: Middle East and Africa Catalog Management System Industry Revenue (Million), by Industry Vertical 2024 & 2032
- Figure 59: Middle East and Africa Catalog Management System Industry Revenue Share (%), by Industry Vertical 2024 & 2032
- Figure 60: Middle East and Africa Catalog Management System Industry Revenue (Million), by Country 2024 & 2032
- Figure 61: Middle East and Africa Catalog Management System Industry Revenue Share (%), by Country 2024 & 2032
List of Tables
- Table 1: Global Catalog Management System Industry Revenue Million Forecast, by Region 2019 & 2032
- Table 2: Global Catalog Management System Industry Revenue Million Forecast, by Type 2019 & 2032
- Table 3: Global Catalog Management System Industry Revenue Million Forecast, by Deployment Type 2019 & 2032
- Table 4: Global Catalog Management System Industry Revenue Million Forecast, by Industry Vertical 2019 & 2032
- Table 5: Global Catalog Management System Industry Revenue Million Forecast, by Region 2019 & 2032
- Table 6: Global Catalog Management System Industry Revenue Million Forecast, by Country 2019 & 2032
- Table 7: United States Catalog Management System Industry Revenue (Million) Forecast, by Application 2019 & 2032
- Table 8: Canada Catalog Management System Industry Revenue (Million) Forecast, by Application 2019 & 2032
- Table 9: Mexico Catalog Management System Industry Revenue (Million) Forecast, by Application 2019 & 2032
- Table 10: Global Catalog Management System Industry Revenue Million Forecast, by Country 2019 & 2032
- Table 11: Germany Catalog Management System Industry Revenue (Million) Forecast, by Application 2019 & 2032
- Table 12: United Kingdom Catalog Management System Industry Revenue (Million) Forecast, by Application 2019 & 2032
- Table 13: France Catalog Management System Industry Revenue (Million) Forecast, by Application 2019 & 2032
- Table 14: Spain Catalog Management System Industry Revenue (Million) Forecast, by Application 2019 & 2032
- Table 15: Italy Catalog Management System Industry Revenue (Million) Forecast, by Application 2019 & 2032
- Table 16: Spain Catalog Management System Industry Revenue (Million) Forecast, by Application 2019 & 2032
- Table 17: Belgium Catalog Management System Industry Revenue (Million) Forecast, by Application 2019 & 2032
- Table 18: Netherland Catalog Management System Industry Revenue (Million) Forecast, by Application 2019 & 2032
- Table 19: Nordics Catalog Management System Industry Revenue (Million) Forecast, by Application 2019 & 2032
- Table 20: Rest of Europe Catalog Management System Industry Revenue (Million) Forecast, by Application 2019 & 2032
- Table 21: Global Catalog Management System Industry Revenue Million Forecast, by Country 2019 & 2032
- Table 22: China Catalog Management System Industry Revenue (Million) Forecast, by Application 2019 & 2032
- Table 23: Japan Catalog Management System Industry Revenue (Million) Forecast, by Application 2019 & 2032
- Table 24: India Catalog Management System Industry Revenue (Million) Forecast, by Application 2019 & 2032
- Table 25: South Korea Catalog Management System Industry Revenue (Million) Forecast, by Application 2019 & 2032
- Table 26: Southeast Asia Catalog Management System Industry Revenue (Million) Forecast, by Application 2019 & 2032
- Table 27: Australia Catalog Management System Industry Revenue (Million) Forecast, by Application 2019 & 2032
- Table 28: Indonesia Catalog Management System Industry Revenue (Million) Forecast, by Application 2019 & 2032
- Table 29: Phillipes Catalog Management System Industry Revenue (Million) Forecast, by Application 2019 & 2032
- Table 30: Singapore Catalog Management System Industry Revenue (Million) Forecast, by Application 2019 & 2032
- Table 31: Thailandc Catalog Management System Industry Revenue (Million) Forecast, by Application 2019 & 2032
- Table 32: Rest of Asia Pacific Catalog Management System Industry Revenue (Million) Forecast, by Application 2019 & 2032
- Table 33: Global Catalog Management System Industry Revenue Million Forecast, by Country 2019 & 2032
- Table 34: Brazil Catalog Management System Industry Revenue (Million) Forecast, by Application 2019 & 2032
- Table 35: Argentina Catalog Management System Industry Revenue (Million) Forecast, by Application 2019 & 2032
- Table 36: Peru Catalog Management System Industry Revenue (Million) Forecast, by Application 2019 & 2032
- Table 37: Chile Catalog Management System Industry Revenue (Million) Forecast, by Application 2019 & 2032
- Table 38: Colombia Catalog Management System Industry Revenue (Million) Forecast, by Application 2019 & 2032
- Table 39: Ecuador Catalog Management System Industry Revenue (Million) Forecast, by Application 2019 & 2032
- Table 40: Venezuela Catalog Management System Industry Revenue (Million) Forecast, by Application 2019 & 2032
- Table 41: Rest of South America Catalog Management System Industry Revenue (Million) Forecast, by Application 2019 & 2032
- Table 42: Global Catalog Management System Industry Revenue Million Forecast, by Country 2019 & 2032
- Table 43: United States Catalog Management System Industry Revenue (Million) Forecast, by Application 2019 & 2032
- Table 44: Canada Catalog Management System Industry Revenue (Million) Forecast, by Application 2019 & 2032
- Table 45: Mexico Catalog Management System Industry Revenue (Million) Forecast, by Application 2019 & 2032
- Table 46: Global Catalog Management System Industry Revenue Million Forecast, by Country 2019 & 2032
- Table 47: United Arab Emirates Catalog Management System Industry Revenue (Million) Forecast, by Application 2019 & 2032
- Table 48: Saudi Arabia Catalog Management System Industry Revenue (Million) Forecast, by Application 2019 & 2032
- Table 49: South Africa Catalog Management System Industry Revenue (Million) Forecast, by Application 2019 & 2032
- Table 50: Rest of Middle East and Africa Catalog Management System Industry Revenue (Million) Forecast, by Application 2019 & 2032
- Table 51: Global Catalog Management System Industry Revenue Million Forecast, by Type 2019 & 2032
- Table 52: Global Catalog Management System Industry Revenue Million Forecast, by Deployment Type 2019 & 2032
- Table 53: Global Catalog Management System Industry Revenue Million Forecast, by Industry Vertical 2019 & 2032
- Table 54: Global Catalog Management System Industry Revenue Million Forecast, by Country 2019 & 2032
- Table 55: Global Catalog Management System Industry Revenue Million Forecast, by Type 2019 & 2032
- Table 56: Global Catalog Management System Industry Revenue Million Forecast, by Deployment Type 2019 & 2032
- Table 57: Global Catalog Management System Industry Revenue Million Forecast, by Industry Vertical 2019 & 2032
- Table 58: Global Catalog Management System Industry Revenue Million Forecast, by Country 2019 & 2032
- Table 59: Global Catalog Management System Industry Revenue Million Forecast, by Type 2019 & 2032
- Table 60: Global Catalog Management System Industry Revenue Million Forecast, by Deployment Type 2019 & 2032
- Table 61: Global Catalog Management System Industry Revenue Million Forecast, by Industry Vertical 2019 & 2032
- Table 62: Global Catalog Management System Industry Revenue Million Forecast, by Country 2019 & 2032
- Table 63: Global Catalog Management System Industry Revenue Million Forecast, by Type 2019 & 2032
- Table 64: Global Catalog Management System Industry Revenue Million Forecast, by Deployment Type 2019 & 2032
- Table 65: Global Catalog Management System Industry Revenue Million Forecast, by Industry Vertical 2019 & 2032
- Table 66: Global Catalog Management System Industry Revenue Million Forecast, by Country 2019 & 2032
- Table 67: Global Catalog Management System Industry Revenue Million Forecast, by Type 2019 & 2032
- Table 68: Global Catalog Management System Industry Revenue Million Forecast, by Deployment Type 2019 & 2032
- Table 69: Global Catalog Management System Industry Revenue Million Forecast, by Industry Vertical 2019 & 2032
- Table 70: Global Catalog Management System Industry Revenue Million Forecast, by Country 2019 & 2032
- Table 71: Global Catalog Management System Industry Revenue Million Forecast, by Type 2019 & 2032
- Table 72: Global Catalog Management System Industry Revenue Million Forecast, by Deployment Type 2019 & 2032
- Table 73: Global Catalog Management System Industry Revenue Million Forecast, by Industry Vertical 2019 & 2032
- Table 74: Global Catalog Management System Industry Revenue Million Forecast, by Country 2019 & 2032
Frequently Asked Questions
1. What is the projected Compound Annual Growth Rate (CAGR) of the Catalog Management System Industry?
The projected CAGR is approximately 9.68%.
2. Which companies are prominent players in the Catalog Management System Industry?
Key companies in the market include Broadcom Corporation, Vroozi Inc, Insite Software Solutions Inc, IBM Corporation, Telefonaktiebolaget LM Ericsson, Coupa Software Inc, GEP Worldwide, Amdocs, Fujitsu Limited, Zycus Inc, Sellercloud Inc, ServiceNow Inc, Salsify Inc, Oracle Corporation, Comarch SA, Plytix com Ap, Proactis Holdings Plc, SAP SE.
3. What are the main segments of the Catalog Management System Industry?
The market segments include Type, Deployment Type, Industry Vertical.
4. Can you provide details about the market size?
The market size is estimated to be USD 1.96 Million as of 2022.
5. What are some drivers contributing to market growth?
Growing Digital Transformation Initiatives; Necessity of Centralized Systems for Improved Marketing and Selling.
6. What are the notable trends driving market growth?
Growing Digital Transformation Initiatives Drives the Market.
7. Are there any restraints impacting market growth?
Privacy and Security Concerns.
8. Can you provide examples of recent developments in the market?
N/A
9. What pricing options are available for accessing the report?
Pricing options include single-user, multi-user, and enterprise licenses priced at USD 4750, USD 5250, and USD 8750 respectively.
10. Is the market size provided in terms of value or volume?
The market size is provided in terms of value, measured in Million.
11. Are there any specific market keywords associated with the report?
Yes, the market keyword associated with the report is "Catalog Management System Industry," which aids in identifying and referencing the specific market segment covered.
12. How do I determine which pricing option suits my needs best?
The pricing options vary based on user requirements and access needs. Individual users may opt for single-user licenses, while businesses requiring broader access may choose multi-user or enterprise licenses for cost-effective access to the report.
13. Are there any additional resources or data provided in the Catalog Management System Industry report?
While the report offers comprehensive insights, it's advisable to review the specific contents or supplementary materials provided to ascertain if additional resources or data are available.
14. How can I stay updated on further developments or reports in the Catalog Management System Industry?
To stay informed about further developments, trends, and reports in the Catalog Management System Industry, consider subscribing to industry newsletters, following relevant companies and organizations, or regularly checking reputable industry news sources and publications.
Methodology
Step 1 - Identification of Relevant Samples Size from Population Database


Step 2 - Approaches for Defining Global Market Size (Value, Volume* & Price*)

Note*: In applicable scenarios
Step 3 - Data Sources
Primary Research
- Web Analytics
- Survey Reports
- Research Institute
- Latest Research Reports
- Opinion Leaders
Secondary Research
- Annual Reports
- White Paper
- Latest Press Release
- Industry Association
- Paid Database
- Investor Presentations

Step 4 - Data Triangulation
Involves using different sources of information in order to increase the validity of a study
These sources are likely to be stakeholders in a program - participants, other researchers, program staff, other community members, and so on.
Then we put all data in single framework & apply various statistical tools to find out the dynamic on the market.
During the analysis stage, feedback from the stakeholder groups would be compared to determine areas of agreement as well as areas of divergence


