
Key Insights
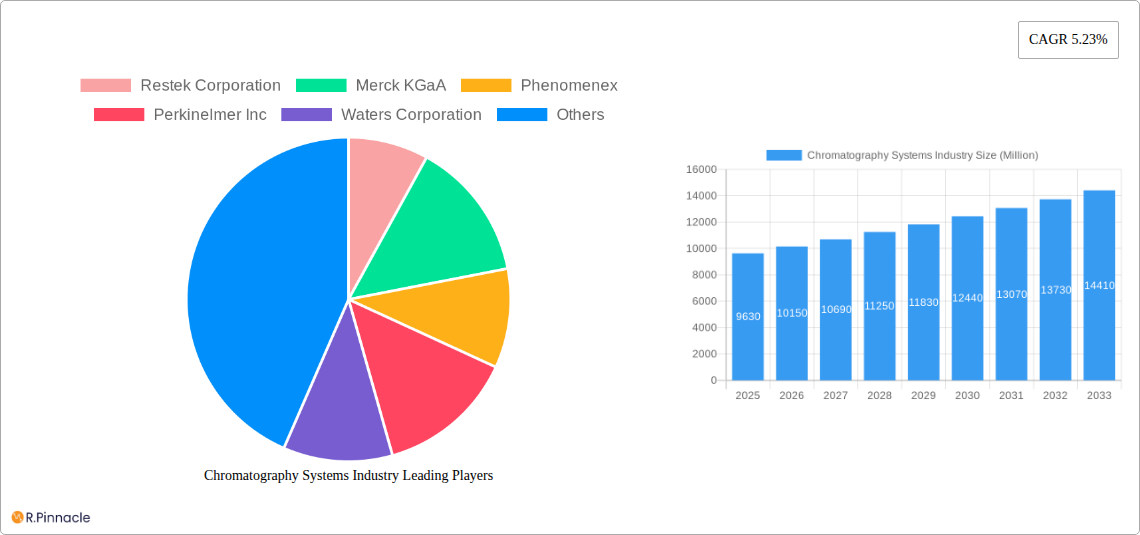
The global chromatography systems market, valued at $9.63 billion in 2025, is projected to experience robust growth, driven by the increasing demand for advanced analytical techniques across diverse sectors. The Compound Annual Growth Rate (CAGR) of 5.23% from 2025 to 2033 indicates a significant expansion in market size over the forecast period. Key drivers include the rising prevalence of chronic diseases fueling pharmaceutical R&D, stringent environmental regulations necessitating precise contaminant analysis, and the growing adoption of chromatography in food safety and agricultural research. The market is segmented by consumables, accessories, and devices, with chromatography systems dominating. Significant application areas include pharmaceutical firms, clinical research organizations, environmental testing, and agriculture, each contributing to the overall market growth. Technological advancements, such as the development of miniaturized and high-throughput systems, are further accelerating market expansion. However, high initial investment costs and the requirement for specialized expertise can act as potential restraints. North America and Europe currently hold significant market share due to the presence of established players and well-developed research infrastructure. However, the Asia-Pacific region is expected to demonstrate strong growth potential due to rising healthcare expenditure and increasing industrialization.
The competitive landscape is characterized by the presence of both large multinational corporations and specialized smaller companies. Major players like Thermo Fisher Scientific, Agilent Technologies, and Waters Corporation are at the forefront, leveraging their extensive product portfolios and global reach. These companies are actively involved in research and development, focusing on innovation in chromatography technologies and expanding their market share through strategic partnerships and acquisitions. The future growth of the chromatography systems market will heavily depend on ongoing technological advancements, regulatory changes, and the sustained investment in life sciences research. The market's steady growth across various segments and geographic regions makes it an attractive investment opportunity for stakeholders.
Chromatography Systems Industry: A Comprehensive Market Report (2019-2033)
This comprehensive report provides an in-depth analysis of the Chromatography Systems industry, offering valuable insights for industry professionals, investors, and strategic decision-makers. The report covers the period from 2019 to 2033, with a focus on the estimated year 2025 and a forecast period extending to 2033. The market size is valued in millions of US dollars.
Chromatography Systems Industry Market Structure & Innovation Trends
The Chromatography Systems market is characterized by a moderately concentrated landscape, with several major players holding significant market share. Restek Corporation, Merck KGaA, Phenomenex, PerkinElmer Inc, Waters Corporation, Cytiva, Sartorius AG, Bio-Rad Laboratories, Gilson Inc, Thermo Fisher Scientific, Agilent Technologies, and Shimadzu Corporation are key players, collectively accounting for approximately xx% of the global market in 2025. Innovation in this sector is driven by the need for higher sensitivity, faster analysis times, and miniaturization of systems to meet the demands of diverse applications. Regulatory frameworks, such as those governing pharmaceutical and environmental testing, significantly influence market growth and product development. Product substitutes, including alternative separation techniques, pose a moderate threat. M&A activity within the industry has been relatively robust in recent years, with several significant deals valued at over $xx Million driving consolidation and expansion. For instance, in 2023, [Insert an example of M&A activity if available, otherwise use "a key player acquired a smaller competitor expanding their portfolio" ]. The end-user demographic is diverse, encompassing pharmaceutical firms, clinical research organizations, environmental testing labs, and agricultural research institutions.
- Market Concentration: xx% held by top 12 players (2025 estimate).
- M&A Deal Value (2019-2024): Approximately $xx Million (estimated).
- Key Innovation Drivers: Increased sensitivity, faster analysis times, miniaturization.
Chromatography Systems Industry Market Dynamics & Trends
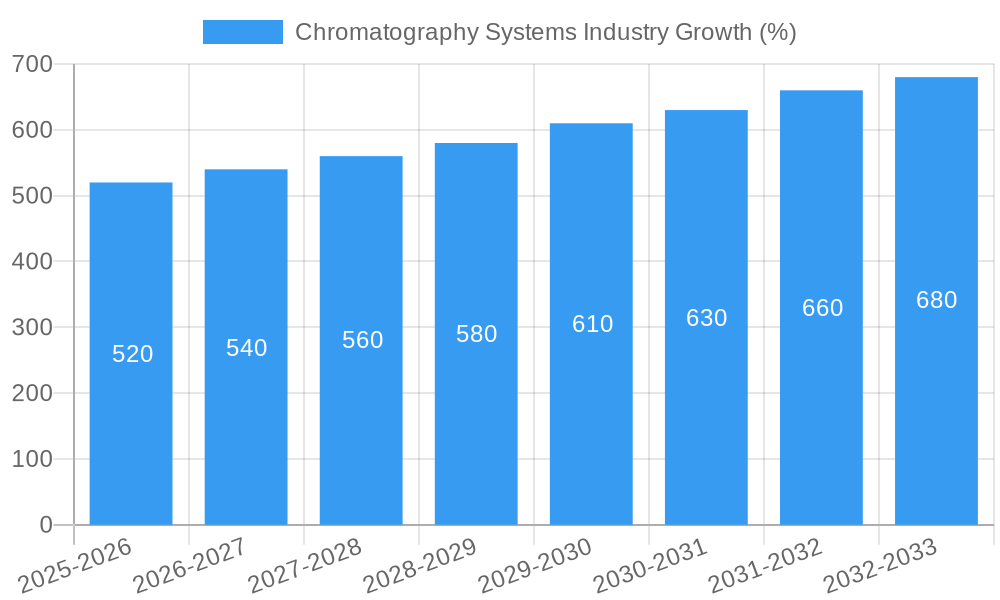
The Chromatography Systems market is experiencing robust growth, driven by increasing demand from pharmaceutical and biotechnology industries, expanding applications in environmental monitoring, and advancements in analytical techniques. The CAGR for the period 2025-2033 is projected to be xx%, reflecting a strong market expansion. Technological disruptions, such as the development of advanced detectors and improved column technology, are further fueling growth. Consumer preferences are shifting towards more efficient, automated, and user-friendly systems, creating opportunities for innovative products. Competitive dynamics are characterized by intense competition among established players, with a focus on product differentiation, technological advancements, and strategic partnerships. Market penetration in emerging economies is expected to increase significantly over the forecast period, particularly in regions with growing healthcare infrastructure and environmental regulations.
Dominant Regions & Segments in Chromatography Systems Industry
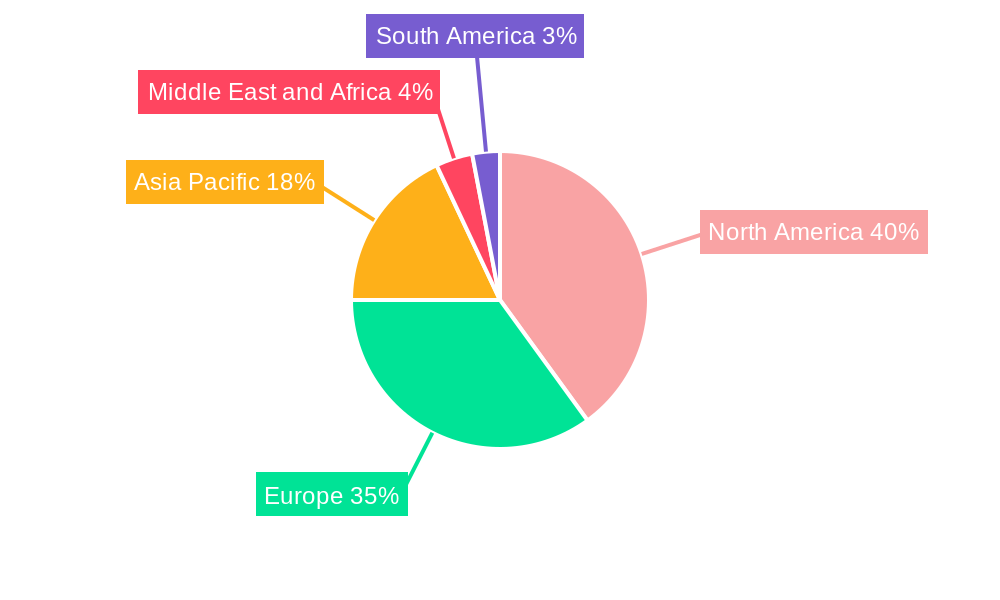
The pharmaceutical sector dominates the Chromatography Systems market application segment, with pharmaceutical firms representing xx% of the total market value in 2025. North America currently holds the largest regional market share, primarily due to strong research and development activity, well-established regulatory frameworks, and high adoption rates in pharmaceutical and clinical research.
Key Drivers:
- North America: Strong R&D investment, advanced healthcare infrastructure, stringent regulatory frameworks.
- Europe: Significant pharmaceutical industry presence, robust environmental regulations.
- Asia-Pacific: Rapidly expanding healthcare sector, increasing government funding for R&D, growing demand from emerging markets.
Segment Dominance:
- By Application: Pharmaceutical Firms are the largest segment, driven by stringent quality control requirements and the need for advanced analytical techniques.
- By Device: High-Performance Liquid Chromatography (HPLC) systems command the largest segment of the market due to their versatility and widespread use across various applications.
- By Consumables/Accessories: Consumables, including columns and solvents, represent a significant and steadily growing market share, owing to their recurring demand.
Chromatography Systems Industry Product Innovations
Recent innovations in Chromatography Systems focus on enhanced sensitivity, reduced analysis time, and improved user-friendliness. The integration of advanced detectors, such as mass spectrometers, and the development of novel stationary phases for separation columns are driving significant advancements. Miniaturization of systems, enabling higher throughput and reduced reagent consumption, is also a key trend. These innovations cater to the needs of diverse applications, from pharmaceutical quality control to environmental monitoring, and offer competitive advantages through improved efficiency and performance.
Report Scope & Segmentation Analysis
This report segments the Chromatography Systems market by device type (including HPLC, Gas Chromatography (GC), Thin Layer Chromatography (TLC), and others), application (Pharmaceutical Firms, Clinical Research Organizations, Environmental Testing, Agriculture, and others), and consumables and accessories. Each segment's growth projections, market sizes for 2025 and beyond, and competitive dynamics are analyzed in detail.
Key Drivers of Chromatography Systems Industry Growth
The Chromatography Systems industry’s growth is fueled by several factors: the rising demand for advanced analytical techniques in the pharmaceutical and biotechnology sectors, increasingly stringent regulatory requirements for environmental monitoring, and the ongoing development of novel applications. Technological advancements, such as the development of high-resolution detectors and advanced column technologies, further enhance market growth. Government investments in research and development also contribute to market expansion, particularly in regions focusing on biotechnology and environmental sustainability.
Challenges in the Chromatography Systems Industry Sector
The Chromatography Systems industry faces challenges including: intense competition among established players, price pressure from generic consumables, and the complexity of regulatory compliance across different geographies. Supply chain disruptions, impacting the availability of critical components, and the rising cost of raw materials also pose significant challenges. These factors can constrain market growth and profitability, particularly for smaller companies.
Emerging Opportunities in Chromatography Systems Industry
Emerging opportunities lie in the development of new applications in fields such as proteomics, metabolomics, and food safety testing. The growing demand for portable and miniaturized systems for on-site analysis creates opportunities for innovation in device design. Furthermore, advancements in data analytics and software integration will enhance the efficiency and value of chromatography data, presenting opportunities for software providers and chromatography system manufacturers.
Leading Players in the Chromatography Systems Industry Market
- Restek Corporation
- Merck KGaA
- Phenomenex
- PerkinElmer Inc
- Waters Corporation
- Cytiva
- Sartorius AG
- Bio-Rad Laboratories
- Gilson Inc
- Thermo Fisher Scientific
- Agilent Technologies
- Shimadzu Corporation
Key Developments in Chromatography Systems Industry
- [Insert specific examples of key developments with dates, e.g., "January 2024: Agilent Technologies launched a new high-performance liquid chromatography system."] Include at least 3-5 examples.
Future Outlook for Chromatography Systems Industry Market
The Chromatography Systems market is poised for continued growth, driven by technological advancements, expanding applications, and increasing demand from various sectors. The rising adoption of advanced analytical techniques in emerging economies and the continuous development of innovative products will further fuel market expansion. Strategic partnerships, acquisitions, and new product launches will play a key role in shaping the future competitive landscape. The focus on automation, miniaturization, and data analytics will drive future market potential and create lucrative strategic opportunities for industry players.
Chromatography Systems Industry Segmentation
-
1. Devices
-
1.1. By Chromatography Systems
- 1.1.1. Gas Chromatography Systems
- 1.1.2. Liquid Chromatography Systems
- 1.1.3. Fluid Chromatography Systems
- 1.1.4. Thin Layer Chromatography Systems
-
1.2. By Consumables
- 1.2.1. Columns
- 1.2.2. Solvents/Reagents/Adsorbents
- 1.2.3. Syringes/Needles
- 1.2.4. Others
-
1.3. By Accessories
- 1.3.1. Column Accessories
- 1.3.2. Auto-Sampler Accessories
- 1.3.3. Pumps
- 1.3.4. Other Accessories
-
1.1. By Chromatography Systems
-
2. Application
- 2.1. Agriculture
- 2.2. Pharmaceutical Firms
- 2.3. Clinical Research Organizations
- 2.4. Environmental Testing
Chromatography Systems Industry Segmentation By Geography
-
1. North America
- 1.1. United States
- 1.2. Canada
- 1.3. Mexico
-
2. Europe
- 2.1. Germany
- 2.2. United Kingdom
- 2.3. France
- 2.4. Italy
- 2.5. Spain
- 2.6. Rest of Europe
-
3. Asia Pacific
- 3.1. China
- 3.2. Japan
- 3.3. India
- 3.4. Australia
- 3.5. South Korea
- 3.6. Rest of Asia Pacific
-
4. Middle East and Africa
- 4.1. GCC
- 4.2. South Africa
- 4.3. Rest of Middle East and Africa
-
5. South America
- 5.1. Brazil
- 5.2. Argentina
- 5.3. Rest of South America
Chromatography Systems Industry REPORT HIGHLIGHTS
| Aspects | Details |
|---|---|
| Study Period | 2019-2033 |
| Base Year | 2024 |
| Estimated Year | 2025 |
| Forecast Period | 2025-2033 |
| Historical Period | 2019-2024 |
| Growth Rate | CAGR of 5.23% from 2019-2033 |
| Segmentation |
|
Table of Contents
- 1. Introduction
- 1.1. Research Scope
- 1.2. Market Segmentation
- 1.3. Research Methodology
- 1.4. Definitions and Assumptions
- 2. Executive Summary
- 2.1. Introduction
- 3. Market Dynamics
- 3.1. Introduction
- 3.2. Market Drivers
- 3.2.1. Chromatography Tests in Drug Approval Process; Advancements in Chromatography Equipment; Growing Food Safety Concerns
- 3.3. Market Restrains
- 3.3.1. High Equipment Costs; Lack of Skilled Personnel for Equipment Handling
- 3.4. Market Trends
- 3.4.1. Liquid Chromatography Systems are Expected to Dominate the Chromatography Instrumentation Market
- 4. Market Factor Analysis
- 4.1. Porters Five Forces
- 4.2. Supply/Value Chain
- 4.3. PESTEL analysis
- 4.4. Market Entropy
- 4.5. Patent/Trademark Analysis
- 5. Global Chromatography Systems Industry Analysis, Insights and Forecast, 2019-2031
- 5.1. Market Analysis, Insights and Forecast - by Devices
- 5.1.1. By Chromatography Systems
- 5.1.1.1. Gas Chromatography Systems
- 5.1.1.2. Liquid Chromatography Systems
- 5.1.1.3. Fluid Chromatography Systems
- 5.1.1.4. Thin Layer Chromatography Systems
- 5.1.2. By Consumables
- 5.1.2.1. Columns
- 5.1.2.2. Solvents/Reagents/Adsorbents
- 5.1.2.3. Syringes/Needles
- 5.1.2.4. Others
- 5.1.3. By Accessories
- 5.1.3.1. Column Accessories
- 5.1.3.2. Auto-Sampler Accessories
- 5.1.3.3. Pumps
- 5.1.3.4. Other Accessories
- 5.1.1. By Chromatography Systems
- 5.2. Market Analysis, Insights and Forecast - by Application
- 5.2.1. Agriculture
- 5.2.2. Pharmaceutical Firms
- 5.2.3. Clinical Research Organizations
- 5.2.4. Environmental Testing
- 5.3. Market Analysis, Insights and Forecast - by Region
- 5.3.1. North America
- 5.3.2. Europe
- 5.3.3. Asia Pacific
- 5.3.4. Middle East and Africa
- 5.3.5. South America
- 5.1. Market Analysis, Insights and Forecast - by Devices
- 6. North America Chromatography Systems Industry Analysis, Insights and Forecast, 2019-2031
- 6.1. Market Analysis, Insights and Forecast - by Devices
- 6.1.1. By Chromatography Systems
- 6.1.1.1. Gas Chromatography Systems
- 6.1.1.2. Liquid Chromatography Systems
- 6.1.1.3. Fluid Chromatography Systems
- 6.1.1.4. Thin Layer Chromatography Systems
- 6.1.2. By Consumables
- 6.1.2.1. Columns
- 6.1.2.2. Solvents/Reagents/Adsorbents
- 6.1.2.3. Syringes/Needles
- 6.1.2.4. Others
- 6.1.3. By Accessories
- 6.1.3.1. Column Accessories
- 6.1.3.2. Auto-Sampler Accessories
- 6.1.3.3. Pumps
- 6.1.3.4. Other Accessories
- 6.1.1. By Chromatography Systems
- 6.2. Market Analysis, Insights and Forecast - by Application
- 6.2.1. Agriculture
- 6.2.2. Pharmaceutical Firms
- 6.2.3. Clinical Research Organizations
- 6.2.4. Environmental Testing
- 6.1. Market Analysis, Insights and Forecast - by Devices
- 7. Europe Chromatography Systems Industry Analysis, Insights and Forecast, 2019-2031
- 7.1. Market Analysis, Insights and Forecast - by Devices
- 7.1.1. By Chromatography Systems
- 7.1.1.1. Gas Chromatography Systems
- 7.1.1.2. Liquid Chromatography Systems
- 7.1.1.3. Fluid Chromatography Systems
- 7.1.1.4. Thin Layer Chromatography Systems
- 7.1.2. By Consumables
- 7.1.2.1. Columns
- 7.1.2.2. Solvents/Reagents/Adsorbents
- 7.1.2.3. Syringes/Needles
- 7.1.2.4. Others
- 7.1.3. By Accessories
- 7.1.3.1. Column Accessories
- 7.1.3.2. Auto-Sampler Accessories
- 7.1.3.3. Pumps
- 7.1.3.4. Other Accessories
- 7.1.1. By Chromatography Systems
- 7.2. Market Analysis, Insights and Forecast - by Application
- 7.2.1. Agriculture
- 7.2.2. Pharmaceutical Firms
- 7.2.3. Clinical Research Organizations
- 7.2.4. Environmental Testing
- 7.1. Market Analysis, Insights and Forecast - by Devices
- 8. Asia Pacific Chromatography Systems Industry Analysis, Insights and Forecast, 2019-2031
- 8.1. Market Analysis, Insights and Forecast - by Devices
- 8.1.1. By Chromatography Systems
- 8.1.1.1. Gas Chromatography Systems
- 8.1.1.2. Liquid Chromatography Systems
- 8.1.1.3. Fluid Chromatography Systems
- 8.1.1.4. Thin Layer Chromatography Systems
- 8.1.2. By Consumables
- 8.1.2.1. Columns
- 8.1.2.2. Solvents/Reagents/Adsorbents
- 8.1.2.3. Syringes/Needles
- 8.1.2.4. Others
- 8.1.3. By Accessories
- 8.1.3.1. Column Accessories
- 8.1.3.2. Auto-Sampler Accessories
- 8.1.3.3. Pumps
- 8.1.3.4. Other Accessories
- 8.1.1. By Chromatography Systems
- 8.2. Market Analysis, Insights and Forecast - by Application
- 8.2.1. Agriculture
- 8.2.2. Pharmaceutical Firms
- 8.2.3. Clinical Research Organizations
- 8.2.4. Environmental Testing
- 8.1. Market Analysis, Insights and Forecast - by Devices
- 9. Middle East and Africa Chromatography Systems Industry Analysis, Insights and Forecast, 2019-2031
- 9.1. Market Analysis, Insights and Forecast - by Devices
- 9.1.1. By Chromatography Systems
- 9.1.1.1. Gas Chromatography Systems
- 9.1.1.2. Liquid Chromatography Systems
- 9.1.1.3. Fluid Chromatography Systems
- 9.1.1.4. Thin Layer Chromatography Systems
- 9.1.2. By Consumables
- 9.1.2.1. Columns
- 9.1.2.2. Solvents/Reagents/Adsorbents
- 9.1.2.3. Syringes/Needles
- 9.1.2.4. Others
- 9.1.3. By Accessories
- 9.1.3.1. Column Accessories
- 9.1.3.2. Auto-Sampler Accessories
- 9.1.3.3. Pumps
- 9.1.3.4. Other Accessories
- 9.1.1. By Chromatography Systems
- 9.2. Market Analysis, Insights and Forecast - by Application
- 9.2.1. Agriculture
- 9.2.2. Pharmaceutical Firms
- 9.2.3. Clinical Research Organizations
- 9.2.4. Environmental Testing
- 9.1. Market Analysis, Insights and Forecast - by Devices
- 10. South America Chromatography Systems Industry Analysis, Insights and Forecast, 2019-2031
- 10.1. Market Analysis, Insights and Forecast - by Devices
- 10.1.1. By Chromatography Systems
- 10.1.1.1. Gas Chromatography Systems
- 10.1.1.2. Liquid Chromatography Systems
- 10.1.1.3. Fluid Chromatography Systems
- 10.1.1.4. Thin Layer Chromatography Systems
- 10.1.2. By Consumables
- 10.1.2.1. Columns
- 10.1.2.2. Solvents/Reagents/Adsorbents
- 10.1.2.3. Syringes/Needles
- 10.1.2.4. Others
- 10.1.3. By Accessories
- 10.1.3.1. Column Accessories
- 10.1.3.2. Auto-Sampler Accessories
- 10.1.3.3. Pumps
- 10.1.3.4. Other Accessories
- 10.1.1. By Chromatography Systems
- 10.2. Market Analysis, Insights and Forecast - by Application
- 10.2.1. Agriculture
- 10.2.2. Pharmaceutical Firms
- 10.2.3. Clinical Research Organizations
- 10.2.4. Environmental Testing
- 10.1. Market Analysis, Insights and Forecast - by Devices
- 11. North America Chromatography Systems Industry Analysis, Insights and Forecast, 2019-2031
- 11.1. Market Analysis, Insights and Forecast - By Country/Sub-region
- 11.1.1 United States
- 11.1.2 Canada
- 11.1.3 Mexico
- 12. Europe Chromatography Systems Industry Analysis, Insights and Forecast, 2019-2031
- 12.1. Market Analysis, Insights and Forecast - By Country/Sub-region
- 12.1.1 Germany
- 12.1.2 United Kingdom
- 12.1.3 France
- 12.1.4 Italy
- 12.1.5 Spain
- 12.1.6 Rest of Europe
- 13. Asia Pacific Chromatography Systems Industry Analysis, Insights and Forecast, 2019-2031
- 13.1. Market Analysis, Insights and Forecast - By Country/Sub-region
- 13.1.1 China
- 13.1.2 Japan
- 13.1.3 India
- 13.1.4 Australia
- 13.1.5 South Korea
- 13.1.6 Rest of Asia Pacific
- 14. Middle East and Africa Chromatography Systems Industry Analysis, Insights and Forecast, 2019-2031
- 14.1. Market Analysis, Insights and Forecast - By Country/Sub-region
- 14.1.1 GCC
- 14.1.2 South Africa
- 14.1.3 Rest of Middle East and Africa
- 15. South America Chromatography Systems Industry Analysis, Insights and Forecast, 2019-2031
- 15.1. Market Analysis, Insights and Forecast - By Country/Sub-region
- 15.1.1 Brazil
- 15.1.2 Argentina
- 15.1.3 Rest of South America
- 16. Competitive Analysis
- 16.1. Global Market Share Analysis 2024
- 16.2. Company Profiles
- 16.2.1 Restek Corporation
- 16.2.1.1. Overview
- 16.2.1.2. Products
- 16.2.1.3. SWOT Analysis
- 16.2.1.4. Recent Developments
- 16.2.1.5. Financials (Based on Availability)
- 16.2.2 Merck KGaA
- 16.2.2.1. Overview
- 16.2.2.2. Products
- 16.2.2.3. SWOT Analysis
- 16.2.2.4. Recent Developments
- 16.2.2.5. Financials (Based on Availability)
- 16.2.3 Phenomenex
- 16.2.3.1. Overview
- 16.2.3.2. Products
- 16.2.3.3. SWOT Analysis
- 16.2.3.4. Recent Developments
- 16.2.3.5. Financials (Based on Availability)
- 16.2.4 Perkinelmer Inc
- 16.2.4.1. Overview
- 16.2.4.2. Products
- 16.2.4.3. SWOT Analysis
- 16.2.4.4. Recent Developments
- 16.2.4.5. Financials (Based on Availability)
- 16.2.5 Waters Corporation
- 16.2.5.1. Overview
- 16.2.5.2. Products
- 16.2.5.3. SWOT Analysis
- 16.2.5.4. Recent Developments
- 16.2.5.5. Financials (Based on Availability)
- 16.2.6 Cytiva
- 16.2.6.1. Overview
- 16.2.6.2. Products
- 16.2.6.3. SWOT Analysis
- 16.2.6.4. Recent Developments
- 16.2.6.5. Financials (Based on Availability)
- 16.2.7 Sartorius AG
- 16.2.7.1. Overview
- 16.2.7.2. Products
- 16.2.7.3. SWOT Analysis
- 16.2.7.4. Recent Developments
- 16.2.7.5. Financials (Based on Availability)
- 16.2.8 Bio-Rad Laboratories
- 16.2.8.1. Overview
- 16.2.8.2. Products
- 16.2.8.3. SWOT Analysis
- 16.2.8.4. Recent Developments
- 16.2.8.5. Financials (Based on Availability)
- 16.2.9 Gilson Inc
- 16.2.9.1. Overview
- 16.2.9.2. Products
- 16.2.9.3. SWOT Analysis
- 16.2.9.4. Recent Developments
- 16.2.9.5. Financials (Based on Availability)
- 16.2.10 Thermo Fisher Scientific
- 16.2.10.1. Overview
- 16.2.10.2. Products
- 16.2.10.3. SWOT Analysis
- 16.2.10.4. Recent Developments
- 16.2.10.5. Financials (Based on Availability)
- 16.2.11 Agilent Technologies
- 16.2.11.1. Overview
- 16.2.11.2. Products
- 16.2.11.3. SWOT Analysis
- 16.2.11.4. Recent Developments
- 16.2.11.5. Financials (Based on Availability)
- 16.2.12 Shimadzu Corporation
- 16.2.12.1. Overview
- 16.2.12.2. Products
- 16.2.12.3. SWOT Analysis
- 16.2.12.4. Recent Developments
- 16.2.12.5. Financials (Based on Availability)
- 16.2.1 Restek Corporation
List of Figures
- Figure 1: Global Chromatography Systems Industry Revenue Breakdown (Million, %) by Region 2024 & 2032
- Figure 2: Global Chromatography Systems Industry Volume Breakdown (K Unit, %) by Region 2024 & 2032
- Figure 3: North America Chromatography Systems Industry Revenue (Million), by Country 2024 & 2032
- Figure 4: North America Chromatography Systems Industry Volume (K Unit), by Country 2024 & 2032
- Figure 5: North America Chromatography Systems Industry Revenue Share (%), by Country 2024 & 2032
- Figure 6: North America Chromatography Systems Industry Volume Share (%), by Country 2024 & 2032
- Figure 7: Europe Chromatography Systems Industry Revenue (Million), by Country 2024 & 2032
- Figure 8: Europe Chromatography Systems Industry Volume (K Unit), by Country 2024 & 2032
- Figure 9: Europe Chromatography Systems Industry Revenue Share (%), by Country 2024 & 2032
- Figure 10: Europe Chromatography Systems Industry Volume Share (%), by Country 2024 & 2032
- Figure 11: Asia Pacific Chromatography Systems Industry Revenue (Million), by Country 2024 & 2032
- Figure 12: Asia Pacific Chromatography Systems Industry Volume (K Unit), by Country 2024 & 2032
- Figure 13: Asia Pacific Chromatography Systems Industry Revenue Share (%), by Country 2024 & 2032
- Figure 14: Asia Pacific Chromatography Systems Industry Volume Share (%), by Country 2024 & 2032
- Figure 15: Middle East and Africa Chromatography Systems Industry Revenue (Million), by Country 2024 & 2032
- Figure 16: Middle East and Africa Chromatography Systems Industry Volume (K Unit), by Country 2024 & 2032
- Figure 17: Middle East and Africa Chromatography Systems Industry Revenue Share (%), by Country 2024 & 2032
- Figure 18: Middle East and Africa Chromatography Systems Industry Volume Share (%), by Country 2024 & 2032
- Figure 19: South America Chromatography Systems Industry Revenue (Million), by Country 2024 & 2032
- Figure 20: South America Chromatography Systems Industry Volume (K Unit), by Country 2024 & 2032
- Figure 21: South America Chromatography Systems Industry Revenue Share (%), by Country 2024 & 2032
- Figure 22: South America Chromatography Systems Industry Volume Share (%), by Country 2024 & 2032
- Figure 23: North America Chromatography Systems Industry Revenue (Million), by Devices 2024 & 2032
- Figure 24: North America Chromatography Systems Industry Volume (K Unit), by Devices 2024 & 2032
- Figure 25: North America Chromatography Systems Industry Revenue Share (%), by Devices 2024 & 2032
- Figure 26: North America Chromatography Systems Industry Volume Share (%), by Devices 2024 & 2032
- Figure 27: North America Chromatography Systems Industry Revenue (Million), by Application 2024 & 2032
- Figure 28: North America Chromatography Systems Industry Volume (K Unit), by Application 2024 & 2032
- Figure 29: North America Chromatography Systems Industry Revenue Share (%), by Application 2024 & 2032
- Figure 30: North America Chromatography Systems Industry Volume Share (%), by Application 2024 & 2032
- Figure 31: North America Chromatography Systems Industry Revenue (Million), by Country 2024 & 2032
- Figure 32: North America Chromatography Systems Industry Volume (K Unit), by Country 2024 & 2032
- Figure 33: North America Chromatography Systems Industry Revenue Share (%), by Country 2024 & 2032
- Figure 34: North America Chromatography Systems Industry Volume Share (%), by Country 2024 & 2032
- Figure 35: Europe Chromatography Systems Industry Revenue (Million), by Devices 2024 & 2032
- Figure 36: Europe Chromatography Systems Industry Volume (K Unit), by Devices 2024 & 2032
- Figure 37: Europe Chromatography Systems Industry Revenue Share (%), by Devices 2024 & 2032
- Figure 38: Europe Chromatography Systems Industry Volume Share (%), by Devices 2024 & 2032
- Figure 39: Europe Chromatography Systems Industry Revenue (Million), by Application 2024 & 2032
- Figure 40: Europe Chromatography Systems Industry Volume (K Unit), by Application 2024 & 2032
- Figure 41: Europe Chromatography Systems Industry Revenue Share (%), by Application 2024 & 2032
- Figure 42: Europe Chromatography Systems Industry Volume Share (%), by Application 2024 & 2032
- Figure 43: Europe Chromatography Systems Industry Revenue (Million), by Country 2024 & 2032
- Figure 44: Europe Chromatography Systems Industry Volume (K Unit), by Country 2024 & 2032
- Figure 45: Europe Chromatography Systems Industry Revenue Share (%), by Country 2024 & 2032
- Figure 46: Europe Chromatography Systems Industry Volume Share (%), by Country 2024 & 2032
- Figure 47: Asia Pacific Chromatography Systems Industry Revenue (Million), by Devices 2024 & 2032
- Figure 48: Asia Pacific Chromatography Systems Industry Volume (K Unit), by Devices 2024 & 2032
- Figure 49: Asia Pacific Chromatography Systems Industry Revenue Share (%), by Devices 2024 & 2032
- Figure 50: Asia Pacific Chromatography Systems Industry Volume Share (%), by Devices 2024 & 2032
- Figure 51: Asia Pacific Chromatography Systems Industry Revenue (Million), by Application 2024 & 2032
- Figure 52: Asia Pacific Chromatography Systems Industry Volume (K Unit), by Application 2024 & 2032
- Figure 53: Asia Pacific Chromatography Systems Industry Revenue Share (%), by Application 2024 & 2032
- Figure 54: Asia Pacific Chromatography Systems Industry Volume Share (%), by Application 2024 & 2032
- Figure 55: Asia Pacific Chromatography Systems Industry Revenue (Million), by Country 2024 & 2032
- Figure 56: Asia Pacific Chromatography Systems Industry Volume (K Unit), by Country 2024 & 2032
- Figure 57: Asia Pacific Chromatography Systems Industry Revenue Share (%), by Country 2024 & 2032
- Figure 58: Asia Pacific Chromatography Systems Industry Volume Share (%), by Country 2024 & 2032
- Figure 59: Middle East and Africa Chromatography Systems Industry Revenue (Million), by Devices 2024 & 2032
- Figure 60: Middle East and Africa Chromatography Systems Industry Volume (K Unit), by Devices 2024 & 2032
- Figure 61: Middle East and Africa Chromatography Systems Industry Revenue Share (%), by Devices 2024 & 2032
- Figure 62: Middle East and Africa Chromatography Systems Industry Volume Share (%), by Devices 2024 & 2032
- Figure 63: Middle East and Africa Chromatography Systems Industry Revenue (Million), by Application 2024 & 2032
- Figure 64: Middle East and Africa Chromatography Systems Industry Volume (K Unit), by Application 2024 & 2032
- Figure 65: Middle East and Africa Chromatography Systems Industry Revenue Share (%), by Application 2024 & 2032
- Figure 66: Middle East and Africa Chromatography Systems Industry Volume Share (%), by Application 2024 & 2032
- Figure 67: Middle East and Africa Chromatography Systems Industry Revenue (Million), by Country 2024 & 2032
- Figure 68: Middle East and Africa Chromatography Systems Industry Volume (K Unit), by Country 2024 & 2032
- Figure 69: Middle East and Africa Chromatography Systems Industry Revenue Share (%), by Country 2024 & 2032
- Figure 70: Middle East and Africa Chromatography Systems Industry Volume Share (%), by Country 2024 & 2032
- Figure 71: South America Chromatography Systems Industry Revenue (Million), by Devices 2024 & 2032
- Figure 72: South America Chromatography Systems Industry Volume (K Unit), by Devices 2024 & 2032
- Figure 73: South America Chromatography Systems Industry Revenue Share (%), by Devices 2024 & 2032
- Figure 74: South America Chromatography Systems Industry Volume Share (%), by Devices 2024 & 2032
- Figure 75: South America Chromatography Systems Industry Revenue (Million), by Application 2024 & 2032
- Figure 76: South America Chromatography Systems Industry Volume (K Unit), by Application 2024 & 2032
- Figure 77: South America Chromatography Systems Industry Revenue Share (%), by Application 2024 & 2032
- Figure 78: South America Chromatography Systems Industry Volume Share (%), by Application 2024 & 2032
- Figure 79: South America Chromatography Systems Industry Revenue (Million), by Country 2024 & 2032
- Figure 80: South America Chromatography Systems Industry Volume (K Unit), by Country 2024 & 2032
- Figure 81: South America Chromatography Systems Industry Revenue Share (%), by Country 2024 & 2032
- Figure 82: South America Chromatography Systems Industry Volume Share (%), by Country 2024 & 2032
List of Tables
- Table 1: Global Chromatography Systems Industry Revenue Million Forecast, by Region 2019 & 2032
- Table 2: Global Chromatography Systems Industry Volume K Unit Forecast, by Region 2019 & 2032
- Table 3: Global Chromatography Systems Industry Revenue Million Forecast, by Devices 2019 & 2032
- Table 4: Global Chromatography Systems Industry Volume K Unit Forecast, by Devices 2019 & 2032
- Table 5: Global Chromatography Systems Industry Revenue Million Forecast, by Application 2019 & 2032
- Table 6: Global Chromatography Systems Industry Volume K Unit Forecast, by Application 2019 & 2032
- Table 7: Global Chromatography Systems Industry Revenue Million Forecast, by Region 2019 & 2032
- Table 8: Global Chromatography Systems Industry Volume K Unit Forecast, by Region 2019 & 2032
- Table 9: Global Chromatography Systems Industry Revenue Million Forecast, by Country 2019 & 2032
- Table 10: Global Chromatography Systems Industry Volume K Unit Forecast, by Country 2019 & 2032
- Table 11: United States Chromatography Systems Industry Revenue (Million) Forecast, by Application 2019 & 2032
- Table 12: United States Chromatography Systems Industry Volume (K Unit) Forecast, by Application 2019 & 2032
- Table 13: Canada Chromatography Systems Industry Revenue (Million) Forecast, by Application 2019 & 2032
- Table 14: Canada Chromatography Systems Industry Volume (K Unit) Forecast, by Application 2019 & 2032
- Table 15: Mexico Chromatography Systems Industry Revenue (Million) Forecast, by Application 2019 & 2032
- Table 16: Mexico Chromatography Systems Industry Volume (K Unit) Forecast, by Application 2019 & 2032
- Table 17: Global Chromatography Systems Industry Revenue Million Forecast, by Country 2019 & 2032
- Table 18: Global Chromatography Systems Industry Volume K Unit Forecast, by Country 2019 & 2032
- Table 19: Germany Chromatography Systems Industry Revenue (Million) Forecast, by Application 2019 & 2032
- Table 20: Germany Chromatography Systems Industry Volume (K Unit) Forecast, by Application 2019 & 2032
- Table 21: United Kingdom Chromatography Systems Industry Revenue (Million) Forecast, by Application 2019 & 2032
- Table 22: United Kingdom Chromatography Systems Industry Volume (K Unit) Forecast, by Application 2019 & 2032
- Table 23: France Chromatography Systems Industry Revenue (Million) Forecast, by Application 2019 & 2032
- Table 24: France Chromatography Systems Industry Volume (K Unit) Forecast, by Application 2019 & 2032
- Table 25: Italy Chromatography Systems Industry Revenue (Million) Forecast, by Application 2019 & 2032
- Table 26: Italy Chromatography Systems Industry Volume (K Unit) Forecast, by Application 2019 & 2032
- Table 27: Spain Chromatography Systems Industry Revenue (Million) Forecast, by Application 2019 & 2032
- Table 28: Spain Chromatography Systems Industry Volume (K Unit) Forecast, by Application 2019 & 2032
- Table 29: Rest of Europe Chromatography Systems Industry Revenue (Million) Forecast, by Application 2019 & 2032
- Table 30: Rest of Europe Chromatography Systems Industry Volume (K Unit) Forecast, by Application 2019 & 2032
- Table 31: Global Chromatography Systems Industry Revenue Million Forecast, by Country 2019 & 2032
- Table 32: Global Chromatography Systems Industry Volume K Unit Forecast, by Country 2019 & 2032
- Table 33: China Chromatography Systems Industry Revenue (Million) Forecast, by Application 2019 & 2032
- Table 34: China Chromatography Systems Industry Volume (K Unit) Forecast, by Application 2019 & 2032
- Table 35: Japan Chromatography Systems Industry Revenue (Million) Forecast, by Application 2019 & 2032
- Table 36: Japan Chromatography Systems Industry Volume (K Unit) Forecast, by Application 2019 & 2032
- Table 37: India Chromatography Systems Industry Revenue (Million) Forecast, by Application 2019 & 2032
- Table 38: India Chromatography Systems Industry Volume (K Unit) Forecast, by Application 2019 & 2032
- Table 39: Australia Chromatography Systems Industry Revenue (Million) Forecast, by Application 2019 & 2032
- Table 40: Australia Chromatography Systems Industry Volume (K Unit) Forecast, by Application 2019 & 2032
- Table 41: South Korea Chromatography Systems Industry Revenue (Million) Forecast, by Application 2019 & 2032
- Table 42: South Korea Chromatography Systems Industry Volume (K Unit) Forecast, by Application 2019 & 2032
- Table 43: Rest of Asia Pacific Chromatography Systems Industry Revenue (Million) Forecast, by Application 2019 & 2032
- Table 44: Rest of Asia Pacific Chromatography Systems Industry Volume (K Unit) Forecast, by Application 2019 & 2032
- Table 45: Global Chromatography Systems Industry Revenue Million Forecast, by Country 2019 & 2032
- Table 46: Global Chromatography Systems Industry Volume K Unit Forecast, by Country 2019 & 2032
- Table 47: GCC Chromatography Systems Industry Revenue (Million) Forecast, by Application 2019 & 2032
- Table 48: GCC Chromatography Systems Industry Volume (K Unit) Forecast, by Application 2019 & 2032
- Table 49: South Africa Chromatography Systems Industry Revenue (Million) Forecast, by Application 2019 & 2032
- Table 50: South Africa Chromatography Systems Industry Volume (K Unit) Forecast, by Application 2019 & 2032
- Table 51: Rest of Middle East and Africa Chromatography Systems Industry Revenue (Million) Forecast, by Application 2019 & 2032
- Table 52: Rest of Middle East and Africa Chromatography Systems Industry Volume (K Unit) Forecast, by Application 2019 & 2032
- Table 53: Global Chromatography Systems Industry Revenue Million Forecast, by Country 2019 & 2032
- Table 54: Global Chromatography Systems Industry Volume K Unit Forecast, by Country 2019 & 2032
- Table 55: Brazil Chromatography Systems Industry Revenue (Million) Forecast, by Application 2019 & 2032
- Table 56: Brazil Chromatography Systems Industry Volume (K Unit) Forecast, by Application 2019 & 2032
- Table 57: Argentina Chromatography Systems Industry Revenue (Million) Forecast, by Application 2019 & 2032
- Table 58: Argentina Chromatography Systems Industry Volume (K Unit) Forecast, by Application 2019 & 2032
- Table 59: Rest of South America Chromatography Systems Industry Revenue (Million) Forecast, by Application 2019 & 2032
- Table 60: Rest of South America Chromatography Systems Industry Volume (K Unit) Forecast, by Application 2019 & 2032
- Table 61: Global Chromatography Systems Industry Revenue Million Forecast, by Devices 2019 & 2032
- Table 62: Global Chromatography Systems Industry Volume K Unit Forecast, by Devices 2019 & 2032
- Table 63: Global Chromatography Systems Industry Revenue Million Forecast, by Application 2019 & 2032
- Table 64: Global Chromatography Systems Industry Volume K Unit Forecast, by Application 2019 & 2032
- Table 65: Global Chromatography Systems Industry Revenue Million Forecast, by Country 2019 & 2032
- Table 66: Global Chromatography Systems Industry Volume K Unit Forecast, by Country 2019 & 2032
- Table 67: United States Chromatography Systems Industry Revenue (Million) Forecast, by Application 2019 & 2032
- Table 68: United States Chromatography Systems Industry Volume (K Unit) Forecast, by Application 2019 & 2032
- Table 69: Canada Chromatography Systems Industry Revenue (Million) Forecast, by Application 2019 & 2032
- Table 70: Canada Chromatography Systems Industry Volume (K Unit) Forecast, by Application 2019 & 2032
- Table 71: Mexico Chromatography Systems Industry Revenue (Million) Forecast, by Application 2019 & 2032
- Table 72: Mexico Chromatography Systems Industry Volume (K Unit) Forecast, by Application 2019 & 2032
- Table 73: Global Chromatography Systems Industry Revenue Million Forecast, by Devices 2019 & 2032
- Table 74: Global Chromatography Systems Industry Volume K Unit Forecast, by Devices 2019 & 2032
- Table 75: Global Chromatography Systems Industry Revenue Million Forecast, by Application 2019 & 2032
- Table 76: Global Chromatography Systems Industry Volume K Unit Forecast, by Application 2019 & 2032
- Table 77: Global Chromatography Systems Industry Revenue Million Forecast, by Country 2019 & 2032
- Table 78: Global Chromatography Systems Industry Volume K Unit Forecast, by Country 2019 & 2032
- Table 79: Germany Chromatography Systems Industry Revenue (Million) Forecast, by Application 2019 & 2032
- Table 80: Germany Chromatography Systems Industry Volume (K Unit) Forecast, by Application 2019 & 2032
- Table 81: United Kingdom Chromatography Systems Industry Revenue (Million) Forecast, by Application 2019 & 2032
- Table 82: United Kingdom Chromatography Systems Industry Volume (K Unit) Forecast, by Application 2019 & 2032
- Table 83: France Chromatography Systems Industry Revenue (Million) Forecast, by Application 2019 & 2032
- Table 84: France Chromatography Systems Industry Volume (K Unit) Forecast, by Application 2019 & 2032
- Table 85: Italy Chromatography Systems Industry Revenue (Million) Forecast, by Application 2019 & 2032
- Table 86: Italy Chromatography Systems Industry Volume (K Unit) Forecast, by Application 2019 & 2032
- Table 87: Spain Chromatography Systems Industry Revenue (Million) Forecast, by Application 2019 & 2032
- Table 88: Spain Chromatography Systems Industry Volume (K Unit) Forecast, by Application 2019 & 2032
- Table 89: Rest of Europe Chromatography Systems Industry Revenue (Million) Forecast, by Application 2019 & 2032
- Table 90: Rest of Europe Chromatography Systems Industry Volume (K Unit) Forecast, by Application 2019 & 2032
- Table 91: Global Chromatography Systems Industry Revenue Million Forecast, by Devices 2019 & 2032
- Table 92: Global Chromatography Systems Industry Volume K Unit Forecast, by Devices 2019 & 2032
- Table 93: Global Chromatography Systems Industry Revenue Million Forecast, by Application 2019 & 2032
- Table 94: Global Chromatography Systems Industry Volume K Unit Forecast, by Application 2019 & 2032
- Table 95: Global Chromatography Systems Industry Revenue Million Forecast, by Country 2019 & 2032
- Table 96: Global Chromatography Systems Industry Volume K Unit Forecast, by Country 2019 & 2032
- Table 97: China Chromatography Systems Industry Revenue (Million) Forecast, by Application 2019 & 2032
- Table 98: China Chromatography Systems Industry Volume (K Unit) Forecast, by Application 2019 & 2032
- Table 99: Japan Chromatography Systems Industry Revenue (Million) Forecast, by Application 2019 & 2032
- Table 100: Japan Chromatography Systems Industry Volume (K Unit) Forecast, by Application 2019 & 2032
- Table 101: India Chromatography Systems Industry Revenue (Million) Forecast, by Application 2019 & 2032
- Table 102: India Chromatography Systems Industry Volume (K Unit) Forecast, by Application 2019 & 2032
- Table 103: Australia Chromatography Systems Industry Revenue (Million) Forecast, by Application 2019 & 2032
- Table 104: Australia Chromatography Systems Industry Volume (K Unit) Forecast, by Application 2019 & 2032
- Table 105: South Korea Chromatography Systems Industry Revenue (Million) Forecast, by Application 2019 & 2032
- Table 106: South Korea Chromatography Systems Industry Volume (K Unit) Forecast, by Application 2019 & 2032
- Table 107: Rest of Asia Pacific Chromatography Systems Industry Revenue (Million) Forecast, by Application 2019 & 2032
- Table 108: Rest of Asia Pacific Chromatography Systems Industry Volume (K Unit) Forecast, by Application 2019 & 2032
- Table 109: Global Chromatography Systems Industry Revenue Million Forecast, by Devices 2019 & 2032
- Table 110: Global Chromatography Systems Industry Volume K Unit Forecast, by Devices 2019 & 2032
- Table 111: Global Chromatography Systems Industry Revenue Million Forecast, by Application 2019 & 2032
- Table 112: Global Chromatography Systems Industry Volume K Unit Forecast, by Application 2019 & 2032
- Table 113: Global Chromatography Systems Industry Revenue Million Forecast, by Country 2019 & 2032
- Table 114: Global Chromatography Systems Industry Volume K Unit Forecast, by Country 2019 & 2032
- Table 115: GCC Chromatography Systems Industry Revenue (Million) Forecast, by Application 2019 & 2032
- Table 116: GCC Chromatography Systems Industry Volume (K Unit) Forecast, by Application 2019 & 2032
- Table 117: South Africa Chromatography Systems Industry Revenue (Million) Forecast, by Application 2019 & 2032
- Table 118: South Africa Chromatography Systems Industry Volume (K Unit) Forecast, by Application 2019 & 2032
- Table 119: Rest of Middle East and Africa Chromatography Systems Industry Revenue (Million) Forecast, by Application 2019 & 2032
- Table 120: Rest of Middle East and Africa Chromatography Systems Industry Volume (K Unit) Forecast, by Application 2019 & 2032
- Table 121: Global Chromatography Systems Industry Revenue Million Forecast, by Devices 2019 & 2032
- Table 122: Global Chromatography Systems Industry Volume K Unit Forecast, by Devices 2019 & 2032
- Table 123: Global Chromatography Systems Industry Revenue Million Forecast, by Application 2019 & 2032
- Table 124: Global Chromatography Systems Industry Volume K Unit Forecast, by Application 2019 & 2032
- Table 125: Global Chromatography Systems Industry Revenue Million Forecast, by Country 2019 & 2032
- Table 126: Global Chromatography Systems Industry Volume K Unit Forecast, by Country 2019 & 2032
- Table 127: Brazil Chromatography Systems Industry Revenue (Million) Forecast, by Application 2019 & 2032
- Table 128: Brazil Chromatography Systems Industry Volume (K Unit) Forecast, by Application 2019 & 2032
- Table 129: Argentina Chromatography Systems Industry Revenue (Million) Forecast, by Application 2019 & 2032
- Table 130: Argentina Chromatography Systems Industry Volume (K Unit) Forecast, by Application 2019 & 2032
- Table 131: Rest of South America Chromatography Systems Industry Revenue (Million) Forecast, by Application 2019 & 2032
- Table 132: Rest of South America Chromatography Systems Industry Volume (K Unit) Forecast, by Application 2019 & 2032
Frequently Asked Questions
1. What is the projected Compound Annual Growth Rate (CAGR) of the Chromatography Systems Industry?
The projected CAGR is approximately 5.23%.
2. Which companies are prominent players in the Chromatography Systems Industry?
Key companies in the market include Restek Corporation, Merck KGaA, Phenomenex, Perkinelmer Inc, Waters Corporation, Cytiva, Sartorius AG, Bio-Rad Laboratories, Gilson Inc, Thermo Fisher Scientific, Agilent Technologies, Shimadzu Corporation.
3. What are the main segments of the Chromatography Systems Industry?
The market segments include Devices, Application.
4. Can you provide details about the market size?
The market size is estimated to be USD 9.63 Million as of 2022.
5. What are some drivers contributing to market growth?
Chromatography Tests in Drug Approval Process; Advancements in Chromatography Equipment; Growing Food Safety Concerns.
6. What are the notable trends driving market growth?
Liquid Chromatography Systems are Expected to Dominate the Chromatography Instrumentation Market.
7. Are there any restraints impacting market growth?
High Equipment Costs; Lack of Skilled Personnel for Equipment Handling.
8. Can you provide examples of recent developments in the market?
N/A
9. What pricing options are available for accessing the report?
Pricing options include single-user, multi-user, and enterprise licenses priced at USD 4750, USD 5250, and USD 8750 respectively.
10. Is the market size provided in terms of value or volume?
The market size is provided in terms of value, measured in Million and volume, measured in K Unit.
11. Are there any specific market keywords associated with the report?
Yes, the market keyword associated with the report is "Chromatography Systems Industry," which aids in identifying and referencing the specific market segment covered.
12. How do I determine which pricing option suits my needs best?
The pricing options vary based on user requirements and access needs. Individual users may opt for single-user licenses, while businesses requiring broader access may choose multi-user or enterprise licenses for cost-effective access to the report.
13. Are there any additional resources or data provided in the Chromatography Systems Industry report?
While the report offers comprehensive insights, it's advisable to review the specific contents or supplementary materials provided to ascertain if additional resources or data are available.
14. How can I stay updated on further developments or reports in the Chromatography Systems Industry?
To stay informed about further developments, trends, and reports in the Chromatography Systems Industry, consider subscribing to industry newsletters, following relevant companies and organizations, or regularly checking reputable industry news sources and publications.
Methodology
Step 1 - Identification of Relevant Samples Size from Population Database


Step 2 - Approaches for Defining Global Market Size (Value, Volume* & Price*)

Note*: In applicable scenarios
Step 3 - Data Sources
Primary Research
- Web Analytics
- Survey Reports
- Research Institute
- Latest Research Reports
- Opinion Leaders
Secondary Research
- Annual Reports
- White Paper
- Latest Press Release
- Industry Association
- Paid Database
- Investor Presentations

Step 4 - Data Triangulation
Involves using different sources of information in order to increase the validity of a study
These sources are likely to be stakeholders in a program - participants, other researchers, program staff, other community members, and so on.
Then we put all data in single framework & apply various statistical tools to find out the dynamic on the market.
During the analysis stage, feedback from the stakeholder groups would be compared to determine areas of agreement as well as areas of divergence


