
Key Insights
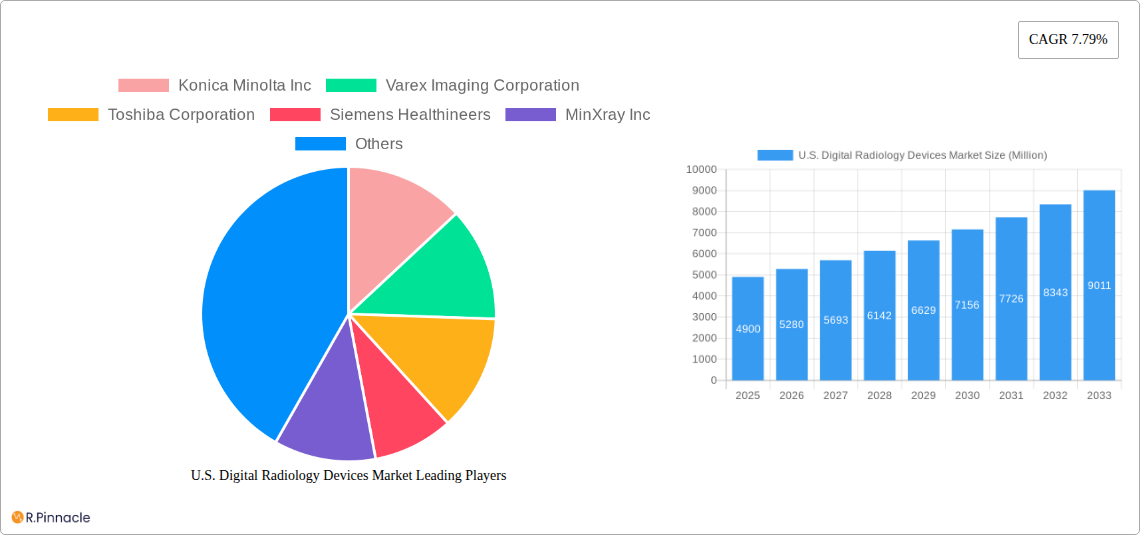
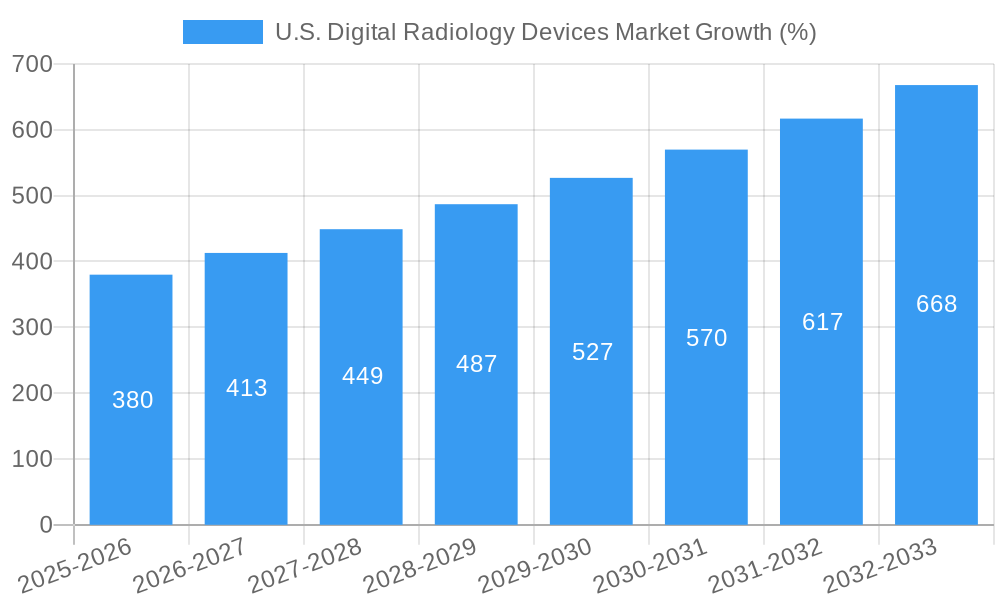
The U.S. digital radiology devices market, valued at $4.90 billion in 2025, is projected to experience robust growth, driven by a compound annual growth rate (CAGR) of 7.79% from 2025 to 2033. This expansion is fueled by several key factors. The increasing prevalence of chronic diseases like cancer and cardiovascular ailments necessitates advanced diagnostic imaging, boosting demand for digital radiology systems. Technological advancements, such as the introduction of more portable and efficient direct radiography systems, are improving image quality and workflow efficiency, further stimulating market growth. Furthermore, the growing adoption of telehealth and remote patient monitoring is creating opportunities for portable digital radiology systems, enabling faster and more convenient diagnostics outside traditional hospital settings. Hospitals and diagnostic centers represent the largest end-user segments, contributing significantly to the market's overall size. The shift toward value-based care models also plays a crucial role, encouraging the adoption of efficient and cost-effective digital imaging solutions.
While the market presents significant opportunities, several challenges exist. High initial investment costs for advanced digital radiology systems can be a barrier for smaller healthcare providers. The need for skilled professionals to operate and maintain these systems and ongoing maintenance costs also pose restraints. Regulatory compliance and data security concerns surrounding the storage and transfer of medical images are additional factors influencing market growth. However, the increasing integration of artificial intelligence (AI) and machine learning (ML) in image analysis is expected to mitigate some of these challenges by improving diagnostic accuracy and efficiency, thereby increasing the overall appeal and adoption rate of digital radiology devices. The competitive landscape is characterized by major players like GE Healthcare, Siemens Healthineers, and Fujifilm, constantly striving to innovate and improve their offerings, driving further market growth. The orthopedic segment is expected to maintain a significant share of the market due to the high incidence of musculoskeletal disorders requiring regular imaging.
U.S. Digital Radiology Devices Market Report: 2019-2033
This comprehensive report provides a detailed analysis of the U.S. digital radiology devices market, offering invaluable insights for industry professionals, investors, and strategic decision-makers. Covering the period from 2019 to 2033 (Study Period), with a focus on 2025 (Base Year and Estimated Year), and forecasting until 2033 (Forecast Period), this report leverages historical data (2019-2024) to project future market trends. The report segments the market by application, technology, portability, and end-user, offering a granular understanding of market dynamics and growth potential. Expect detailed analysis of market size (in Millions), CAGR, competitive landscape, and key drivers and challenges shaping this dynamic sector.
U.S. Digital Radiology Devices Market Market Structure & Innovation Trends
The U.S. digital radiology devices market exhibits a moderately consolidated structure, with key players like GE Healthcare, Siemens Healthineers, and Philips Healthcare holding significant market share (estimated at xx% combined in 2025). However, smaller companies like MinXray Inc. and KUB Technologies Inc. are also making inroads with innovative product offerings. Market concentration is influenced by factors such as technological advancements, regulatory approvals (FDA clearances), and the ongoing consolidation through mergers and acquisitions (M&A). The past few years have witnessed several M&A deals with a total value exceeding xx Million in the last five years. Notable examples include [Insert specific examples if available, otherwise state "examples are omitted due to lack of publicly available data"].
- Innovation Drivers: Continuous improvements in image quality, reduced radiation exposure, enhanced portability, and the integration of AI and machine learning are key innovation drivers.
- Regulatory Framework: FDA regulations play a significant role, influencing product development and market entry. Compliance requirements necessitate robust quality control and clinical trials.
- Product Substitutes: While digital radiology is the dominant technology, alternative imaging modalities like ultrasound and MRI present some level of substitution, albeit often for different applications.
- End-User Demographics: The market is primarily driven by hospitals and diagnostic centers, reflecting their substantial need for high-quality imaging equipment.
- M&A Activities: Consolidation activities have intensified, with larger players acquiring smaller companies to expand their product portfolios and market reach. Several deals valued at xx Million or more have taken place, contributing to market consolidation.
U.S. Digital Radiology Devices Market Market Dynamics & Trends
The U.S. digital radiology devices market is experiencing robust growth, driven by several factors. The increasing prevalence of chronic diseases necessitates advanced diagnostic imaging, fueling demand. Technological advancements, such as AI-powered image analysis and improved detector technology, enhance diagnostic accuracy and workflow efficiency. The rising adoption of minimally invasive procedures increases the demand for high-resolution imaging for precise targeting and guidance. Furthermore, the aging population and rising healthcare expenditure contribute significantly to market growth. The market is expected to register a CAGR of xx% during the forecast period (2025-2033). Market penetration of digital radiography over traditional film-based methods is nearing saturation in major urban areas, though opportunities remain in rural and underserved communities. Competitive dynamics are characterized by ongoing innovation, strategic partnerships, and product differentiation efforts amongst major players.
Dominant Regions & Segments in U.S. Digital Radiology Devices Market
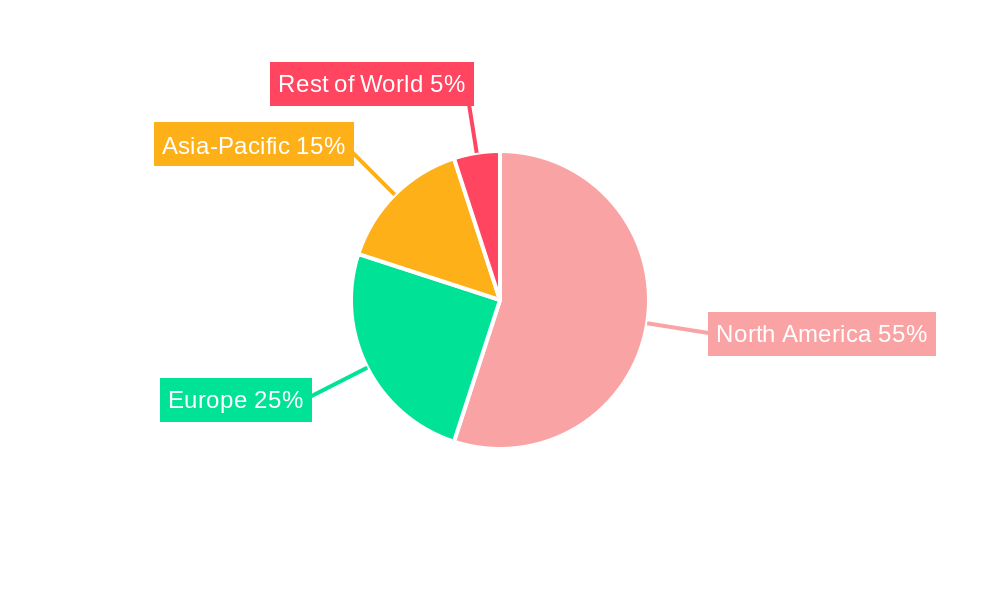
The market shows strong regional variations, with high concentrations in densely populated states with advanced healthcare infrastructure. Specific state-level data is not available for a complete breakdown; however, California, Texas, and Florida are expected to lead the market in terms of revenue generation, driven by factors such as the high density of hospitals, diagnostic centers, and a large population.
Dominant Application Segment: The orthopedic application segment is anticipated to dominate, followed by cardiovascular and cancer applications. This dominance is mainly driven by the increased need for accurate imaging in orthopedic surgeries and the growing incidence of cardiovascular diseases.
Dominant Technology Segment: Direct Radiography (DR) is predicted to hold the largest market share due to its superior image quality and efficiency compared to Computed Radiography (CR).
Dominant Portability Segment: Fixed systems dominate currently, given the preference for advanced features and integration within established hospital radiology departments; however, portable systems are growing significantly due to their increasing need for mobile imaging services.
Dominant End-User Segment: Hospitals are the largest end users, followed by diagnostic imaging centers, driven by their high volume of imaging procedures.
U.S. Digital Radiology Devices Market Product Innovations
Recent product innovations emphasize improved image quality, faster scan times, and increased portability. Manufacturers are incorporating advanced features such as AI-powered image analysis for automated detection of abnormalities, reducing the workload on radiologists. The market is witnessing a trend towards the integration of digital radiology systems with hospital information systems (HIS) and picture archiving and communication systems (PACS) for efficient workflow management. This trend is aimed at improving operational efficiency and reducing costs.
Report Scope & Segmentation Analysis
This report comprehensively segments the U.S. digital radiology devices market across various parameters:
- Application: Orthopedic, Cancer, Dental, Cardiovascular, Other Applications (each segment's market size and growth projections are detailed within the full report).
- Technology: Computed Radiography (CR), Direct Radiography (DR) (detailed analysis of market share and growth trends).
- Portability: Fixed Systems, Portable Systems (comparative analysis of advantages, disadvantages, and market dynamics for each).
- End User: Hospitals, Diagnostic Centers, Other End Users (market size and growth projections based on end-user type).
Each segment’s competitive landscape is assessed, considering factors like market share, revenue, and growth strategies of key players.
Key Drivers of U.S. Digital Radiology Devices Market Growth
The market’s growth is driven by several factors including: increasing prevalence of chronic diseases, technological advancements leading to better image quality and faster scan times, rising healthcare expenditure, growing adoption of minimally invasive procedures, and government initiatives promoting advanced healthcare infrastructure.
Challenges in the U.S. Digital Radiology Devices Market Sector
Challenges include stringent regulatory approvals (FDA), high initial investment costs for advanced systems, the need for skilled technicians and radiologists, competition from other imaging modalities, and potential supply chain disruptions. These factors can impact market growth and profitability.
Emerging Opportunities in U.S. Digital Radiology Devices Market
Emerging opportunities include the integration of AI and machine learning for automated image analysis and disease detection, development of portable and wireless systems for improved accessibility, growth in tele-radiology services, and expansion into underserved rural areas.
Leading Players in the U.S. Digital Radiology Devices Market Market
- Konica Minolta Inc
- Varex Imaging Corporation
- Toshiba Corporation
- Siemens Healthineers
- MinXray Inc
- Hologic Inc
- Hitachi Ltd
- Koninklijke Philips NV (Philips Healthcare)
- KUB Technologies Inc
- Carestream Health
- General Electric Company (GE Healthcare)
- Canon Medical Systems Corporation
- Agfa-Gevaert NV
- Shimadzu Corporation
- Fujifilm Holdings Corporation
- Samsung Electronics Co Ltd (Samsung Medison)
Key Developments in U.S. Digital Radiology Devices Market Industry
- April 2022: Boston Imaging (Samsung) launches the GM85 Fit digital radiography device.
- July 2022: FUJIFILM Healthcare Americas Corporation launches the FDR Cross hybrid c-arm and portable x-ray solution.
Future Outlook for U.S. Digital Radiology Devices Market Market
The U.S. digital radiology devices market is poised for continued growth, driven by technological advancements, increasing healthcare expenditure, and a rising prevalence of chronic diseases. Strategic partnerships, product innovation, and expansion into new markets will be key for market players to capitalize on emerging opportunities. The integration of AI and machine learning will significantly reshape the market, optimizing workflows and improving diagnostic accuracy.
U.S. Digital Radiology Devices Market Segmentation
-
1. Application
- 1.1. Orthopedic
- 1.2. Cancer
- 1.3. Dental
- 1.4. Cardiovascular
- 1.5. Other Applications
-
2. Technology
- 2.1. Computed Radiography
- 2.2. Direct Radiography
-
3. Portability
- 3.1. Fixed Systems
- 3.2. Portable Systems
-
4. End User
- 4.1. Hospitals
- 4.2. Diagnostic Centers
- 4.3. Other End Users
U.S. Digital Radiology Devices Market Segmentation By Geography
- 1. U.S.
U.S. Digital Radiology Devices Market REPORT HIGHLIGHTS
| Aspects | Details |
|---|---|
| Study Period | 2019-2033 |
| Base Year | 2024 |
| Estimated Year | 2025 |
| Forecast Period | 2025-2033 |
| Historical Period | 2019-2024 |
| Growth Rate | CAGR of 7.79% from 2019-2033 |
| Segmentation |
|
Table of Contents
- 1. Introduction
- 1.1. Research Scope
- 1.2. Market Segmentation
- 1.3. Research Methodology
- 1.4. Definitions and Assumptions
- 2. Executive Summary
- 2.1. Introduction
- 3. Market Dynamics
- 3.1. Introduction
- 3.2. Market Drivers
- 3.2.1. Increasing Occurrence Levels of Orthopedic Diseases and Cancers; Increasing Number of Serious Injuries; Technological Advancements and Advantages of Digital X-ray Systems Over Conventional X-rays
- 3.3. Market Restrains
- 3.3.1. High Initial Cost of Installation; New Sales Affected by the Increasing Use of Refurbished Devices
- 3.4. Market Trends
- 3.4.1. The Direct Radiography Segment is Expected to Witness a High CAGR Over the Forecast Period
- 4. Market Factor Analysis
- 4.1. Porters Five Forces
- 4.2. Supply/Value Chain
- 4.3. PESTEL analysis
- 4.4. Market Entropy
- 4.5. Patent/Trademark Analysis
- 5. U.S. Digital Radiology Devices Market Analysis, Insights and Forecast, 2019-2031
- 5.1. Market Analysis, Insights and Forecast - by Application
- 5.1.1. Orthopedic
- 5.1.2. Cancer
- 5.1.3. Dental
- 5.1.4. Cardiovascular
- 5.1.5. Other Applications
- 5.2. Market Analysis, Insights and Forecast - by Technology
- 5.2.1. Computed Radiography
- 5.2.2. Direct Radiography
- 5.3. Market Analysis, Insights and Forecast - by Portability
- 5.3.1. Fixed Systems
- 5.3.2. Portable Systems
- 5.4. Market Analysis, Insights and Forecast - by End User
- 5.4.1. Hospitals
- 5.4.2. Diagnostic Centers
- 5.4.3. Other End Users
- 5.5. Market Analysis, Insights and Forecast - by Region
- 5.5.1. U.S.
- 5.1. Market Analysis, Insights and Forecast - by Application
- 6. Northeast U.S. Digital Radiology Devices Market Analysis, Insights and Forecast, 2019-2031
- 7. Southeast U.S. Digital Radiology Devices Market Analysis, Insights and Forecast, 2019-2031
- 8. Midwest U.S. Digital Radiology Devices Market Analysis, Insights and Forecast, 2019-2031
- 9. Southwest U.S. Digital Radiology Devices Market Analysis, Insights and Forecast, 2019-2031
- 10. West U.S. Digital Radiology Devices Market Analysis, Insights and Forecast, 2019-2031
- 11. Competitive Analysis
- 11.1. Market Share Analysis 2024
- 11.2. Company Profiles
- 11.2.1 Konica Minolta Inc
- 11.2.1.1. Overview
- 11.2.1.2. Products
- 11.2.1.3. SWOT Analysis
- 11.2.1.4. Recent Developments
- 11.2.1.5. Financials (Based on Availability)
- 11.2.2 Varex Imaging Corporation
- 11.2.2.1. Overview
- 11.2.2.2. Products
- 11.2.2.3. SWOT Analysis
- 11.2.2.4. Recent Developments
- 11.2.2.5. Financials (Based on Availability)
- 11.2.3 Toshiba Corporation
- 11.2.3.1. Overview
- 11.2.3.2. Products
- 11.2.3.3. SWOT Analysis
- 11.2.3.4. Recent Developments
- 11.2.3.5. Financials (Based on Availability)
- 11.2.4 Siemens Healthineers
- 11.2.4.1. Overview
- 11.2.4.2. Products
- 11.2.4.3. SWOT Analysis
- 11.2.4.4. Recent Developments
- 11.2.4.5. Financials (Based on Availability)
- 11.2.5 MinXray Inc
- 11.2.5.1. Overview
- 11.2.5.2. Products
- 11.2.5.3. SWOT Analysis
- 11.2.5.4. Recent Developments
- 11.2.5.5. Financials (Based on Availability)
- 11.2.6 Hologic Inc
- 11.2.6.1. Overview
- 11.2.6.2. Products
- 11.2.6.3. SWOT Analysis
- 11.2.6.4. Recent Developments
- 11.2.6.5. Financials (Based on Availability)
- 11.2.7 Hitachi Ltd
- 11.2.7.1. Overview
- 11.2.7.2. Products
- 11.2.7.3. SWOT Analysis
- 11.2.7.4. Recent Developments
- 11.2.7.5. Financials (Based on Availability)
- 11.2.8 Koninklinje Philips NV (Philips Healthcare)
- 11.2.8.1. Overview
- 11.2.8.2. Products
- 11.2.8.3. SWOT Analysis
- 11.2.8.4. Recent Developments
- 11.2.8.5. Financials (Based on Availability)
- 11.2.9 KUB Technologies Inc
- 11.2.9.1. Overview
- 11.2.9.2. Products
- 11.2.9.3. SWOT Analysis
- 11.2.9.4. Recent Developments
- 11.2.9.5. Financials (Based on Availability)
- 11.2.10 Carestream Health
- 11.2.10.1. Overview
- 11.2.10.2. Products
- 11.2.10.3. SWOT Analysis
- 11.2.10.4. Recent Developments
- 11.2.10.5. Financials (Based on Availability)
- 11.2.11 General Electric Company (GE Healthcare)
- 11.2.11.1. Overview
- 11.2.11.2. Products
- 11.2.11.3. SWOT Analysis
- 11.2.11.4. Recent Developments
- 11.2.11.5. Financials (Based on Availability)
- 11.2.12 Canon Medical Systems Corporation
- 11.2.12.1. Overview
- 11.2.12.2. Products
- 11.2.12.3. SWOT Analysis
- 11.2.12.4. Recent Developments
- 11.2.12.5. Financials (Based on Availability)
- 11.2.13 Agfa-Gevaert NV
- 11.2.13.1. Overview
- 11.2.13.2. Products
- 11.2.13.3. SWOT Analysis
- 11.2.13.4. Recent Developments
- 11.2.13.5. Financials (Based on Availability)
- 11.2.14 Shimadzu Corporation
- 11.2.14.1. Overview
- 11.2.14.2. Products
- 11.2.14.3. SWOT Analysis
- 11.2.14.4. Recent Developments
- 11.2.14.5. Financials (Based on Availability)
- 11.2.15 Fujifilm Holdings Corporation
- 11.2.15.1. Overview
- 11.2.15.2. Products
- 11.2.15.3. SWOT Analysis
- 11.2.15.4. Recent Developments
- 11.2.15.5. Financials (Based on Availability)
- 11.2.16 Samsung Electronics Co Ltd (Samsung Medison)
- 11.2.16.1. Overview
- 11.2.16.2. Products
- 11.2.16.3. SWOT Analysis
- 11.2.16.4. Recent Developments
- 11.2.16.5. Financials (Based on Availability)
- 11.2.1 Konica Minolta Inc
List of Figures
- Figure 1: U.S. Digital Radiology Devices Market Revenue Breakdown (Million, %) by Product 2024 & 2032
- Figure 2: U.S. Digital Radiology Devices Market Share (%) by Company 2024
List of Tables
- Table 1: U.S. Digital Radiology Devices Market Revenue Million Forecast, by Region 2019 & 2032
- Table 2: U.S. Digital Radiology Devices Market Volume K Unit Forecast, by Region 2019 & 2032
- Table 3: U.S. Digital Radiology Devices Market Revenue Million Forecast, by Application 2019 & 2032
- Table 4: U.S. Digital Radiology Devices Market Volume K Unit Forecast, by Application 2019 & 2032
- Table 5: U.S. Digital Radiology Devices Market Revenue Million Forecast, by Technology 2019 & 2032
- Table 6: U.S. Digital Radiology Devices Market Volume K Unit Forecast, by Technology 2019 & 2032
- Table 7: U.S. Digital Radiology Devices Market Revenue Million Forecast, by Portability 2019 & 2032
- Table 8: U.S. Digital Radiology Devices Market Volume K Unit Forecast, by Portability 2019 & 2032
- Table 9: U.S. Digital Radiology Devices Market Revenue Million Forecast, by End User 2019 & 2032
- Table 10: U.S. Digital Radiology Devices Market Volume K Unit Forecast, by End User 2019 & 2032
- Table 11: U.S. Digital Radiology Devices Market Revenue Million Forecast, by Region 2019 & 2032
- Table 12: U.S. Digital Radiology Devices Market Volume K Unit Forecast, by Region 2019 & 2032
- Table 13: U.S. Digital Radiology Devices Market Revenue Million Forecast, by Country 2019 & 2032
- Table 14: U.S. Digital Radiology Devices Market Volume K Unit Forecast, by Country 2019 & 2032
- Table 15: Northeast U.S. Digital Radiology Devices Market Revenue (Million) Forecast, by Application 2019 & 2032
- Table 16: Northeast U.S. Digital Radiology Devices Market Volume (K Unit) Forecast, by Application 2019 & 2032
- Table 17: Southeast U.S. Digital Radiology Devices Market Revenue (Million) Forecast, by Application 2019 & 2032
- Table 18: Southeast U.S. Digital Radiology Devices Market Volume (K Unit) Forecast, by Application 2019 & 2032
- Table 19: Midwest U.S. Digital Radiology Devices Market Revenue (Million) Forecast, by Application 2019 & 2032
- Table 20: Midwest U.S. Digital Radiology Devices Market Volume (K Unit) Forecast, by Application 2019 & 2032
- Table 21: Southwest U.S. Digital Radiology Devices Market Revenue (Million) Forecast, by Application 2019 & 2032
- Table 22: Southwest U.S. Digital Radiology Devices Market Volume (K Unit) Forecast, by Application 2019 & 2032
- Table 23: West U.S. Digital Radiology Devices Market Revenue (Million) Forecast, by Application 2019 & 2032
- Table 24: West U.S. Digital Radiology Devices Market Volume (K Unit) Forecast, by Application 2019 & 2032
- Table 25: U.S. Digital Radiology Devices Market Revenue Million Forecast, by Application 2019 & 2032
- Table 26: U.S. Digital Radiology Devices Market Volume K Unit Forecast, by Application 2019 & 2032
- Table 27: U.S. Digital Radiology Devices Market Revenue Million Forecast, by Technology 2019 & 2032
- Table 28: U.S. Digital Radiology Devices Market Volume K Unit Forecast, by Technology 2019 & 2032
- Table 29: U.S. Digital Radiology Devices Market Revenue Million Forecast, by Portability 2019 & 2032
- Table 30: U.S. Digital Radiology Devices Market Volume K Unit Forecast, by Portability 2019 & 2032
- Table 31: U.S. Digital Radiology Devices Market Revenue Million Forecast, by End User 2019 & 2032
- Table 32: U.S. Digital Radiology Devices Market Volume K Unit Forecast, by End User 2019 & 2032
- Table 33: U.S. Digital Radiology Devices Market Revenue Million Forecast, by Country 2019 & 2032
- Table 34: U.S. Digital Radiology Devices Market Volume K Unit Forecast, by Country 2019 & 2032
Frequently Asked Questions
1. What is the projected Compound Annual Growth Rate (CAGR) of the U.S. Digital Radiology Devices Market?
The projected CAGR is approximately 7.79%.
2. Which companies are prominent players in the U.S. Digital Radiology Devices Market?
Key companies in the market include Konica Minolta Inc, Varex Imaging Corporation, Toshiba Corporation, Siemens Healthineers, MinXray Inc, Hologic Inc, Hitachi Ltd, Koninklinje Philips NV (Philips Healthcare), KUB Technologies Inc, Carestream Health, General Electric Company (GE Healthcare), Canon Medical Systems Corporation, Agfa-Gevaert NV, Shimadzu Corporation, Fujifilm Holdings Corporation, Samsung Electronics Co Ltd (Samsung Medison).
3. What are the main segments of the U.S. Digital Radiology Devices Market?
The market segments include Application, Technology, Portability, End User.
4. Can you provide details about the market size?
The market size is estimated to be USD 4.90 Million as of 2022.
5. What are some drivers contributing to market growth?
Increasing Occurrence Levels of Orthopedic Diseases and Cancers; Increasing Number of Serious Injuries; Technological Advancements and Advantages of Digital X-ray Systems Over Conventional X-rays.
6. What are the notable trends driving market growth?
The Direct Radiography Segment is Expected to Witness a High CAGR Over the Forecast Period.
7. Are there any restraints impacting market growth?
High Initial Cost of Installation; New Sales Affected by the Increasing Use of Refurbished Devices.
8. Can you provide examples of recent developments in the market?
In April 2022, Boston Imaging, the United States headquarters of Samsung digital radiography and ultrasound systems, introduces the GM85 Fit, a new configuration of the premium AccE GM85; a digital radiography device featuring a user-centric design that aids in efficient and effective patient care.
9. What pricing options are available for accessing the report?
Pricing options include single-user, multi-user, and enterprise licenses priced at USD 3800, USD 4500, and USD 5800 respectively.
10. Is the market size provided in terms of value or volume?
The market size is provided in terms of value, measured in Million and volume, measured in K Unit.
11. Are there any specific market keywords associated with the report?
Yes, the market keyword associated with the report is "U.S. Digital Radiology Devices Market," which aids in identifying and referencing the specific market segment covered.
12. How do I determine which pricing option suits my needs best?
The pricing options vary based on user requirements and access needs. Individual users may opt for single-user licenses, while businesses requiring broader access may choose multi-user or enterprise licenses for cost-effective access to the report.
13. Are there any additional resources or data provided in the U.S. Digital Radiology Devices Market report?
While the report offers comprehensive insights, it's advisable to review the specific contents or supplementary materials provided to ascertain if additional resources or data are available.
14. How can I stay updated on further developments or reports in the U.S. Digital Radiology Devices Market?
To stay informed about further developments, trends, and reports in the U.S. Digital Radiology Devices Market, consider subscribing to industry newsletters, following relevant companies and organizations, or regularly checking reputable industry news sources and publications.
Methodology
Step 1 - Identification of Relevant Samples Size from Population Database


Step 2 - Approaches for Defining Global Market Size (Value, Volume* & Price*)

Note*: In applicable scenarios
Step 3 - Data Sources
Primary Research
- Web Analytics
- Survey Reports
- Research Institute
- Latest Research Reports
- Opinion Leaders
Secondary Research
- Annual Reports
- White Paper
- Latest Press Release
- Industry Association
- Paid Database
- Investor Presentations

Step 4 - Data Triangulation
Involves using different sources of information in order to increase the validity of a study
These sources are likely to be stakeholders in a program - participants, other researchers, program staff, other community members, and so on.
Then we put all data in single framework & apply various statistical tools to find out the dynamic on the market.
During the analysis stage, feedback from the stakeholder groups would be compared to determine areas of agreement as well as areas of divergence


