
Key Insights
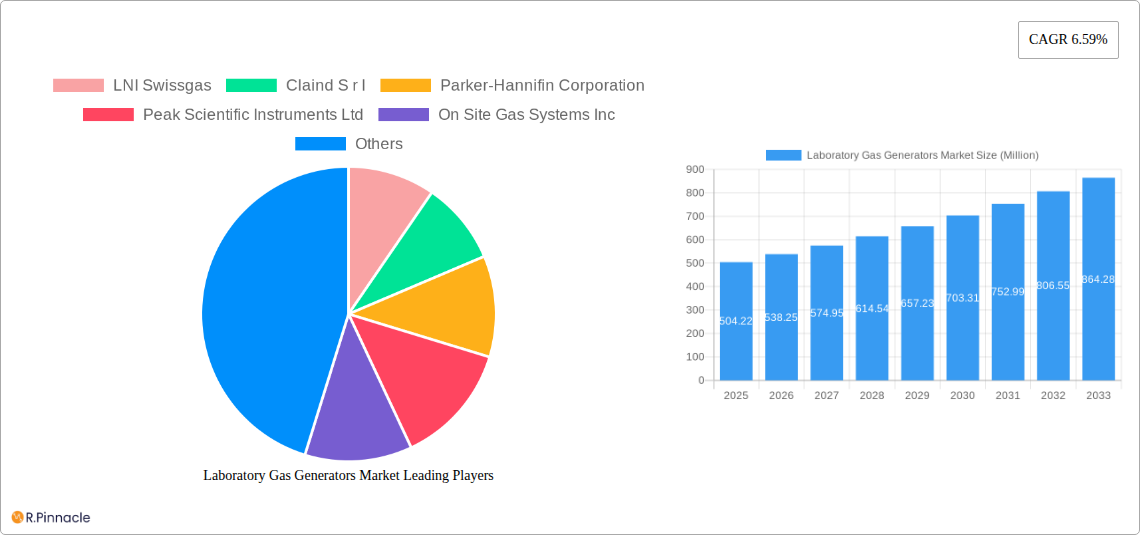
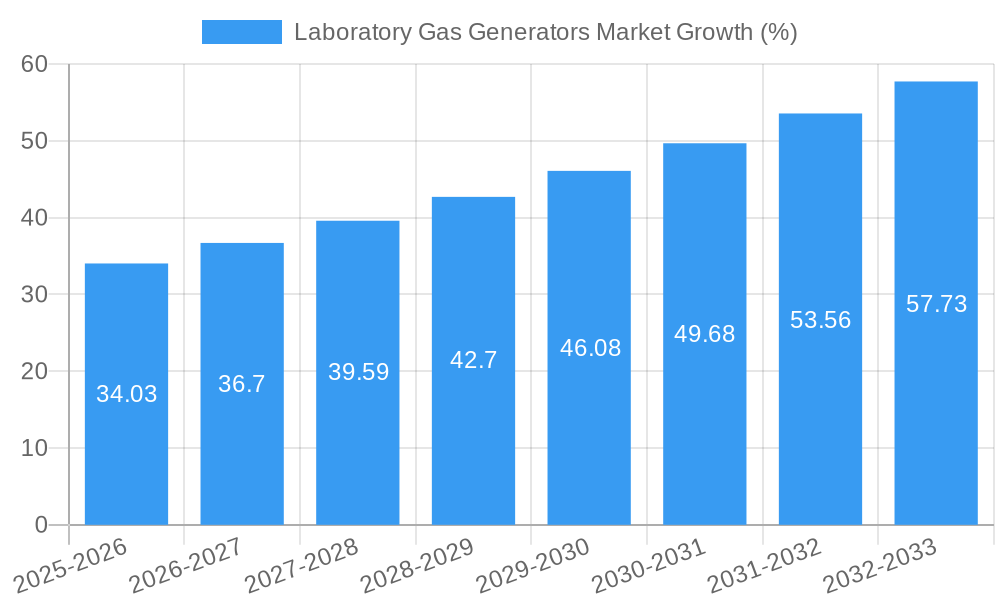
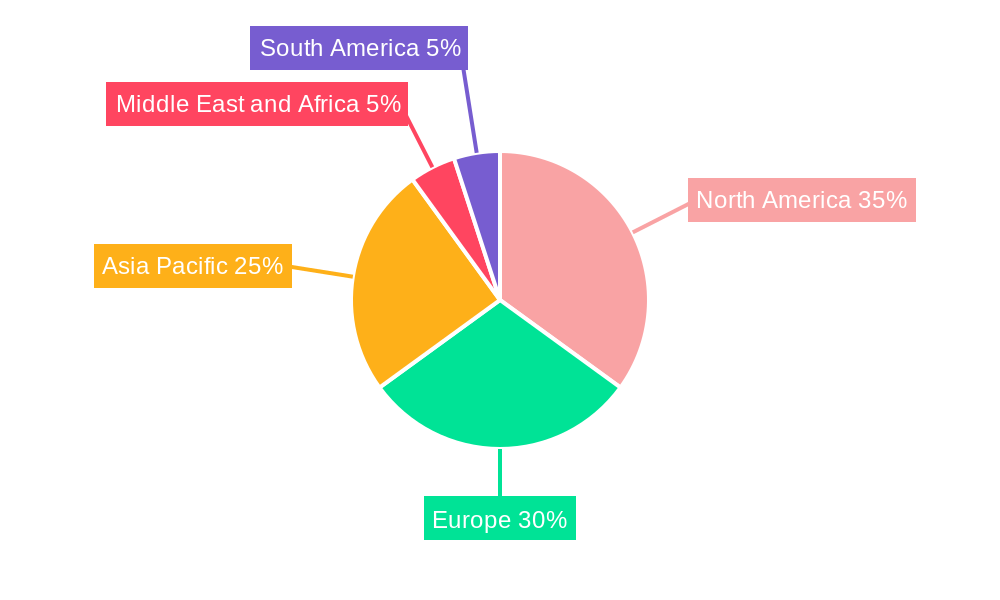
The Laboratory Gas Generators market is experiencing robust growth, projected to reach a market size of $504.22 million in 2025, expanding at a Compound Annual Growth Rate (CAGR) of 6.59% from 2025 to 2033. This growth is fueled by several key factors. The increasing adoption of advanced analytical techniques in research and development across various industries, including pharmaceuticals, biotechnology, and food & beverage, is a primary driver. These industries heavily rely on high-purity gases for sensitive analytical instruments like gas chromatography and mass spectrometry, increasing the demand for on-site gas generation solutions. Furthermore, the rising focus on cost reduction and enhanced operational efficiency within laboratories is pushing the adoption of laboratory gas generators as a cost-effective alternative to traditional gas cylinder supply. Stringent regulatory requirements related to gas handling and safety also contribute to the market's expansion. The segment of Nitrogen Gas Generators holds a significant market share due to its wide applicability across various analytical processes. Geographically, North America and Europe currently dominate the market, owing to the presence of established research infrastructure and a large number of pharmaceutical and biotech companies. However, the Asia-Pacific region is poised for significant growth in the coming years, driven by increasing investments in R&D and expanding healthcare infrastructure in countries like China and India.
The competitive landscape is characterized by the presence of both established players and emerging companies offering a range of gas generator types and solutions. Key players are focusing on product innovation, strategic partnerships, and geographical expansion to enhance their market position. The development of more energy-efficient and compact gas generators, coupled with the integration of advanced monitoring and control systems, are key trends shaping the market. Challenges to the market include the high initial investment costs for sophisticated gas generators and the need for skilled personnel for maintenance and operation. However, the long-term cost benefits and operational advantages associated with on-site generation are expected to offset these challenges, sustaining the market's positive trajectory throughout the forecast period.
Laboratory Gas Generators Market: A Comprehensive Report (2019-2033)
This in-depth report provides a comprehensive analysis of the Laboratory Gas Generators market, offering actionable insights for industry professionals, investors, and strategists. Covering the period 2019-2033, with a base year of 2025 and a forecast period of 2025-2033, this report meticulously examines market dynamics, competitive landscapes, and future growth prospects. The market is valued at xx Million in 2025 and is projected to reach xx Million by 2033, exhibiting a CAGR of xx%.
Laboratory Gas Generators Market Market Structure & Innovation Trends
The Laboratory Gas Generators market exhibits a moderately consolidated structure, with key players such as LNI Swissgas, Claind S r l, Parker-Hannifin Corporation, and Peak Scientific Instruments Ltd holding significant market share. The exact market share distribution is detailed in the full report. Innovation is driven by increasing demand for high-purity gases in advanced analytical techniques, coupled with stringent regulatory frameworks concerning emissions and safety. Product substitutes, primarily compressed gas cylinders, face challenges due to higher costs, logistical complexities, and safety concerns. M&A activity in the sector has been relatively modest in recent years, with deal values averaging xx Million per transaction (data available in the complete report). End-user demographics are shifting towards the pharmaceutical and biotechnological sectors, driven by increasing R&D investments.
Laboratory Gas Generators Market Market Dynamics & Trends
The market is experiencing robust growth fueled by the burgeoning pharmaceutical and biotechnology industries, increasing demand for sophisticated analytical techniques, and advancements in gas generation technologies. Technological disruptions, including the introduction of more efficient and compact generators, are driving market penetration. Consumer preferences are shifting toward generators that offer higher purity, greater reliability, and lower operational costs. The competitive landscape is characterized by intense competition among established players and emerging entrants, leading to continuous product innovations and strategic partnerships. The report analyzes these dynamics in detail and provides a granular breakdown of market segment growth rates and penetration rates within each segment.
Dominant Regions & Segments in Laboratory Gas Generators Market
North America currently holds the largest market share, driven by strong R&D investments in the pharmaceutical and biotech sectors. Within the segment breakdown:
- Type: Nitrogen gas generators maintain the largest share, followed by hydrogen and zero-air generators. Growth is largely driven by increased demand in analytical applications such as chromatography and mass spectrometry.
- End-User: The pharmaceutical and biotechnological sector displays the highest growth rate, driven by rigorous quality control and stringent regulatory requirements. The chemical and petrochemical industries also contribute significantly to the overall market.
Key drivers within each region and segment are detailed in the full report, including economic policies impacting R&D investments, the development of advanced laboratory infrastructure, and the regulatory environment within each region.
Laboratory Gas Generators Market Product Innovations
Recent innovations focus on enhancing gas purity, improving system reliability, and reducing operational costs. Miniaturization and improved efficiency are significant trends. The competitive advantage lies in offering customized solutions, superior after-sales services, and integration capabilities with existing laboratory equipment. The development of smart generators with remote monitoring and diagnostics capabilities is another key area of innovation.
Report Scope & Segmentation Analysis
This report segments the market by both type of gas generator and end-user industry.
- Type: Nitrogen Gas Generators, Hydrogen Gas Generators, Zero Air Generators, TOC Gas Generators, Other Gas Generators. Each segment's growth projections, market size, and competitive dynamics are analyzed individually.
- End-User: Food and Beverage Companies, Chemical and Petrochemical Companies, Pharmaceutical and Biotechnological Companies. Detailed analysis of each end-user segment is provided, highlighting their specific needs and growth potential.
Key Drivers of Laboratory Gas Generators Market Growth
The market's expansion is primarily driven by increasing R&D spending in various industries, particularly in pharmaceuticals and biotechnology. Stringent regulations concerning gas purity and safety also contribute to the growth. Technological advancements, such as the introduction of more efficient and cost-effective generators, are significant accelerators. Moreover, the growing preference for on-site gas generation over traditional gas cylinders due to cost savings and convenience further fuels market growth.
Challenges in the Laboratory Gas Generators Market Sector
The market faces challenges such as the high initial investment costs associated with purchasing advanced gas generators, particularly for smaller laboratories. Supply chain disruptions and the availability of raw materials can impact production and pricing. Furthermore, intense competition among established and emerging players creates price pressures and necessitates continuous product innovation.
Emerging Opportunities in Laboratory Gas Generators Market
Emerging markets in developing economies present significant growth opportunities. The integration of advanced analytics and AI for predictive maintenance and optimization is a key trend. The development of sustainable and environmentally friendly gas generation technologies presents further opportunities. Finally, expanding into niche applications, like portable and specialized generators, offers significant potential.
Leading Players in the Laboratory Gas Generators Market Market
- LNI Swissgas
- Claind S r l
- Parker-Hannifin Corporation
- Peak Scientific Instruments Ltd
- On Site Gas Systems Inc
- Oxymat A/S
- Isolcell S p A
- ErreDue spa
- Linde Plc (Praxair Technology Inc )
- F-Dgsi
- Valco Instruments Company Inc (VICI DBS SRL)
- Labtech S R L
- Nel ASA
Key Developments in Laboratory Gas Generators Market Industry
- June 2022: LNI launched its new product, the HG MINI hydrogen generator, featuring an innovative static drying system for enhanced purity.
- March 2022: PEAK Scientific expanded its Glasgow manufacturing facility, increasing production capacity and supporting increased demand.
Future Outlook for Laboratory Gas Generators Market Market
The Laboratory Gas Generators market is poised for continued growth, driven by ongoing technological advancements, increasing demand from key end-user sectors, and expansion into emerging markets. Strategic partnerships, product diversification, and a focus on sustainability will be crucial for success in this dynamic market. The full report provides detailed forecasts and strategic recommendations to capitalize on future opportunities.
Laboratory Gas Generators Market Segmentation
-
1. Type
- 1.1. Nitrogen Gas Generators
- 1.2. Hydrogen Gas Generators
- 1.3. Zero Air Generators
- 1.4. TOC Gas Generators
- 1.5. Other Gas Generators
-
2. End User
- 2.1. Food and Beverage Companies
- 2.2. Chemical and Petrochemical Companies
- 2.3. Pharmaceutical and Biotechnological Companies
Laboratory Gas Generators Market Segmentation By Geography
-
1. North America
- 1.1. United States
- 1.2. Canada
- 1.3. Mexico
-
2. Europe
- 2.1. Germany
- 2.2. United Kingdom
- 2.3. France
- 2.4. Italy
- 2.5. Spain
- 2.6. Rest of Europe
-
3. Asia Pacific
- 3.1. China
- 3.2. Japan
- 3.3. India
- 3.4. Australia
- 3.5. South Korea
- 3.6. Rest of Asia Pacific
-
4. Middle East and Africa
- 4.1. GCC
- 4.2. South Africa
- 4.3. Rest of Middle East and Africa
-
5. South America
- 5.1. Brazil
- 5.2. Argentina
- 5.3. Rest of South America
Laboratory Gas Generators Market REPORT HIGHLIGHTS
| Aspects | Details |
|---|---|
| Study Period | 2019-2033 |
| Base Year | 2024 |
| Estimated Year | 2025 |
| Forecast Period | 2025-2033 |
| Historical Period | 2019-2024 |
| Growth Rate | CAGR of 6.59% from 2019-2033 |
| Segmentation |
|
Table of Contents
- 1. Introduction
- 1.1. Research Scope
- 1.2. Market Segmentation
- 1.3. Research Methodology
- 1.4. Definitions and Assumptions
- 2. Executive Summary
- 2.1. Introduction
- 3. Market Dynamics
- 3.1. Introduction
- 3.2. Market Drivers
- 3.2.1. Rising Safety Concerns Related to the Use of Conventional Gas Cylinders; Growing Importance of Analytical Techniques in Drug and Food Approval Processes; Increasing R&D Spending in Target Industries
- 3.3. Market Restrains
- 3.3.1. Reluctance to Replace Conventional Gas Supply Methods; Lack of Skilled Personnel
- 3.4. Market Trends
- 3.4.1. Nitrogen Gas Generators is Expected to Hold Significant Share in the Market Over the Forecast Period
- 4. Market Factor Analysis
- 4.1. Porters Five Forces
- 4.2. Supply/Value Chain
- 4.3. PESTEL analysis
- 4.4. Market Entropy
- 4.5. Patent/Trademark Analysis
- 5. Global Laboratory Gas Generators Market Analysis, Insights and Forecast, 2019-2031
- 5.1. Market Analysis, Insights and Forecast - by Type
- 5.1.1. Nitrogen Gas Generators
- 5.1.2. Hydrogen Gas Generators
- 5.1.3. Zero Air Generators
- 5.1.4. TOC Gas Generators
- 5.1.5. Other Gas Generators
- 5.2. Market Analysis, Insights and Forecast - by End User
- 5.2.1. Food and Beverage Companies
- 5.2.2. Chemical and Petrochemical Companies
- 5.2.3. Pharmaceutical and Biotechnological Companies
- 5.3. Market Analysis, Insights and Forecast - by Region
- 5.3.1. North America
- 5.3.2. Europe
- 5.3.3. Asia Pacific
- 5.3.4. Middle East and Africa
- 5.3.5. South America
- 5.1. Market Analysis, Insights and Forecast - by Type
- 6. North America Laboratory Gas Generators Market Analysis, Insights and Forecast, 2019-2031
- 6.1. Market Analysis, Insights and Forecast - by Type
- 6.1.1. Nitrogen Gas Generators
- 6.1.2. Hydrogen Gas Generators
- 6.1.3. Zero Air Generators
- 6.1.4. TOC Gas Generators
- 6.1.5. Other Gas Generators
- 6.2. Market Analysis, Insights and Forecast - by End User
- 6.2.1. Food and Beverage Companies
- 6.2.2. Chemical and Petrochemical Companies
- 6.2.3. Pharmaceutical and Biotechnological Companies
- 6.1. Market Analysis, Insights and Forecast - by Type
- 7. Europe Laboratory Gas Generators Market Analysis, Insights and Forecast, 2019-2031
- 7.1. Market Analysis, Insights and Forecast - by Type
- 7.1.1. Nitrogen Gas Generators
- 7.1.2. Hydrogen Gas Generators
- 7.1.3. Zero Air Generators
- 7.1.4. TOC Gas Generators
- 7.1.5. Other Gas Generators
- 7.2. Market Analysis, Insights and Forecast - by End User
- 7.2.1. Food and Beverage Companies
- 7.2.2. Chemical and Petrochemical Companies
- 7.2.3. Pharmaceutical and Biotechnological Companies
- 7.1. Market Analysis, Insights and Forecast - by Type
- 8. Asia Pacific Laboratory Gas Generators Market Analysis, Insights and Forecast, 2019-2031
- 8.1. Market Analysis, Insights and Forecast - by Type
- 8.1.1. Nitrogen Gas Generators
- 8.1.2. Hydrogen Gas Generators
- 8.1.3. Zero Air Generators
- 8.1.4. TOC Gas Generators
- 8.1.5. Other Gas Generators
- 8.2. Market Analysis, Insights and Forecast - by End User
- 8.2.1. Food and Beverage Companies
- 8.2.2. Chemical and Petrochemical Companies
- 8.2.3. Pharmaceutical and Biotechnological Companies
- 8.1. Market Analysis, Insights and Forecast - by Type
- 9. Middle East and Africa Laboratory Gas Generators Market Analysis, Insights and Forecast, 2019-2031
- 9.1. Market Analysis, Insights and Forecast - by Type
- 9.1.1. Nitrogen Gas Generators
- 9.1.2. Hydrogen Gas Generators
- 9.1.3. Zero Air Generators
- 9.1.4. TOC Gas Generators
- 9.1.5. Other Gas Generators
- 9.2. Market Analysis, Insights and Forecast - by End User
- 9.2.1. Food and Beverage Companies
- 9.2.2. Chemical and Petrochemical Companies
- 9.2.3. Pharmaceutical and Biotechnological Companies
- 9.1. Market Analysis, Insights and Forecast - by Type
- 10. South America Laboratory Gas Generators Market Analysis, Insights and Forecast, 2019-2031
- 10.1. Market Analysis, Insights and Forecast - by Type
- 10.1.1. Nitrogen Gas Generators
- 10.1.2. Hydrogen Gas Generators
- 10.1.3. Zero Air Generators
- 10.1.4. TOC Gas Generators
- 10.1.5. Other Gas Generators
- 10.2. Market Analysis, Insights and Forecast - by End User
- 10.2.1. Food and Beverage Companies
- 10.2.2. Chemical and Petrochemical Companies
- 10.2.3. Pharmaceutical and Biotechnological Companies
- 10.1. Market Analysis, Insights and Forecast - by Type
- 11. North America Laboratory Gas Generators Market Analysis, Insights and Forecast, 2019-2031
- 11.1. Market Analysis, Insights and Forecast - By Country/Sub-region
- 11.1.1 United States
- 11.1.2 Canada
- 11.1.3 Mexico
- 12. Europe Laboratory Gas Generators Market Analysis, Insights and Forecast, 2019-2031
- 12.1. Market Analysis, Insights and Forecast - By Country/Sub-region
- 12.1.1 Germany
- 12.1.2 United Kingdom
- 12.1.3 France
- 12.1.4 Italy
- 12.1.5 Spain
- 12.1.6 Rest of Europe
- 13. Asia Pacific Laboratory Gas Generators Market Analysis, Insights and Forecast, 2019-2031
- 13.1. Market Analysis, Insights and Forecast - By Country/Sub-region
- 13.1.1 China
- 13.1.2 Japan
- 13.1.3 India
- 13.1.4 Australia
- 13.1.5 South Korea
- 13.1.6 Rest of Asia Pacific
- 14. Middle East and Africa Laboratory Gas Generators Market Analysis, Insights and Forecast, 2019-2031
- 14.1. Market Analysis, Insights and Forecast - By Country/Sub-region
- 14.1.1 GCC
- 14.1.2 South Africa
- 14.1.3 Rest of Middle East and Africa
- 15. South America Laboratory Gas Generators Market Analysis, Insights and Forecast, 2019-2031
- 15.1. Market Analysis, Insights and Forecast - By Country/Sub-region
- 15.1.1 Brazil
- 15.1.2 Argentina
- 15.1.3 Rest of South America
- 16. Competitive Analysis
- 16.1. Global Market Share Analysis 2024
- 16.2. Company Profiles
- 16.2.1 LNI Swissgas
- 16.2.1.1. Overview
- 16.2.1.2. Products
- 16.2.1.3. SWOT Analysis
- 16.2.1.4. Recent Developments
- 16.2.1.5. Financials (Based on Availability)
- 16.2.2 Claind S r l
- 16.2.2.1. Overview
- 16.2.2.2. Products
- 16.2.2.3. SWOT Analysis
- 16.2.2.4. Recent Developments
- 16.2.2.5. Financials (Based on Availability)
- 16.2.3 Parker-Hannifin Corporation
- 16.2.3.1. Overview
- 16.2.3.2. Products
- 16.2.3.3. SWOT Analysis
- 16.2.3.4. Recent Developments
- 16.2.3.5. Financials (Based on Availability)
- 16.2.4 Peak Scientific Instruments Ltd
- 16.2.4.1. Overview
- 16.2.4.2. Products
- 16.2.4.3. SWOT Analysis
- 16.2.4.4. Recent Developments
- 16.2.4.5. Financials (Based on Availability)
- 16.2.5 On Site Gas Systems Inc
- 16.2.5.1. Overview
- 16.2.5.2. Products
- 16.2.5.3. SWOT Analysis
- 16.2.5.4. Recent Developments
- 16.2.5.5. Financials (Based on Availability)
- 16.2.6 Oxymat A/S*List Not Exhaustive
- 16.2.6.1. Overview
- 16.2.6.2. Products
- 16.2.6.3. SWOT Analysis
- 16.2.6.4. Recent Developments
- 16.2.6.5. Financials (Based on Availability)
- 16.2.7 Isolcell S p A
- 16.2.7.1. Overview
- 16.2.7.2. Products
- 16.2.7.3. SWOT Analysis
- 16.2.7.4. Recent Developments
- 16.2.7.5. Financials (Based on Availability)
- 16.2.8 ErreDue spa
- 16.2.8.1. Overview
- 16.2.8.2. Products
- 16.2.8.3. SWOT Analysis
- 16.2.8.4. Recent Developments
- 16.2.8.5. Financials (Based on Availability)
- 16.2.9 Linde Plc (Praxair Technology Inc )
- 16.2.9.1. Overview
- 16.2.9.2. Products
- 16.2.9.3. SWOT Analysis
- 16.2.9.4. Recent Developments
- 16.2.9.5. Financials (Based on Availability)
- 16.2.10 F-Dgsi
- 16.2.10.1. Overview
- 16.2.10.2. Products
- 16.2.10.3. SWOT Analysis
- 16.2.10.4. Recent Developments
- 16.2.10.5. Financials (Based on Availability)
- 16.2.11 Valco InstrumenValco Instruments Company Inc (VICI DBS SRL)
- 16.2.11.1. Overview
- 16.2.11.2. Products
- 16.2.11.3. SWOT Analysis
- 16.2.11.4. Recent Developments
- 16.2.11.5. Financials (Based on Availability)
- 16.2.12 Labtech S R L
- 16.2.12.1. Overview
- 16.2.12.2. Products
- 16.2.12.3. SWOT Analysis
- 16.2.12.4. Recent Developments
- 16.2.12.5. Financials (Based on Availability)
- 16.2.13 Nel ASA
- 16.2.13.1. Overview
- 16.2.13.2. Products
- 16.2.13.3. SWOT Analysis
- 16.2.13.4. Recent Developments
- 16.2.13.5. Financials (Based on Availability)
- 16.2.1 LNI Swissgas
List of Figures
- Figure 1: Global Laboratory Gas Generators Market Revenue Breakdown (Million, %) by Region 2024 & 2032
- Figure 2: North America Laboratory Gas Generators Market Revenue (Million), by Country 2024 & 2032
- Figure 3: North America Laboratory Gas Generators Market Revenue Share (%), by Country 2024 & 2032
- Figure 4: Europe Laboratory Gas Generators Market Revenue (Million), by Country 2024 & 2032
- Figure 5: Europe Laboratory Gas Generators Market Revenue Share (%), by Country 2024 & 2032
- Figure 6: Asia Pacific Laboratory Gas Generators Market Revenue (Million), by Country 2024 & 2032
- Figure 7: Asia Pacific Laboratory Gas Generators Market Revenue Share (%), by Country 2024 & 2032
- Figure 8: Middle East and Africa Laboratory Gas Generators Market Revenue (Million), by Country 2024 & 2032
- Figure 9: Middle East and Africa Laboratory Gas Generators Market Revenue Share (%), by Country 2024 & 2032
- Figure 10: South America Laboratory Gas Generators Market Revenue (Million), by Country 2024 & 2032
- Figure 11: South America Laboratory Gas Generators Market Revenue Share (%), by Country 2024 & 2032
- Figure 12: North America Laboratory Gas Generators Market Revenue (Million), by Type 2024 & 2032
- Figure 13: North America Laboratory Gas Generators Market Revenue Share (%), by Type 2024 & 2032
- Figure 14: North America Laboratory Gas Generators Market Revenue (Million), by End User 2024 & 2032
- Figure 15: North America Laboratory Gas Generators Market Revenue Share (%), by End User 2024 & 2032
- Figure 16: North America Laboratory Gas Generators Market Revenue (Million), by Country 2024 & 2032
- Figure 17: North America Laboratory Gas Generators Market Revenue Share (%), by Country 2024 & 2032
- Figure 18: Europe Laboratory Gas Generators Market Revenue (Million), by Type 2024 & 2032
- Figure 19: Europe Laboratory Gas Generators Market Revenue Share (%), by Type 2024 & 2032
- Figure 20: Europe Laboratory Gas Generators Market Revenue (Million), by End User 2024 & 2032
- Figure 21: Europe Laboratory Gas Generators Market Revenue Share (%), by End User 2024 & 2032
- Figure 22: Europe Laboratory Gas Generators Market Revenue (Million), by Country 2024 & 2032
- Figure 23: Europe Laboratory Gas Generators Market Revenue Share (%), by Country 2024 & 2032
- Figure 24: Asia Pacific Laboratory Gas Generators Market Revenue (Million), by Type 2024 & 2032
- Figure 25: Asia Pacific Laboratory Gas Generators Market Revenue Share (%), by Type 2024 & 2032
- Figure 26: Asia Pacific Laboratory Gas Generators Market Revenue (Million), by End User 2024 & 2032
- Figure 27: Asia Pacific Laboratory Gas Generators Market Revenue Share (%), by End User 2024 & 2032
- Figure 28: Asia Pacific Laboratory Gas Generators Market Revenue (Million), by Country 2024 & 2032
- Figure 29: Asia Pacific Laboratory Gas Generators Market Revenue Share (%), by Country 2024 & 2032
- Figure 30: Middle East and Africa Laboratory Gas Generators Market Revenue (Million), by Type 2024 & 2032
- Figure 31: Middle East and Africa Laboratory Gas Generators Market Revenue Share (%), by Type 2024 & 2032
- Figure 32: Middle East and Africa Laboratory Gas Generators Market Revenue (Million), by End User 2024 & 2032
- Figure 33: Middle East and Africa Laboratory Gas Generators Market Revenue Share (%), by End User 2024 & 2032
- Figure 34: Middle East and Africa Laboratory Gas Generators Market Revenue (Million), by Country 2024 & 2032
- Figure 35: Middle East and Africa Laboratory Gas Generators Market Revenue Share (%), by Country 2024 & 2032
- Figure 36: South America Laboratory Gas Generators Market Revenue (Million), by Type 2024 & 2032
- Figure 37: South America Laboratory Gas Generators Market Revenue Share (%), by Type 2024 & 2032
- Figure 38: South America Laboratory Gas Generators Market Revenue (Million), by End User 2024 & 2032
- Figure 39: South America Laboratory Gas Generators Market Revenue Share (%), by End User 2024 & 2032
- Figure 40: South America Laboratory Gas Generators Market Revenue (Million), by Country 2024 & 2032
- Figure 41: South America Laboratory Gas Generators Market Revenue Share (%), by Country 2024 & 2032
List of Tables
- Table 1: Global Laboratory Gas Generators Market Revenue Million Forecast, by Region 2019 & 2032
- Table 2: Global Laboratory Gas Generators Market Revenue Million Forecast, by Type 2019 & 2032
- Table 3: Global Laboratory Gas Generators Market Revenue Million Forecast, by End User 2019 & 2032
- Table 4: Global Laboratory Gas Generators Market Revenue Million Forecast, by Region 2019 & 2032
- Table 5: Global Laboratory Gas Generators Market Revenue Million Forecast, by Country 2019 & 2032
- Table 6: United States Laboratory Gas Generators Market Revenue (Million) Forecast, by Application 2019 & 2032
- Table 7: Canada Laboratory Gas Generators Market Revenue (Million) Forecast, by Application 2019 & 2032
- Table 8: Mexico Laboratory Gas Generators Market Revenue (Million) Forecast, by Application 2019 & 2032
- Table 9: Global Laboratory Gas Generators Market Revenue Million Forecast, by Country 2019 & 2032
- Table 10: Germany Laboratory Gas Generators Market Revenue (Million) Forecast, by Application 2019 & 2032
- Table 11: United Kingdom Laboratory Gas Generators Market Revenue (Million) Forecast, by Application 2019 & 2032
- Table 12: France Laboratory Gas Generators Market Revenue (Million) Forecast, by Application 2019 & 2032
- Table 13: Italy Laboratory Gas Generators Market Revenue (Million) Forecast, by Application 2019 & 2032
- Table 14: Spain Laboratory Gas Generators Market Revenue (Million) Forecast, by Application 2019 & 2032
- Table 15: Rest of Europe Laboratory Gas Generators Market Revenue (Million) Forecast, by Application 2019 & 2032
- Table 16: Global Laboratory Gas Generators Market Revenue Million Forecast, by Country 2019 & 2032
- Table 17: China Laboratory Gas Generators Market Revenue (Million) Forecast, by Application 2019 & 2032
- Table 18: Japan Laboratory Gas Generators Market Revenue (Million) Forecast, by Application 2019 & 2032
- Table 19: India Laboratory Gas Generators Market Revenue (Million) Forecast, by Application 2019 & 2032
- Table 20: Australia Laboratory Gas Generators Market Revenue (Million) Forecast, by Application 2019 & 2032
- Table 21: South Korea Laboratory Gas Generators Market Revenue (Million) Forecast, by Application 2019 & 2032
- Table 22: Rest of Asia Pacific Laboratory Gas Generators Market Revenue (Million) Forecast, by Application 2019 & 2032
- Table 23: Global Laboratory Gas Generators Market Revenue Million Forecast, by Country 2019 & 2032
- Table 24: GCC Laboratory Gas Generators Market Revenue (Million) Forecast, by Application 2019 & 2032
- Table 25: South Africa Laboratory Gas Generators Market Revenue (Million) Forecast, by Application 2019 & 2032
- Table 26: Rest of Middle East and Africa Laboratory Gas Generators Market Revenue (Million) Forecast, by Application 2019 & 2032
- Table 27: Global Laboratory Gas Generators Market Revenue Million Forecast, by Country 2019 & 2032
- Table 28: Brazil Laboratory Gas Generators Market Revenue (Million) Forecast, by Application 2019 & 2032
- Table 29: Argentina Laboratory Gas Generators Market Revenue (Million) Forecast, by Application 2019 & 2032
- Table 30: Rest of South America Laboratory Gas Generators Market Revenue (Million) Forecast, by Application 2019 & 2032
- Table 31: Global Laboratory Gas Generators Market Revenue Million Forecast, by Type 2019 & 2032
- Table 32: Global Laboratory Gas Generators Market Revenue Million Forecast, by End User 2019 & 2032
- Table 33: Global Laboratory Gas Generators Market Revenue Million Forecast, by Country 2019 & 2032
- Table 34: United States Laboratory Gas Generators Market Revenue (Million) Forecast, by Application 2019 & 2032
- Table 35: Canada Laboratory Gas Generators Market Revenue (Million) Forecast, by Application 2019 & 2032
- Table 36: Mexico Laboratory Gas Generators Market Revenue (Million) Forecast, by Application 2019 & 2032
- Table 37: Global Laboratory Gas Generators Market Revenue Million Forecast, by Type 2019 & 2032
- Table 38: Global Laboratory Gas Generators Market Revenue Million Forecast, by End User 2019 & 2032
- Table 39: Global Laboratory Gas Generators Market Revenue Million Forecast, by Country 2019 & 2032
- Table 40: Germany Laboratory Gas Generators Market Revenue (Million) Forecast, by Application 2019 & 2032
- Table 41: United Kingdom Laboratory Gas Generators Market Revenue (Million) Forecast, by Application 2019 & 2032
- Table 42: France Laboratory Gas Generators Market Revenue (Million) Forecast, by Application 2019 & 2032
- Table 43: Italy Laboratory Gas Generators Market Revenue (Million) Forecast, by Application 2019 & 2032
- Table 44: Spain Laboratory Gas Generators Market Revenue (Million) Forecast, by Application 2019 & 2032
- Table 45: Rest of Europe Laboratory Gas Generators Market Revenue (Million) Forecast, by Application 2019 & 2032
- Table 46: Global Laboratory Gas Generators Market Revenue Million Forecast, by Type 2019 & 2032
- Table 47: Global Laboratory Gas Generators Market Revenue Million Forecast, by End User 2019 & 2032
- Table 48: Global Laboratory Gas Generators Market Revenue Million Forecast, by Country 2019 & 2032
- Table 49: China Laboratory Gas Generators Market Revenue (Million) Forecast, by Application 2019 & 2032
- Table 50: Japan Laboratory Gas Generators Market Revenue (Million) Forecast, by Application 2019 & 2032
- Table 51: India Laboratory Gas Generators Market Revenue (Million) Forecast, by Application 2019 & 2032
- Table 52: Australia Laboratory Gas Generators Market Revenue (Million) Forecast, by Application 2019 & 2032
- Table 53: South Korea Laboratory Gas Generators Market Revenue (Million) Forecast, by Application 2019 & 2032
- Table 54: Rest of Asia Pacific Laboratory Gas Generators Market Revenue (Million) Forecast, by Application 2019 & 2032
- Table 55: Global Laboratory Gas Generators Market Revenue Million Forecast, by Type 2019 & 2032
- Table 56: Global Laboratory Gas Generators Market Revenue Million Forecast, by End User 2019 & 2032
- Table 57: Global Laboratory Gas Generators Market Revenue Million Forecast, by Country 2019 & 2032
- Table 58: GCC Laboratory Gas Generators Market Revenue (Million) Forecast, by Application 2019 & 2032
- Table 59: South Africa Laboratory Gas Generators Market Revenue (Million) Forecast, by Application 2019 & 2032
- Table 60: Rest of Middle East and Africa Laboratory Gas Generators Market Revenue (Million) Forecast, by Application 2019 & 2032
- Table 61: Global Laboratory Gas Generators Market Revenue Million Forecast, by Type 2019 & 2032
- Table 62: Global Laboratory Gas Generators Market Revenue Million Forecast, by End User 2019 & 2032
- Table 63: Global Laboratory Gas Generators Market Revenue Million Forecast, by Country 2019 & 2032
- Table 64: Brazil Laboratory Gas Generators Market Revenue (Million) Forecast, by Application 2019 & 2032
- Table 65: Argentina Laboratory Gas Generators Market Revenue (Million) Forecast, by Application 2019 & 2032
- Table 66: Rest of South America Laboratory Gas Generators Market Revenue (Million) Forecast, by Application 2019 & 2032
Frequently Asked Questions
1. What is the projected Compound Annual Growth Rate (CAGR) of the Laboratory Gas Generators Market?
The projected CAGR is approximately 6.59%.
2. Which companies are prominent players in the Laboratory Gas Generators Market?
Key companies in the market include LNI Swissgas, Claind S r l, Parker-Hannifin Corporation, Peak Scientific Instruments Ltd, On Site Gas Systems Inc, Oxymat A/S*List Not Exhaustive, Isolcell S p A, ErreDue spa, Linde Plc (Praxair Technology Inc ), F-Dgsi, Valco InstrumenValco Instruments Company Inc (VICI DBS SRL), Labtech S R L, Nel ASA.
3. What are the main segments of the Laboratory Gas Generators Market?
The market segments include Type, End User.
4. Can you provide details about the market size?
The market size is estimated to be USD 504.22 Million as of 2022.
5. What are some drivers contributing to market growth?
Rising Safety Concerns Related to the Use of Conventional Gas Cylinders; Growing Importance of Analytical Techniques in Drug and Food Approval Processes; Increasing R&D Spending in Target Industries.
6. What are the notable trends driving market growth?
Nitrogen Gas Generators is Expected to Hold Significant Share in the Market Over the Forecast Period.
7. Are there any restraints impacting market growth?
Reluctance to Replace Conventional Gas Supply Methods; Lack of Skilled Personnel.
8. Can you provide examples of recent developments in the market?
June 2022- LNI launched its new product, the HG MINI hydrogen generator. It has an innovative static drying system that ensures the maximum grade of hydrogen purity and protects the GC with its humidity safeguard.
9. What pricing options are available for accessing the report?
Pricing options include single-user, multi-user, and enterprise licenses priced at USD 4750, USD 5250, and USD 8750 respectively.
10. Is the market size provided in terms of value or volume?
The market size is provided in terms of value, measured in Million.
11. Are there any specific market keywords associated with the report?
Yes, the market keyword associated with the report is "Laboratory Gas Generators Market," which aids in identifying and referencing the specific market segment covered.
12. How do I determine which pricing option suits my needs best?
The pricing options vary based on user requirements and access needs. Individual users may opt for single-user licenses, while businesses requiring broader access may choose multi-user or enterprise licenses for cost-effective access to the report.
13. Are there any additional resources or data provided in the Laboratory Gas Generators Market report?
While the report offers comprehensive insights, it's advisable to review the specific contents or supplementary materials provided to ascertain if additional resources or data are available.
14. How can I stay updated on further developments or reports in the Laboratory Gas Generators Market?
To stay informed about further developments, trends, and reports in the Laboratory Gas Generators Market, consider subscribing to industry newsletters, following relevant companies and organizations, or regularly checking reputable industry news sources and publications.
Methodology
Step 1 - Identification of Relevant Samples Size from Population Database


Step 2 - Approaches for Defining Global Market Size (Value, Volume* & Price*)

Note*: In applicable scenarios
Step 3 - Data Sources
Primary Research
- Web Analytics
- Survey Reports
- Research Institute
- Latest Research Reports
- Opinion Leaders
Secondary Research
- Annual Reports
- White Paper
- Latest Press Release
- Industry Association
- Paid Database
- Investor Presentations

Step 4 - Data Triangulation
Involves using different sources of information in order to increase the validity of a study
These sources are likely to be stakeholders in a program - participants, other researchers, program staff, other community members, and so on.
Then we put all data in single framework & apply various statistical tools to find out the dynamic on the market.
During the analysis stage, feedback from the stakeholder groups would be compared to determine areas of agreement as well as areas of divergence


