
Key Insights
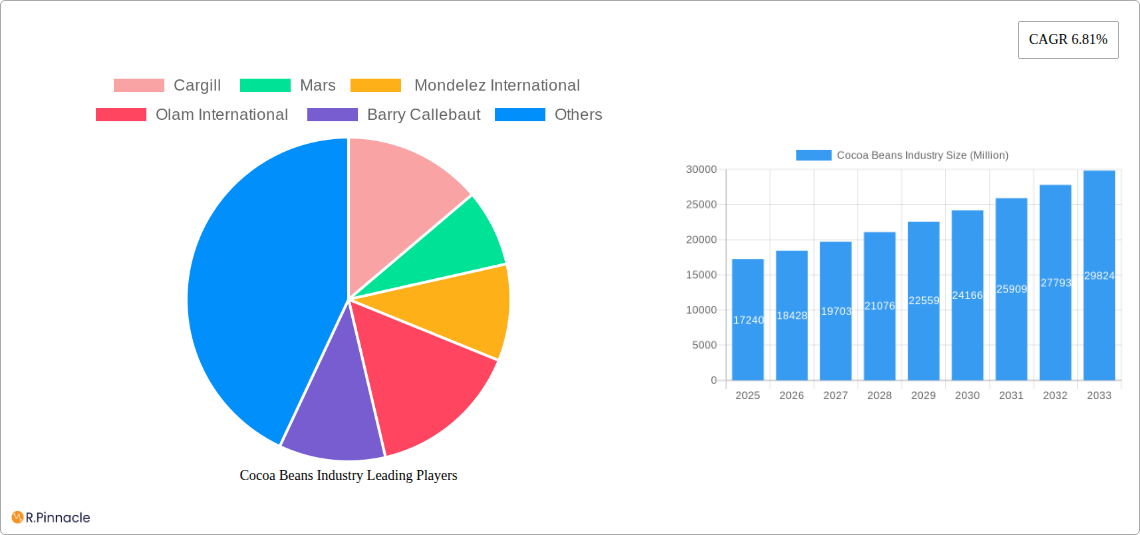
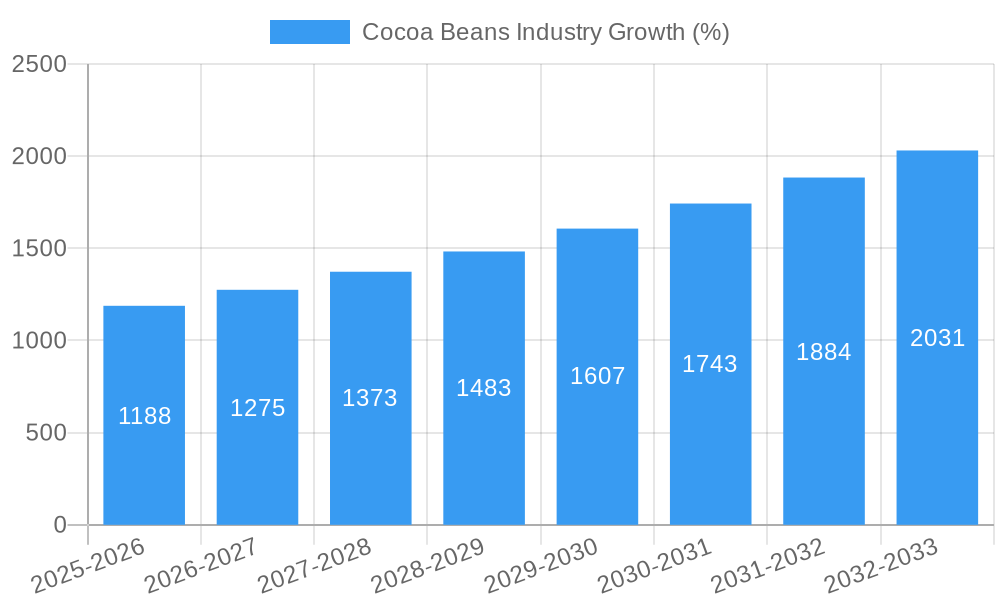
The global cocoa beans market, valued at $17.24 billion in 2025, is projected to experience robust growth, driven by increasing consumer demand for chocolate and cocoa-based products across diverse food and beverage categories. The market's Compound Annual Growth Rate (CAGR) of 6.81% from 2025 to 2033 indicates a significant expansion opportunity. Key drivers include rising disposable incomes in developing economies, leading to increased consumption of confectionery and cocoa-infused beverages. Furthermore, the growing popularity of premium chocolate and innovative product formulations, such as cocoa-infused health and wellness products, fuels market expansion. The confectionery segment remains the dominant end-user industry, followed by beverages and bakery products. The market is witnessing a shift towards sustainable and ethically sourced cocoa beans, influencing consumer purchasing decisions and prompting manufacturers to adopt responsible sourcing practices. Growth in online retail channels complements the traditional supermarket and specialty store sales channels, enhancing market accessibility. While challenges such as fluctuating cocoa bean prices and climate change impacts on cocoa production exist, the overall market outlook remains positive, with opportunities for growth in emerging markets and through product diversification.
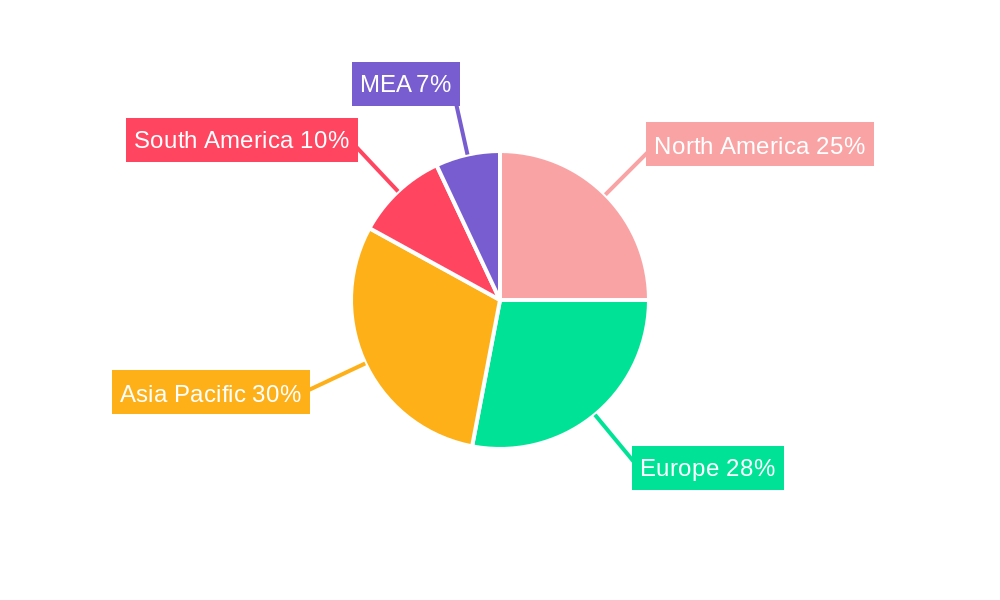
Major players like Cargill, Mars, Mondelez International, Olam International, and Barry Callebaut are strategically positioned to capitalize on these trends. Their significant market share reflects their strong brand recognition, established distribution networks, and investments in research and development. Regional variations in market growth are anticipated, with regions such as Asia Pacific and South America expected to show robust growth due to burgeoning populations and increasing chocolate consumption. North America and Europe, while mature markets, continue to offer significant opportunities for premium and specialized cocoa products. The ongoing focus on product innovation, supply chain optimization, and ethical sourcing practices will be pivotal for companies to maintain a competitive edge and capture a larger share of this expanding market.
Cocoa Beans Industry Report: 2019-2033
This comprehensive report provides an in-depth analysis of the global cocoa beans industry, covering market size, growth drivers, challenges, and future outlook from 2019 to 2033. The report leverages extensive market research and data analysis to offer actionable insights for industry professionals, investors, and stakeholders. With a focus on key players like Cargill, Mars, Mondelez International, Olam International, and Barry Callebaut, this report is essential for navigating the complexities of this dynamic market. The study period spans 2019-2033, with 2025 as the base and estimated year.
Cocoa Beans Industry Market Structure & Innovation Trends
The global cocoa beans market exhibits moderate concentration, with a few dominant players controlling a significant market share. Cargill, Mars, Mondelez International, and Barry Callebaut collectively hold an estimated xx% market share in 2025, indicating a consolidated market structure. Innovation within the industry is driven by increasing consumer demand for sustainable and ethically sourced cocoa beans, prompting companies to invest in traceability and transparency initiatives. Regulatory frameworks, particularly concerning child labor and deforestation, are significantly influencing industry practices. Product substitutes, such as alternative sweeteners and plant-based chocolate alternatives, present a moderate threat to market growth. The end-user demographics show a strong global demand concentrated across confectionery, beverages, and bakery sectors. Mergers and acquisitions (M&A) activities have been moderate in recent years, with deal values totaling an estimated USD xx million between 2019 and 2024.
- Market Concentration: High, with top 5 players controlling xx% of the market.
- Innovation Drivers: Sustainability, ethical sourcing, traceability, and product diversification.
- Regulatory Framework: Stringent regulations concerning labor practices and environmental impact.
- M&A Activity: Moderate activity with total deal value of approximately USD xx million (2019-2024).
Cocoa Beans Industry Market Dynamics & Trends
The global cocoa beans market is expected to witness a Compound Annual Growth Rate (CAGR) of xx% during the forecast period (2025-2033). Key growth drivers include the rising global demand for chocolate and cocoa-based products, fueled by increasing disposable incomes and changing consumer preferences towards premium and specialized products. Technological disruptions, such as automation in cocoa bean processing and improved supply chain management systems, are enhancing efficiency and sustainability. However, fluctuating cocoa bean prices, climate change impacting crop yields, and increasing competition from alternative ingredients pose significant challenges. Market penetration of sustainable cocoa sourcing practices is gradually increasing, yet it still remains below xx%. Competitive dynamics are marked by fierce rivalry among major players, focusing on brand building, product innovation, and strategic partnerships.
Dominant Regions & Segments in Cocoa Beans Industry
The West African region, particularly Ivory Coast and Ghana, remains the dominant producer of cocoa beans globally. Key drivers include favorable climatic conditions and established agricultural practices. Other significant producing regions include South America and Southeast Asia.
- Leading Regions: West Africa (Ivory Coast, Ghana), followed by South America and Southeast Asia.
- Key Drivers (West Africa): Favorable climate, established farming practices, government support.
- Key Drivers (Other Regions): Growing demand, increased investments in infrastructure and technology.
Within product types, bulk cocoa beans constitute the largest segment due to its extensive usage in various applications. Among processing types, fermented cocoa beans dominate owing to improved flavor and aroma. The confectionery industry accounts for the largest end-user segment, followed by beverages and bakery products. Supermarkets/hypermarkets represent the primary sales channel, followed by specialty stores and online retail.
Cocoa Beans Industry Product Innovations
Recent innovations focus on enhancing the sustainability and traceability of cocoa beans, employing blockchain technology to track beans from farm to consumer. New product applications are emerging in the health and wellness sector, capitalizing on the health benefits of cocoa flavanols. Companies are also focusing on developing cocoa products with enhanced flavors and textures, catering to evolving consumer preferences.
Report Scope & Segmentation Analysis
This report segments the cocoa beans market based on product type (Bulk Cocoa Beans, Cocoa Butter, Cocoa Powder, Chocolate), processing type (Fermented, Non-Fermented), end-user industry (Confectionery, Beverages, Bakery Products), and sales channel (Online Retail, Supermarkets/Hypermarkets, Specialty Stores). Each segment’s market size, growth projections, and competitive dynamics are thoroughly analyzed, providing a comprehensive understanding of the industry's various facets.
Key Drivers of Cocoa Beans Industry Growth
Growth in the cocoa beans industry is propelled by several factors: rising global demand for chocolate and cocoa-based products, increasing disposable incomes in developing economies, innovation in cocoa processing technologies (e.g., improved fermentation and drying techniques), and increasing consumer preference for premium and specialized cocoa products. Government initiatives promoting sustainable cocoa farming practices also contribute to market expansion.
Challenges in the Cocoa Beans Industry Sector
The industry faces several challenges, including fluctuating cocoa bean prices driven by climate change and supply chain disruptions, stringent regulations on child labor and deforestation, and intense competition from alternative ingredients and substitutes. These factors can significantly impact production costs and profitability. The industry’s dependence on rainfall also represents a substantial risk.
Emerging Opportunities in Cocoa Beans Industry
Emerging opportunities include expanding into new markets, particularly in Asia and Africa, where demand for chocolate and cocoa-based products is growing rapidly. There's also significant potential for developing new, innovative cocoa-based products catering to specific health and wellness needs (e.g., high-flavonol cocoa). The increasing emphasis on sustainability presents an opportunity for companies to showcase responsible sourcing and ethical practices.
Leading Players in the Cocoa Beans Industry Market
Key Developments in Cocoa Beans Industry
- June 2021: Ivory Coast launches a biomass plant powered by cocoa waste, promoting sustainability and reducing reliance on fossil fuels.
- February 2022: India reduces custom duty on cocoa beans to 15% from 30%, potentially stimulating import and consumption.
- October 2022: The EU and its partners pledge USD 442 million to support Ivory Coast's efforts to combat child labor and deforestation in cocoa production. This initiative significantly impacts the industry's ethical sourcing efforts.
Future Outlook for Cocoa Beans Industry Market
The cocoa beans market is poised for continued growth, driven by increasing consumer demand, product innovation, and a growing focus on sustainability. Strategic partnerships, investments in sustainable farming practices, and diversification into new product applications will be crucial for success in the years to come. The industry must also address challenges related to climate change and ethical sourcing to ensure long-term sustainability.
Cocoa Beans Industry Segmentation
-
1. North America
- 1.1. United States
- 1.2. Canada
-
2. Europe
- 2.1. Germany
- 2.2. Netherland
- 2.3. United Kingdom
- 2.4. France
- 2.5. Belgium
- 2.6. Russia
-
3. Asia-Pacific
- 3.1. India
- 3.2. Malaysia
- 3.3. Indonesia
- 3.4. Singapore
- 3.5. Japan
-
4. South America
- 4.1. Brazil
- 4.2. Ecuador
-
5. Africa
- 5.1. Ghana
- 5.2. Ivory Coast
- 5.3. Nigeria
- 5.4. Cote D'lvoire
- 5.5. Cameroon
-
6. North America
- 6.1. United States
- 6.2. Canada
-
7. Europe
- 7.1. Germany
- 7.2. Netherland
- 7.3. United Kingdom
- 7.4. France
- 7.5. Belgium
- 7.6. Russia
-
8. Asia-Pacific
- 8.1. India
- 8.2. Malaysia
- 8.3. Indonesia
- 8.4. Singapore
- 8.5. Japan
-
9. South America
- 9.1. Brazil
- 9.2. Ecuador
-
10. Africa
- 10.1. Ghana
- 10.2. Ivory Coast
- 10.3. Nigeria
- 10.4. Cote D'lvoire
- 10.5. Cameroon
Cocoa Beans Industry Segmentation By Geography
-
1. North America
- 1.1. United States
- 1.2. Canada
- 1.3. Mexico
-
2. South America
- 2.1. Brazil
- 2.2. Argentina
- 2.3. Rest of South America
-
3. Europe
- 3.1. United Kingdom
- 3.2. Germany
- 3.3. France
- 3.4. Italy
- 3.5. Spain
- 3.6. Russia
- 3.7. Benelux
- 3.8. Nordics
- 3.9. Rest of Europe
-
4. Middle East & Africa
- 4.1. Turkey
- 4.2. Israel
- 4.3. GCC
- 4.4. North Africa
- 4.5. South Africa
- 4.6. Rest of Middle East & Africa
-
5. Asia Pacific
- 5.1. China
- 5.2. India
- 5.3. Japan
- 5.4. South Korea
- 5.5. ASEAN
- 5.6. Oceania
- 5.7. Rest of Asia Pacific
Cocoa Beans Industry REPORT HIGHLIGHTS
| Aspects | Details |
|---|---|
| Study Period | 2019-2033 |
| Base Year | 2024 |
| Estimated Year | 2025 |
| Forecast Period | 2025-2033 |
| Historical Period | 2019-2024 |
| Growth Rate | CAGR of 6.81% from 2019-2033 |
| Segmentation |
|
Table of Contents
- 1. Introduction
- 1.1. Research Scope
- 1.2. Market Segmentation
- 1.3. Research Methodology
- 1.4. Definitions and Assumptions
- 2. Executive Summary
- 2.1. Introduction
- 3. Market Dynamics
- 3.1. Introduction
- 3.2. Market Drivers
- 3.2.1. Increasing Demand for Indian Rice; Enhancing Production Capacities; Increasing Government Initiatives
- 3.3. Market Restrains
- 3.3.1. Abiotic and Biotic Stresses in Rice Cultivation; High Market Entry Costs
- 3.4. Market Trends
- 3.4.1. Wide Application of Cocoa in Different End-user Industries
- 4. Market Factor Analysis
- 4.1. Porters Five Forces
- 4.2. Supply/Value Chain
- 4.3. PESTEL analysis
- 4.4. Market Entropy
- 4.5. Patent/Trademark Analysis
- 5. Global Cocoa Beans Industry Analysis, Insights and Forecast, 2019-2031
- 5.1. Market Analysis, Insights and Forecast - by North America
- 5.1.1. United States
- 5.1.2. Canada
- 5.2. Market Analysis, Insights and Forecast - by Europe
- 5.2.1. Germany
- 5.2.2. Netherland
- 5.2.3. United Kingdom
- 5.2.4. France
- 5.2.5. Belgium
- 5.2.6. Russia
- 5.3. Market Analysis, Insights and Forecast - by Asia-Pacific
- 5.3.1. India
- 5.3.2. Malaysia
- 5.3.3. Indonesia
- 5.3.4. Singapore
- 5.3.5. Japan
- 5.4. Market Analysis, Insights and Forecast - by South America
- 5.4.1. Brazil
- 5.4.2. Ecuador
- 5.5. Market Analysis, Insights and Forecast - by Africa
- 5.5.1. Ghana
- 5.5.2. Ivory Coast
- 5.5.3. Nigeria
- 5.5.4. Cote D'lvoire
- 5.5.5. Cameroon
- 5.6. Market Analysis, Insights and Forecast - by North America
- 5.6.1. United States
- 5.6.2. Canada
- 5.7. Market Analysis, Insights and Forecast - by Europe
- 5.7.1. Germany
- 5.7.2. Netherland
- 5.7.3. United Kingdom
- 5.7.4. France
- 5.7.5. Belgium
- 5.7.6. Russia
- 5.8. Market Analysis, Insights and Forecast - by Asia-Pacific
- 5.8.1. India
- 5.8.2. Malaysia
- 5.8.3. Indonesia
- 5.8.4. Singapore
- 5.8.5. Japan
- 5.9. Market Analysis, Insights and Forecast - by South America
- 5.9.1. Brazil
- 5.9.2. Ecuador
- 5.10. Market Analysis, Insights and Forecast - by Africa
- 5.10.1. Ghana
- 5.10.2. Ivory Coast
- 5.10.3. Nigeria
- 5.10.4. Cote D'lvoire
- 5.10.5. Cameroon
- 5.11. Market Analysis, Insights and Forecast - by Region
- 5.11.1. North America
- 5.11.2. South America
- 5.11.3. Europe
- 5.11.4. Middle East & Africa
- 5.11.5. Asia Pacific
- 5.1. Market Analysis, Insights and Forecast - by North America
- 6. North America Cocoa Beans Industry Analysis, Insights and Forecast, 2019-2031
- 6.1. Market Analysis, Insights and Forecast - by North America
- 6.1.1. United States
- 6.1.2. Canada
- 6.2. Market Analysis, Insights and Forecast - by Europe
- 6.2.1. Germany
- 6.2.2. Netherland
- 6.2.3. United Kingdom
- 6.2.4. France
- 6.2.5. Belgium
- 6.2.6. Russia
- 6.3. Market Analysis, Insights and Forecast - by Asia-Pacific
- 6.3.1. India
- 6.3.2. Malaysia
- 6.3.3. Indonesia
- 6.3.4. Singapore
- 6.3.5. Japan
- 6.4. Market Analysis, Insights and Forecast - by South America
- 6.4.1. Brazil
- 6.4.2. Ecuador
- 6.5. Market Analysis, Insights and Forecast - by Africa
- 6.5.1. Ghana
- 6.5.2. Ivory Coast
- 6.5.3. Nigeria
- 6.5.4. Cote D'lvoire
- 6.5.5. Cameroon
- 6.6. Market Analysis, Insights and Forecast - by North America
- 6.6.1. United States
- 6.6.2. Canada
- 6.7. Market Analysis, Insights and Forecast - by Europe
- 6.7.1. Germany
- 6.7.2. Netherland
- 6.7.3. United Kingdom
- 6.7.4. France
- 6.7.5. Belgium
- 6.7.6. Russia
- 6.8. Market Analysis, Insights and Forecast - by Asia-Pacific
- 6.8.1. India
- 6.8.2. Malaysia
- 6.8.3. Indonesia
- 6.8.4. Singapore
- 6.8.5. Japan
- 6.9. Market Analysis, Insights and Forecast - by South America
- 6.9.1. Brazil
- 6.9.2. Ecuador
- 6.10. Market Analysis, Insights and Forecast - by Africa
- 6.10.1. Ghana
- 6.10.2. Ivory Coast
- 6.10.3. Nigeria
- 6.10.4. Cote D'lvoire
- 6.10.5. Cameroon
- 6.1. Market Analysis, Insights and Forecast - by North America
- 7. South America Cocoa Beans Industry Analysis, Insights and Forecast, 2019-2031
- 7.1. Market Analysis, Insights and Forecast - by North America
- 7.1.1. United States
- 7.1.2. Canada
- 7.2. Market Analysis, Insights and Forecast - by Europe
- 7.2.1. Germany
- 7.2.2. Netherland
- 7.2.3. United Kingdom
- 7.2.4. France
- 7.2.5. Belgium
- 7.2.6. Russia
- 7.3. Market Analysis, Insights and Forecast - by Asia-Pacific
- 7.3.1. India
- 7.3.2. Malaysia
- 7.3.3. Indonesia
- 7.3.4. Singapore
- 7.3.5. Japan
- 7.4. Market Analysis, Insights and Forecast - by South America
- 7.4.1. Brazil
- 7.4.2. Ecuador
- 7.5. Market Analysis, Insights and Forecast - by Africa
- 7.5.1. Ghana
- 7.5.2. Ivory Coast
- 7.5.3. Nigeria
- 7.5.4. Cote D'lvoire
- 7.5.5. Cameroon
- 7.6. Market Analysis, Insights and Forecast - by North America
- 7.6.1. United States
- 7.6.2. Canada
- 7.7. Market Analysis, Insights and Forecast - by Europe
- 7.7.1. Germany
- 7.7.2. Netherland
- 7.7.3. United Kingdom
- 7.7.4. France
- 7.7.5. Belgium
- 7.7.6. Russia
- 7.8. Market Analysis, Insights and Forecast - by Asia-Pacific
- 7.8.1. India
- 7.8.2. Malaysia
- 7.8.3. Indonesia
- 7.8.4. Singapore
- 7.8.5. Japan
- 7.9. Market Analysis, Insights and Forecast - by South America
- 7.9.1. Brazil
- 7.9.2. Ecuador
- 7.10. Market Analysis, Insights and Forecast - by Africa
- 7.10.1. Ghana
- 7.10.2. Ivory Coast
- 7.10.3. Nigeria
- 7.10.4. Cote D'lvoire
- 7.10.5. Cameroon
- 7.1. Market Analysis, Insights and Forecast - by North America
- 8. Europe Cocoa Beans Industry Analysis, Insights and Forecast, 2019-2031
- 8.1. Market Analysis, Insights and Forecast - by North America
- 8.1.1. United States
- 8.1.2. Canada
- 8.2. Market Analysis, Insights and Forecast - by Europe
- 8.2.1. Germany
- 8.2.2. Netherland
- 8.2.3. United Kingdom
- 8.2.4. France
- 8.2.5. Belgium
- 8.2.6. Russia
- 8.3. Market Analysis, Insights and Forecast - by Asia-Pacific
- 8.3.1. India
- 8.3.2. Malaysia
- 8.3.3. Indonesia
- 8.3.4. Singapore
- 8.3.5. Japan
- 8.4. Market Analysis, Insights and Forecast - by South America
- 8.4.1. Brazil
- 8.4.2. Ecuador
- 8.5. Market Analysis, Insights and Forecast - by Africa
- 8.5.1. Ghana
- 8.5.2. Ivory Coast
- 8.5.3. Nigeria
- 8.5.4. Cote D'lvoire
- 8.5.5. Cameroon
- 8.6. Market Analysis, Insights and Forecast - by North America
- 8.6.1. United States
- 8.6.2. Canada
- 8.7. Market Analysis, Insights and Forecast - by Europe
- 8.7.1. Germany
- 8.7.2. Netherland
- 8.7.3. United Kingdom
- 8.7.4. France
- 8.7.5. Belgium
- 8.7.6. Russia
- 8.8. Market Analysis, Insights and Forecast - by Asia-Pacific
- 8.8.1. India
- 8.8.2. Malaysia
- 8.8.3. Indonesia
- 8.8.4. Singapore
- 8.8.5. Japan
- 8.9. Market Analysis, Insights and Forecast - by South America
- 8.9.1. Brazil
- 8.9.2. Ecuador
- 8.10. Market Analysis, Insights and Forecast - by Africa
- 8.10.1. Ghana
- 8.10.2. Ivory Coast
- 8.10.3. Nigeria
- 8.10.4. Cote D'lvoire
- 8.10.5. Cameroon
- 8.1. Market Analysis, Insights and Forecast - by North America
- 9. Middle East & Africa Cocoa Beans Industry Analysis, Insights and Forecast, 2019-2031
- 9.1. Market Analysis, Insights and Forecast - by North America
- 9.1.1. United States
- 9.1.2. Canada
- 9.2. Market Analysis, Insights and Forecast - by Europe
- 9.2.1. Germany
- 9.2.2. Netherland
- 9.2.3. United Kingdom
- 9.2.4. France
- 9.2.5. Belgium
- 9.2.6. Russia
- 9.3. Market Analysis, Insights and Forecast - by Asia-Pacific
- 9.3.1. India
- 9.3.2. Malaysia
- 9.3.3. Indonesia
- 9.3.4. Singapore
- 9.3.5. Japan
- 9.4. Market Analysis, Insights and Forecast - by South America
- 9.4.1. Brazil
- 9.4.2. Ecuador
- 9.5. Market Analysis, Insights and Forecast - by Africa
- 9.5.1. Ghana
- 9.5.2. Ivory Coast
- 9.5.3. Nigeria
- 9.5.4. Cote D'lvoire
- 9.5.5. Cameroon
- 9.6. Market Analysis, Insights and Forecast - by North America
- 9.6.1. United States
- 9.6.2. Canada
- 9.7. Market Analysis, Insights and Forecast - by Europe
- 9.7.1. Germany
- 9.7.2. Netherland
- 9.7.3. United Kingdom
- 9.7.4. France
- 9.7.5. Belgium
- 9.7.6. Russia
- 9.8. Market Analysis, Insights and Forecast - by Asia-Pacific
- 9.8.1. India
- 9.8.2. Malaysia
- 9.8.3. Indonesia
- 9.8.4. Singapore
- 9.8.5. Japan
- 9.9. Market Analysis, Insights and Forecast - by South America
- 9.9.1. Brazil
- 9.9.2. Ecuador
- 9.10. Market Analysis, Insights and Forecast - by Africa
- 9.10.1. Ghana
- 9.10.2. Ivory Coast
- 9.10.3. Nigeria
- 9.10.4. Cote D'lvoire
- 9.10.5. Cameroon
- 9.1. Market Analysis, Insights and Forecast - by North America
- 10. Asia Pacific Cocoa Beans Industry Analysis, Insights and Forecast, 2019-2031
- 10.1. Market Analysis, Insights and Forecast - by North America
- 10.1.1. United States
- 10.1.2. Canada
- 10.2. Market Analysis, Insights and Forecast - by Europe
- 10.2.1. Germany
- 10.2.2. Netherland
- 10.2.3. United Kingdom
- 10.2.4. France
- 10.2.5. Belgium
- 10.2.6. Russia
- 10.3. Market Analysis, Insights and Forecast - by Asia-Pacific
- 10.3.1. India
- 10.3.2. Malaysia
- 10.3.3. Indonesia
- 10.3.4. Singapore
- 10.3.5. Japan
- 10.4. Market Analysis, Insights and Forecast - by South America
- 10.4.1. Brazil
- 10.4.2. Ecuador
- 10.5. Market Analysis, Insights and Forecast - by Africa
- 10.5.1. Ghana
- 10.5.2. Ivory Coast
- 10.5.3. Nigeria
- 10.5.4. Cote D'lvoire
- 10.5.5. Cameroon
- 10.6. Market Analysis, Insights and Forecast - by North America
- 10.6.1. United States
- 10.6.2. Canada
- 10.7. Market Analysis, Insights and Forecast - by Europe
- 10.7.1. Germany
- 10.7.2. Netherland
- 10.7.3. United Kingdom
- 10.7.4. France
- 10.7.5. Belgium
- 10.7.6. Russia
- 10.8. Market Analysis, Insights and Forecast - by Asia-Pacific
- 10.8.1. India
- 10.8.2. Malaysia
- 10.8.3. Indonesia
- 10.8.4. Singapore
- 10.8.5. Japan
- 10.9. Market Analysis, Insights and Forecast - by South America
- 10.9.1. Brazil
- 10.9.2. Ecuador
- 10.10. Market Analysis, Insights and Forecast - by Africa
- 10.10.1. Ghana
- 10.10.2. Ivory Coast
- 10.10.3. Nigeria
- 10.10.4. Cote D'lvoire
- 10.10.5. Cameroon
- 10.1. Market Analysis, Insights and Forecast - by North America
- 11. North America Cocoa Beans Industry Analysis, Insights and Forecast, 2019-2031
- 11.1. Market Analysis, Insights and Forecast - By Country/Sub-region
- 11.1.1 United States
- 11.1.2 Canada
- 11.1.3 Mexico
- 12. Europe Cocoa Beans Industry Analysis, Insights and Forecast, 2019-2031
- 12.1. Market Analysis, Insights and Forecast - By Country/Sub-region
- 12.1.1 Germany
- 12.1.2 United Kingdom
- 12.1.3 France
- 12.1.4 Spain
- 12.1.5 Italy
- 12.1.6 Spain
- 12.1.7 Belgium
- 12.1.8 Netherland
- 12.1.9 Nordics
- 12.1.10 Rest of Europe
- 13. Asia Pacific Cocoa Beans Industry Analysis, Insights and Forecast, 2019-2031
- 13.1. Market Analysis, Insights and Forecast - By Country/Sub-region
- 13.1.1 China
- 13.1.2 Japan
- 13.1.3 India
- 13.1.4 South Korea
- 13.1.5 Southeast Asia
- 13.1.6 Australia
- 13.1.7 Indonesia
- 13.1.8 Phillipes
- 13.1.9 Singapore
- 13.1.10 Thailandc
- 13.1.11 Rest of Asia Pacific
- 14. South America Cocoa Beans Industry Analysis, Insights and Forecast, 2019-2031
- 14.1. Market Analysis, Insights and Forecast - By Country/Sub-region
- 14.1.1 Brazil
- 14.1.2 Argentina
- 14.1.3 Peru
- 14.1.4 Chile
- 14.1.5 Colombia
- 14.1.6 Ecuador
- 14.1.7 Venezuela
- 14.1.8 Rest of South America
- 15. MEA Cocoa Beans Industry Analysis, Insights and Forecast, 2019-2031
- 15.1. Market Analysis, Insights and Forecast - By Country/Sub-region
- 15.1.1 United Arab Emirates
- 15.1.2 Saudi Arabia
- 15.1.3 South Africa
- 15.1.4 Rest of Middle East and Africa
- 16. Competitive Analysis
- 16.1. Global Market Share Analysis 2024
- 16.2. Company Profiles
- 16.2.1 Cargill
- 16.2.1.1. Overview
- 16.2.1.2. Products
- 16.2.1.3. SWOT Analysis
- 16.2.1.4. Recent Developments
- 16.2.1.5. Financials (Based on Availability)
- 16.2.2 Mars
- 16.2.2.1. Overview
- 16.2.2.2. Products
- 16.2.2.3. SWOT Analysis
- 16.2.2.4. Recent Developments
- 16.2.2.5. Financials (Based on Availability)
- 16.2.3 Mondelez International
- 16.2.3.1. Overview
- 16.2.3.2. Products
- 16.2.3.3. SWOT Analysis
- 16.2.3.4. Recent Developments
- 16.2.3.5. Financials (Based on Availability)
- 16.2.4 Olam International
- 16.2.4.1. Overview
- 16.2.4.2. Products
- 16.2.4.3. SWOT Analysis
- 16.2.4.4. Recent Developments
- 16.2.4.5. Financials (Based on Availability)
- 16.2.5 Barry Callebaut
- 16.2.5.1. Overview
- 16.2.5.2. Products
- 16.2.5.3. SWOT Analysis
- 16.2.5.4. Recent Developments
- 16.2.5.5. Financials (Based on Availability)
- 16.2.1 Cargill
List of Figures
- Figure 1: Global Cocoa Beans Industry Revenue Breakdown (Million, %) by Region 2024 & 2032
- Figure 2: North America Cocoa Beans Industry Revenue (Million), by Country 2024 & 2032
- Figure 3: North America Cocoa Beans Industry Revenue Share (%), by Country 2024 & 2032
- Figure 4: Europe Cocoa Beans Industry Revenue (Million), by Country 2024 & 2032
- Figure 5: Europe Cocoa Beans Industry Revenue Share (%), by Country 2024 & 2032
- Figure 6: Asia Pacific Cocoa Beans Industry Revenue (Million), by Country 2024 & 2032
- Figure 7: Asia Pacific Cocoa Beans Industry Revenue Share (%), by Country 2024 & 2032
- Figure 8: South America Cocoa Beans Industry Revenue (Million), by Country 2024 & 2032
- Figure 9: South America Cocoa Beans Industry Revenue Share (%), by Country 2024 & 2032
- Figure 10: MEA Cocoa Beans Industry Revenue (Million), by Country 2024 & 2032
- Figure 11: MEA Cocoa Beans Industry Revenue Share (%), by Country 2024 & 2032
- Figure 12: North America Cocoa Beans Industry Revenue (Million), by North America 2024 & 2032
- Figure 13: North America Cocoa Beans Industry Revenue Share (%), by North America 2024 & 2032
- Figure 14: North America Cocoa Beans Industry Revenue (Million), by Europe 2024 & 2032
- Figure 15: North America Cocoa Beans Industry Revenue Share (%), by Europe 2024 & 2032
- Figure 16: North America Cocoa Beans Industry Revenue (Million), by Asia-Pacific 2024 & 2032
- Figure 17: North America Cocoa Beans Industry Revenue Share (%), by Asia-Pacific 2024 & 2032
- Figure 18: North America Cocoa Beans Industry Revenue (Million), by South America 2024 & 2032
- Figure 19: North America Cocoa Beans Industry Revenue Share (%), by South America 2024 & 2032
- Figure 20: North America Cocoa Beans Industry Revenue (Million), by Africa 2024 & 2032
- Figure 21: North America Cocoa Beans Industry Revenue Share (%), by Africa 2024 & 2032
- Figure 22: North America Cocoa Beans Industry Revenue (Million), by North America 2024 & 2032
- Figure 23: North America Cocoa Beans Industry Revenue Share (%), by North America 2024 & 2032
- Figure 24: North America Cocoa Beans Industry Revenue (Million), by Europe 2024 & 2032
- Figure 25: North America Cocoa Beans Industry Revenue Share (%), by Europe 2024 & 2032
- Figure 26: North America Cocoa Beans Industry Revenue (Million), by Asia-Pacific 2024 & 2032
- Figure 27: North America Cocoa Beans Industry Revenue Share (%), by Asia-Pacific 2024 & 2032
- Figure 28: North America Cocoa Beans Industry Revenue (Million), by South America 2024 & 2032
- Figure 29: North America Cocoa Beans Industry Revenue Share (%), by South America 2024 & 2032
- Figure 30: North America Cocoa Beans Industry Revenue (Million), by Africa 2024 & 2032
- Figure 31: North America Cocoa Beans Industry Revenue Share (%), by Africa 2024 & 2032
- Figure 32: North America Cocoa Beans Industry Revenue (Million), by Country 2024 & 2032
- Figure 33: North America Cocoa Beans Industry Revenue Share (%), by Country 2024 & 2032
- Figure 34: South America Cocoa Beans Industry Revenue (Million), by North America 2024 & 2032
- Figure 35: South America Cocoa Beans Industry Revenue Share (%), by North America 2024 & 2032
- Figure 36: South America Cocoa Beans Industry Revenue (Million), by Europe 2024 & 2032
- Figure 37: South America Cocoa Beans Industry Revenue Share (%), by Europe 2024 & 2032
- Figure 38: South America Cocoa Beans Industry Revenue (Million), by Asia-Pacific 2024 & 2032
- Figure 39: South America Cocoa Beans Industry Revenue Share (%), by Asia-Pacific 2024 & 2032
- Figure 40: South America Cocoa Beans Industry Revenue (Million), by South America 2024 & 2032
- Figure 41: South America Cocoa Beans Industry Revenue Share (%), by South America 2024 & 2032
- Figure 42: South America Cocoa Beans Industry Revenue (Million), by Africa 2024 & 2032
- Figure 43: South America Cocoa Beans Industry Revenue Share (%), by Africa 2024 & 2032
- Figure 44: South America Cocoa Beans Industry Revenue (Million), by North America 2024 & 2032
- Figure 45: South America Cocoa Beans Industry Revenue Share (%), by North America 2024 & 2032
- Figure 46: South America Cocoa Beans Industry Revenue (Million), by Europe 2024 & 2032
- Figure 47: South America Cocoa Beans Industry Revenue Share (%), by Europe 2024 & 2032
- Figure 48: South America Cocoa Beans Industry Revenue (Million), by Asia-Pacific 2024 & 2032
- Figure 49: South America Cocoa Beans Industry Revenue Share (%), by Asia-Pacific 2024 & 2032
- Figure 50: South America Cocoa Beans Industry Revenue (Million), by South America 2024 & 2032
- Figure 51: South America Cocoa Beans Industry Revenue Share (%), by South America 2024 & 2032
- Figure 52: South America Cocoa Beans Industry Revenue (Million), by Africa 2024 & 2032
- Figure 53: South America Cocoa Beans Industry Revenue Share (%), by Africa 2024 & 2032
- Figure 54: South America Cocoa Beans Industry Revenue (Million), by Country 2024 & 2032
- Figure 55: South America Cocoa Beans Industry Revenue Share (%), by Country 2024 & 2032
- Figure 56: Europe Cocoa Beans Industry Revenue (Million), by North America 2024 & 2032
- Figure 57: Europe Cocoa Beans Industry Revenue Share (%), by North America 2024 & 2032
- Figure 58: Europe Cocoa Beans Industry Revenue (Million), by Europe 2024 & 2032
- Figure 59: Europe Cocoa Beans Industry Revenue Share (%), by Europe 2024 & 2032
- Figure 60: Europe Cocoa Beans Industry Revenue (Million), by Asia-Pacific 2024 & 2032
- Figure 61: Europe Cocoa Beans Industry Revenue Share (%), by Asia-Pacific 2024 & 2032
- Figure 62: Europe Cocoa Beans Industry Revenue (Million), by South America 2024 & 2032
- Figure 63: Europe Cocoa Beans Industry Revenue Share (%), by South America 2024 & 2032
- Figure 64: Europe Cocoa Beans Industry Revenue (Million), by Africa 2024 & 2032
- Figure 65: Europe Cocoa Beans Industry Revenue Share (%), by Africa 2024 & 2032
- Figure 66: Europe Cocoa Beans Industry Revenue (Million), by North America 2024 & 2032
- Figure 67: Europe Cocoa Beans Industry Revenue Share (%), by North America 2024 & 2032
- Figure 68: Europe Cocoa Beans Industry Revenue (Million), by Europe 2024 & 2032
- Figure 69: Europe Cocoa Beans Industry Revenue Share (%), by Europe 2024 & 2032
- Figure 70: Europe Cocoa Beans Industry Revenue (Million), by Asia-Pacific 2024 & 2032
- Figure 71: Europe Cocoa Beans Industry Revenue Share (%), by Asia-Pacific 2024 & 2032
- Figure 72: Europe Cocoa Beans Industry Revenue (Million), by South America 2024 & 2032
- Figure 73: Europe Cocoa Beans Industry Revenue Share (%), by South America 2024 & 2032
- Figure 74: Europe Cocoa Beans Industry Revenue (Million), by Africa 2024 & 2032
- Figure 75: Europe Cocoa Beans Industry Revenue Share (%), by Africa 2024 & 2032
- Figure 76: Europe Cocoa Beans Industry Revenue (Million), by Country 2024 & 2032
- Figure 77: Europe Cocoa Beans Industry Revenue Share (%), by Country 2024 & 2032
- Figure 78: Middle East & Africa Cocoa Beans Industry Revenue (Million), by North America 2024 & 2032
- Figure 79: Middle East & Africa Cocoa Beans Industry Revenue Share (%), by North America 2024 & 2032
- Figure 80: Middle East & Africa Cocoa Beans Industry Revenue (Million), by Europe 2024 & 2032
- Figure 81: Middle East & Africa Cocoa Beans Industry Revenue Share (%), by Europe 2024 & 2032
- Figure 82: Middle East & Africa Cocoa Beans Industry Revenue (Million), by Asia-Pacific 2024 & 2032
- Figure 83: Middle East & Africa Cocoa Beans Industry Revenue Share (%), by Asia-Pacific 2024 & 2032
- Figure 84: Middle East & Africa Cocoa Beans Industry Revenue (Million), by South America 2024 & 2032
- Figure 85: Middle East & Africa Cocoa Beans Industry Revenue Share (%), by South America 2024 & 2032
- Figure 86: Middle East & Africa Cocoa Beans Industry Revenue (Million), by Africa 2024 & 2032
- Figure 87: Middle East & Africa Cocoa Beans Industry Revenue Share (%), by Africa 2024 & 2032
- Figure 88: Middle East & Africa Cocoa Beans Industry Revenue (Million), by North America 2024 & 2032
- Figure 89: Middle East & Africa Cocoa Beans Industry Revenue Share (%), by North America 2024 & 2032
- Figure 90: Middle East & Africa Cocoa Beans Industry Revenue (Million), by Europe 2024 & 2032
- Figure 91: Middle East & Africa Cocoa Beans Industry Revenue Share (%), by Europe 2024 & 2032
- Figure 92: Middle East & Africa Cocoa Beans Industry Revenue (Million), by Asia-Pacific 2024 & 2032
- Figure 93: Middle East & Africa Cocoa Beans Industry Revenue Share (%), by Asia-Pacific 2024 & 2032
- Figure 94: Middle East & Africa Cocoa Beans Industry Revenue (Million), by South America 2024 & 2032
- Figure 95: Middle East & Africa Cocoa Beans Industry Revenue Share (%), by South America 2024 & 2032
- Figure 96: Middle East & Africa Cocoa Beans Industry Revenue (Million), by Africa 2024 & 2032
- Figure 97: Middle East & Africa Cocoa Beans Industry Revenue Share (%), by Africa 2024 & 2032
- Figure 98: Middle East & Africa Cocoa Beans Industry Revenue (Million), by Country 2024 & 2032
- Figure 99: Middle East & Africa Cocoa Beans Industry Revenue Share (%), by Country 2024 & 2032
- Figure 100: Asia Pacific Cocoa Beans Industry Revenue (Million), by North America 2024 & 2032
- Figure 101: Asia Pacific Cocoa Beans Industry Revenue Share (%), by North America 2024 & 2032
- Figure 102: Asia Pacific Cocoa Beans Industry Revenue (Million), by Europe 2024 & 2032
- Figure 103: Asia Pacific Cocoa Beans Industry Revenue Share (%), by Europe 2024 & 2032
- Figure 104: Asia Pacific Cocoa Beans Industry Revenue (Million), by Asia-Pacific 2024 & 2032
- Figure 105: Asia Pacific Cocoa Beans Industry Revenue Share (%), by Asia-Pacific 2024 & 2032
- Figure 106: Asia Pacific Cocoa Beans Industry Revenue (Million), by South America 2024 & 2032
- Figure 107: Asia Pacific Cocoa Beans Industry Revenue Share (%), by South America 2024 & 2032
- Figure 108: Asia Pacific Cocoa Beans Industry Revenue (Million), by Africa 2024 & 2032
- Figure 109: Asia Pacific Cocoa Beans Industry Revenue Share (%), by Africa 2024 & 2032
- Figure 110: Asia Pacific Cocoa Beans Industry Revenue (Million), by North America 2024 & 2032
- Figure 111: Asia Pacific Cocoa Beans Industry Revenue Share (%), by North America 2024 & 2032
- Figure 112: Asia Pacific Cocoa Beans Industry Revenue (Million), by Europe 2024 & 2032
- Figure 113: Asia Pacific Cocoa Beans Industry Revenue Share (%), by Europe 2024 & 2032
- Figure 114: Asia Pacific Cocoa Beans Industry Revenue (Million), by Asia-Pacific 2024 & 2032
- Figure 115: Asia Pacific Cocoa Beans Industry Revenue Share (%), by Asia-Pacific 2024 & 2032
- Figure 116: Asia Pacific Cocoa Beans Industry Revenue (Million), by South America 2024 & 2032
- Figure 117: Asia Pacific Cocoa Beans Industry Revenue Share (%), by South America 2024 & 2032
- Figure 118: Asia Pacific Cocoa Beans Industry Revenue (Million), by Africa 2024 & 2032
- Figure 119: Asia Pacific Cocoa Beans Industry Revenue Share (%), by Africa 2024 & 2032
- Figure 120: Asia Pacific Cocoa Beans Industry Revenue (Million), by Country 2024 & 2032
- Figure 121: Asia Pacific Cocoa Beans Industry Revenue Share (%), by Country 2024 & 2032
List of Tables
- Table 1: Global Cocoa Beans Industry Revenue Million Forecast, by Region 2019 & 2032
- Table 2: Global Cocoa Beans Industry Revenue Million Forecast, by North America 2019 & 2032
- Table 3: Global Cocoa Beans Industry Revenue Million Forecast, by Europe 2019 & 2032
- Table 4: Global Cocoa Beans Industry Revenue Million Forecast, by Asia-Pacific 2019 & 2032
- Table 5: Global Cocoa Beans Industry Revenue Million Forecast, by South America 2019 & 2032
- Table 6: Global Cocoa Beans Industry Revenue Million Forecast, by Africa 2019 & 2032
- Table 7: Global Cocoa Beans Industry Revenue Million Forecast, by North America 2019 & 2032
- Table 8: Global Cocoa Beans Industry Revenue Million Forecast, by Europe 2019 & 2032
- Table 9: Global Cocoa Beans Industry Revenue Million Forecast, by Asia-Pacific 2019 & 2032
- Table 10: Global Cocoa Beans Industry Revenue Million Forecast, by South America 2019 & 2032
- Table 11: Global Cocoa Beans Industry Revenue Million Forecast, by Africa 2019 & 2032
- Table 12: Global Cocoa Beans Industry Revenue Million Forecast, by Region 2019 & 2032
- Table 13: Global Cocoa Beans Industry Revenue Million Forecast, by Country 2019 & 2032
- Table 14: United States Cocoa Beans Industry Revenue (Million) Forecast, by Application 2019 & 2032
- Table 15: Canada Cocoa Beans Industry Revenue (Million) Forecast, by Application 2019 & 2032
- Table 16: Mexico Cocoa Beans Industry Revenue (Million) Forecast, by Application 2019 & 2032
- Table 17: Global Cocoa Beans Industry Revenue Million Forecast, by Country 2019 & 2032
- Table 18: Germany Cocoa Beans Industry Revenue (Million) Forecast, by Application 2019 & 2032
- Table 19: United Kingdom Cocoa Beans Industry Revenue (Million) Forecast, by Application 2019 & 2032
- Table 20: France Cocoa Beans Industry Revenue (Million) Forecast, by Application 2019 & 2032
- Table 21: Spain Cocoa Beans Industry Revenue (Million) Forecast, by Application 2019 & 2032
- Table 22: Italy Cocoa Beans Industry Revenue (Million) Forecast, by Application 2019 & 2032
- Table 23: Spain Cocoa Beans Industry Revenue (Million) Forecast, by Application 2019 & 2032
- Table 24: Belgium Cocoa Beans Industry Revenue (Million) Forecast, by Application 2019 & 2032
- Table 25: Netherland Cocoa Beans Industry Revenue (Million) Forecast, by Application 2019 & 2032
- Table 26: Nordics Cocoa Beans Industry Revenue (Million) Forecast, by Application 2019 & 2032
- Table 27: Rest of Europe Cocoa Beans Industry Revenue (Million) Forecast, by Application 2019 & 2032
- Table 28: Global Cocoa Beans Industry Revenue Million Forecast, by Country 2019 & 2032
- Table 29: China Cocoa Beans Industry Revenue (Million) Forecast, by Application 2019 & 2032
- Table 30: Japan Cocoa Beans Industry Revenue (Million) Forecast, by Application 2019 & 2032
- Table 31: India Cocoa Beans Industry Revenue (Million) Forecast, by Application 2019 & 2032
- Table 32: South Korea Cocoa Beans Industry Revenue (Million) Forecast, by Application 2019 & 2032
- Table 33: Southeast Asia Cocoa Beans Industry Revenue (Million) Forecast, by Application 2019 & 2032
- Table 34: Australia Cocoa Beans Industry Revenue (Million) Forecast, by Application 2019 & 2032
- Table 35: Indonesia Cocoa Beans Industry Revenue (Million) Forecast, by Application 2019 & 2032
- Table 36: Phillipes Cocoa Beans Industry Revenue (Million) Forecast, by Application 2019 & 2032
- Table 37: Singapore Cocoa Beans Industry Revenue (Million) Forecast, by Application 2019 & 2032
- Table 38: Thailandc Cocoa Beans Industry Revenue (Million) Forecast, by Application 2019 & 2032
- Table 39: Rest of Asia Pacific Cocoa Beans Industry Revenue (Million) Forecast, by Application 2019 & 2032
- Table 40: Global Cocoa Beans Industry Revenue Million Forecast, by Country 2019 & 2032
- Table 41: Brazil Cocoa Beans Industry Revenue (Million) Forecast, by Application 2019 & 2032
- Table 42: Argentina Cocoa Beans Industry Revenue (Million) Forecast, by Application 2019 & 2032
- Table 43: Peru Cocoa Beans Industry Revenue (Million) Forecast, by Application 2019 & 2032
- Table 44: Chile Cocoa Beans Industry Revenue (Million) Forecast, by Application 2019 & 2032
- Table 45: Colombia Cocoa Beans Industry Revenue (Million) Forecast, by Application 2019 & 2032
- Table 46: Ecuador Cocoa Beans Industry Revenue (Million) Forecast, by Application 2019 & 2032
- Table 47: Venezuela Cocoa Beans Industry Revenue (Million) Forecast, by Application 2019 & 2032
- Table 48: Rest of South America Cocoa Beans Industry Revenue (Million) Forecast, by Application 2019 & 2032
- Table 49: Global Cocoa Beans Industry Revenue Million Forecast, by Country 2019 & 2032
- Table 50: United Arab Emirates Cocoa Beans Industry Revenue (Million) Forecast, by Application 2019 & 2032
- Table 51: Saudi Arabia Cocoa Beans Industry Revenue (Million) Forecast, by Application 2019 & 2032
- Table 52: South Africa Cocoa Beans Industry Revenue (Million) Forecast, by Application 2019 & 2032
- Table 53: Rest of Middle East and Africa Cocoa Beans Industry Revenue (Million) Forecast, by Application 2019 & 2032
- Table 54: Global Cocoa Beans Industry Revenue Million Forecast, by North America 2019 & 2032
- Table 55: Global Cocoa Beans Industry Revenue Million Forecast, by Europe 2019 & 2032
- Table 56: Global Cocoa Beans Industry Revenue Million Forecast, by Asia-Pacific 2019 & 2032
- Table 57: Global Cocoa Beans Industry Revenue Million Forecast, by South America 2019 & 2032
- Table 58: Global Cocoa Beans Industry Revenue Million Forecast, by Africa 2019 & 2032
- Table 59: Global Cocoa Beans Industry Revenue Million Forecast, by North America 2019 & 2032
- Table 60: Global Cocoa Beans Industry Revenue Million Forecast, by Europe 2019 & 2032
- Table 61: Global Cocoa Beans Industry Revenue Million Forecast, by Asia-Pacific 2019 & 2032
- Table 62: Global Cocoa Beans Industry Revenue Million Forecast, by South America 2019 & 2032
- Table 63: Global Cocoa Beans Industry Revenue Million Forecast, by Africa 2019 & 2032
- Table 64: Global Cocoa Beans Industry Revenue Million Forecast, by Country 2019 & 2032
- Table 65: United States Cocoa Beans Industry Revenue (Million) Forecast, by Application 2019 & 2032
- Table 66: Canada Cocoa Beans Industry Revenue (Million) Forecast, by Application 2019 & 2032
- Table 67: Mexico Cocoa Beans Industry Revenue (Million) Forecast, by Application 2019 & 2032
- Table 68: Global Cocoa Beans Industry Revenue Million Forecast, by North America 2019 & 2032
- Table 69: Global Cocoa Beans Industry Revenue Million Forecast, by Europe 2019 & 2032
- Table 70: Global Cocoa Beans Industry Revenue Million Forecast, by Asia-Pacific 2019 & 2032
- Table 71: Global Cocoa Beans Industry Revenue Million Forecast, by South America 2019 & 2032
- Table 72: Global Cocoa Beans Industry Revenue Million Forecast, by Africa 2019 & 2032
- Table 73: Global Cocoa Beans Industry Revenue Million Forecast, by North America 2019 & 2032
- Table 74: Global Cocoa Beans Industry Revenue Million Forecast, by Europe 2019 & 2032
- Table 75: Global Cocoa Beans Industry Revenue Million Forecast, by Asia-Pacific 2019 & 2032
- Table 76: Global Cocoa Beans Industry Revenue Million Forecast, by South America 2019 & 2032
- Table 77: Global Cocoa Beans Industry Revenue Million Forecast, by Africa 2019 & 2032
- Table 78: Global Cocoa Beans Industry Revenue Million Forecast, by Country 2019 & 2032
- Table 79: Brazil Cocoa Beans Industry Revenue (Million) Forecast, by Application 2019 & 2032
- Table 80: Argentina Cocoa Beans Industry Revenue (Million) Forecast, by Application 2019 & 2032
- Table 81: Rest of South America Cocoa Beans Industry Revenue (Million) Forecast, by Application 2019 & 2032
- Table 82: Global Cocoa Beans Industry Revenue Million Forecast, by North America 2019 & 2032
- Table 83: Global Cocoa Beans Industry Revenue Million Forecast, by Europe 2019 & 2032
- Table 84: Global Cocoa Beans Industry Revenue Million Forecast, by Asia-Pacific 2019 & 2032
- Table 85: Global Cocoa Beans Industry Revenue Million Forecast, by South America 2019 & 2032
- Table 86: Global Cocoa Beans Industry Revenue Million Forecast, by Africa 2019 & 2032
- Table 87: Global Cocoa Beans Industry Revenue Million Forecast, by North America 2019 & 2032
- Table 88: Global Cocoa Beans Industry Revenue Million Forecast, by Europe 2019 & 2032
- Table 89: Global Cocoa Beans Industry Revenue Million Forecast, by Asia-Pacific 2019 & 2032
- Table 90: Global Cocoa Beans Industry Revenue Million Forecast, by South America 2019 & 2032
- Table 91: Global Cocoa Beans Industry Revenue Million Forecast, by Africa 2019 & 2032
- Table 92: Global Cocoa Beans Industry Revenue Million Forecast, by Country 2019 & 2032
- Table 93: United Kingdom Cocoa Beans Industry Revenue (Million) Forecast, by Application 2019 & 2032
- Table 94: Germany Cocoa Beans Industry Revenue (Million) Forecast, by Application 2019 & 2032
- Table 95: France Cocoa Beans Industry Revenue (Million) Forecast, by Application 2019 & 2032
- Table 96: Italy Cocoa Beans Industry Revenue (Million) Forecast, by Application 2019 & 2032
- Table 97: Spain Cocoa Beans Industry Revenue (Million) Forecast, by Application 2019 & 2032
- Table 98: Russia Cocoa Beans Industry Revenue (Million) Forecast, by Application 2019 & 2032
- Table 99: Benelux Cocoa Beans Industry Revenue (Million) Forecast, by Application 2019 & 2032
- Table 100: Nordics Cocoa Beans Industry Revenue (Million) Forecast, by Application 2019 & 2032
- Table 101: Rest of Europe Cocoa Beans Industry Revenue (Million) Forecast, by Application 2019 & 2032
- Table 102: Global Cocoa Beans Industry Revenue Million Forecast, by North America 2019 & 2032
- Table 103: Global Cocoa Beans Industry Revenue Million Forecast, by Europe 2019 & 2032
- Table 104: Global Cocoa Beans Industry Revenue Million Forecast, by Asia-Pacific 2019 & 2032
- Table 105: Global Cocoa Beans Industry Revenue Million Forecast, by South America 2019 & 2032
- Table 106: Global Cocoa Beans Industry Revenue Million Forecast, by Africa 2019 & 2032
- Table 107: Global Cocoa Beans Industry Revenue Million Forecast, by North America 2019 & 2032
- Table 108: Global Cocoa Beans Industry Revenue Million Forecast, by Europe 2019 & 2032
- Table 109: Global Cocoa Beans Industry Revenue Million Forecast, by Asia-Pacific 2019 & 2032
- Table 110: Global Cocoa Beans Industry Revenue Million Forecast, by South America 2019 & 2032
- Table 111: Global Cocoa Beans Industry Revenue Million Forecast, by Africa 2019 & 2032
- Table 112: Global Cocoa Beans Industry Revenue Million Forecast, by Country 2019 & 2032
- Table 113: Turkey Cocoa Beans Industry Revenue (Million) Forecast, by Application 2019 & 2032
- Table 114: Israel Cocoa Beans Industry Revenue (Million) Forecast, by Application 2019 & 2032
- Table 115: GCC Cocoa Beans Industry Revenue (Million) Forecast, by Application 2019 & 2032
- Table 116: North Africa Cocoa Beans Industry Revenue (Million) Forecast, by Application 2019 & 2032
- Table 117: South Africa Cocoa Beans Industry Revenue (Million) Forecast, by Application 2019 & 2032
- Table 118: Rest of Middle East & Africa Cocoa Beans Industry Revenue (Million) Forecast, by Application 2019 & 2032
- Table 119: Global Cocoa Beans Industry Revenue Million Forecast, by North America 2019 & 2032
- Table 120: Global Cocoa Beans Industry Revenue Million Forecast, by Europe 2019 & 2032
- Table 121: Global Cocoa Beans Industry Revenue Million Forecast, by Asia-Pacific 2019 & 2032
- Table 122: Global Cocoa Beans Industry Revenue Million Forecast, by South America 2019 & 2032
- Table 123: Global Cocoa Beans Industry Revenue Million Forecast, by Africa 2019 & 2032
- Table 124: Global Cocoa Beans Industry Revenue Million Forecast, by North America 2019 & 2032
- Table 125: Global Cocoa Beans Industry Revenue Million Forecast, by Europe 2019 & 2032
- Table 126: Global Cocoa Beans Industry Revenue Million Forecast, by Asia-Pacific 2019 & 2032
- Table 127: Global Cocoa Beans Industry Revenue Million Forecast, by South America 2019 & 2032
- Table 128: Global Cocoa Beans Industry Revenue Million Forecast, by Africa 2019 & 2032
- Table 129: Global Cocoa Beans Industry Revenue Million Forecast, by Country 2019 & 2032
- Table 130: China Cocoa Beans Industry Revenue (Million) Forecast, by Application 2019 & 2032
- Table 131: India Cocoa Beans Industry Revenue (Million) Forecast, by Application 2019 & 2032
- Table 132: Japan Cocoa Beans Industry Revenue (Million) Forecast, by Application 2019 & 2032
- Table 133: South Korea Cocoa Beans Industry Revenue (Million) Forecast, by Application 2019 & 2032
- Table 134: ASEAN Cocoa Beans Industry Revenue (Million) Forecast, by Application 2019 & 2032
- Table 135: Oceania Cocoa Beans Industry Revenue (Million) Forecast, by Application 2019 & 2032
- Table 136: Rest of Asia Pacific Cocoa Beans Industry Revenue (Million) Forecast, by Application 2019 & 2032
Frequently Asked Questions
1. What is the projected Compound Annual Growth Rate (CAGR) of the Cocoa Beans Industry?
The projected CAGR is approximately 6.81%.
2. Which companies are prominent players in the Cocoa Beans Industry?
Key companies in the market include Cargill , Mars, Mondelez International , Olam International , Barry Callebaut.
3. What are the main segments of the Cocoa Beans Industry?
The market segments include North America, Europe, Asia-Pacific, South America, Africa, North America, Europe, Asia-Pacific, South America, Africa.
4. Can you provide details about the market size?
The market size is estimated to be USD 17.24 Million as of 2022.
5. What are some drivers contributing to market growth?
Increasing Demand for Indian Rice; Enhancing Production Capacities; Increasing Government Initiatives.
6. What are the notable trends driving market growth?
Wide Application of Cocoa in Different End-user Industries.
7. Are there any restraints impacting market growth?
Abiotic and Biotic Stresses in Rice Cultivation; High Market Entry Costs.
8. Can you provide examples of recent developments in the market?
October 2022: The European Union and its partners have collectively planned to raise 450 million euros (USD442 million) to support Ivory Coast's push to tackle child labor and deforestation linked to cocoa production.
9. What pricing options are available for accessing the report?
Pricing options include single-user, multi-user, and enterprise licenses priced at USD 4750, USD 5250, and USD 8750 respectively.
10. Is the market size provided in terms of value or volume?
The market size is provided in terms of value, measured in Million.
11. Are there any specific market keywords associated with the report?
Yes, the market keyword associated with the report is "Cocoa Beans Industry," which aids in identifying and referencing the specific market segment covered.
12. How do I determine which pricing option suits my needs best?
The pricing options vary based on user requirements and access needs. Individual users may opt for single-user licenses, while businesses requiring broader access may choose multi-user or enterprise licenses for cost-effective access to the report.
13. Are there any additional resources or data provided in the Cocoa Beans Industry report?
While the report offers comprehensive insights, it's advisable to review the specific contents or supplementary materials provided to ascertain if additional resources or data are available.
14. How can I stay updated on further developments or reports in the Cocoa Beans Industry?
To stay informed about further developments, trends, and reports in the Cocoa Beans Industry, consider subscribing to industry newsletters, following relevant companies and organizations, or regularly checking reputable industry news sources and publications.
Methodology
Step 1 - Identification of Relevant Samples Size from Population Database


Step 2 - Approaches for Defining Global Market Size (Value, Volume* & Price*)

Note*: In applicable scenarios
Step 3 - Data Sources
Primary Research
- Web Analytics
- Survey Reports
- Research Institute
- Latest Research Reports
- Opinion Leaders
Secondary Research
- Annual Reports
- White Paper
- Latest Press Release
- Industry Association
- Paid Database
- Investor Presentations

Step 4 - Data Triangulation
Involves using different sources of information in order to increase the validity of a study
These sources are likely to be stakeholders in a program - participants, other researchers, program staff, other community members, and so on.
Then we put all data in single framework & apply various statistical tools to find out the dynamic on the market.
During the analysis stage, feedback from the stakeholder groups would be compared to determine areas of agreement as well as areas of divergence


