Connected Street Lighting Industry Market Strategies for the Next Decade: 2025-2033

Connected Street Lighting Industry by Production Analysis, by Consumption Analysis, by Import Market Analysis (Value & Volume), by Export Market Analysis (Value & Volume), by Price Trend Analysis, by North America, by Europe, by Asia Pacific, by Rest of the World Forecast 2025-2033

Jun 24 2025
Base Year: 2024

234 Pages
Main Logo

Connected Street Lighting Industry Market Strategies for the Next Decade: 2025-2033


Home
Industries
Technology, Media and Telecom
sponsor image
sponsor image
sponsor image
sponsor image
sponsor image
sponsor image
sponsor image
sponsor image
sponsor image
sponsor image
sponsor image
sponsor image
sponsor image
sponsor image
sponsor image
sponsor image
sponsor image
sponsor image
sponsor image
sponsor image

Tailored for you

  • In-depth Analysis Tailored to Specified Regions or Segments
  • Company Profiles Customized to User Preferences
  • Comprehensive Insights Focused on Specific Segments or Regions
  • Customized Evaluation of Competitive Landscape to Meet Your Needs
  • Tailored Customization to Address Other Specific Requirements
Ask for customization


Key Insights

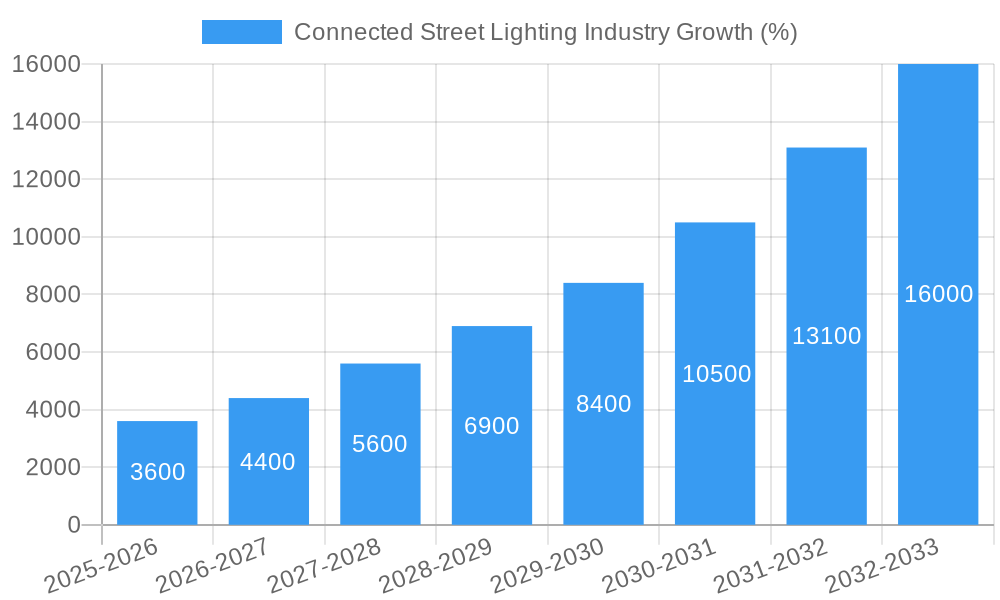
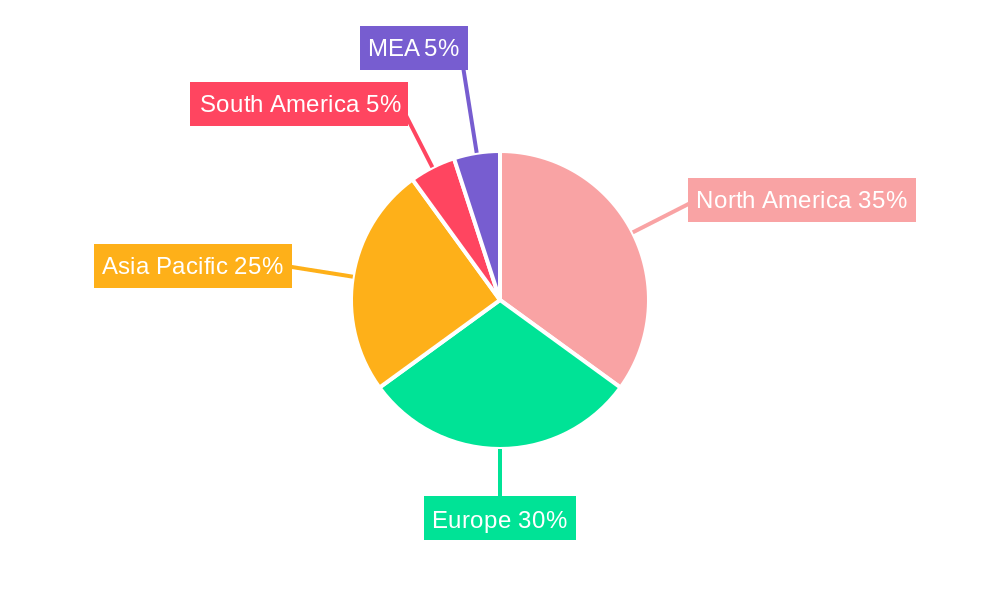
The connected street lighting market is experiencing rapid growth, driven by increasing urbanization, the need for energy efficiency, and the desire for enhanced public safety and smart city initiatives. A compound annual growth rate (CAGR) of 24.10% from 2019 to 2024 suggests a significant expansion, with projections indicating continued strong growth through 2033. Key drivers include government initiatives promoting energy-efficient infrastructure, the falling costs of smart lighting technologies, and the integration of smart street lighting into broader IoT ecosystems. The market segmentation reveals substantial opportunities across various types (smart streetlights, connected controllers, software platforms) and applications (residential, commercial, industrial). North America and Europe currently hold significant market shares, but the Asia-Pacific region is projected to witness the most substantial growth due to rapid infrastructure development and increasing adoption of smart city technologies in developing economies. While the initial investment costs can be a restraint, the long-term cost savings from reduced energy consumption and improved maintenance outweigh this factor, further fueling market expansion. The competitive landscape is dynamic, with established players like Itron, Signify, and Acuity Brands competing with emerging technology providers. Successful strategies will likely involve focusing on innovative solutions, strategic partnerships, and robust data analytics capabilities to optimize energy consumption, enhance operational efficiency, and deliver valuable insights for city management.

The market's future hinges on the successful integration of connected street lighting into broader smart city initiatives, requiring effective collaboration between technology providers, municipalities, and utility companies. Advancements in areas like AI-powered lighting control, predictive maintenance, and enhanced data security will further shape market growth. Furthermore, the increasing demand for sustainable and environmentally friendly solutions will strengthen the appeal of connected street lighting, given its significant contribution to energy reduction and carbon footprint minimization. Competition is anticipated to intensify as more players enter the market, driving innovation and potentially leading to price reductions, thus expanding market accessibility and accelerating adoption rates. Therefore, a focus on providing comprehensive solutions that address the unique needs of different geographical regions and market segments will be crucial for success in this rapidly evolving landscape.

Connected Street Lighting Industry Research Report - Market Size, Growth & Forecast

Connected Street Lighting Industry Market Report: 2019-2033

This comprehensive report provides an in-depth analysis of the Connected Street Lighting industry, offering valuable insights for industry professionals, investors, and strategic decision-makers. The report covers the period from 2019 to 2033, with a focus on the 2025-2033 forecast period. The market is valued at xx Million in 2025 and is projected to reach xx Million by 2033, exhibiting a CAGR of xx%.

Connected Street Lighting Industry Market Structure & Innovation Trends

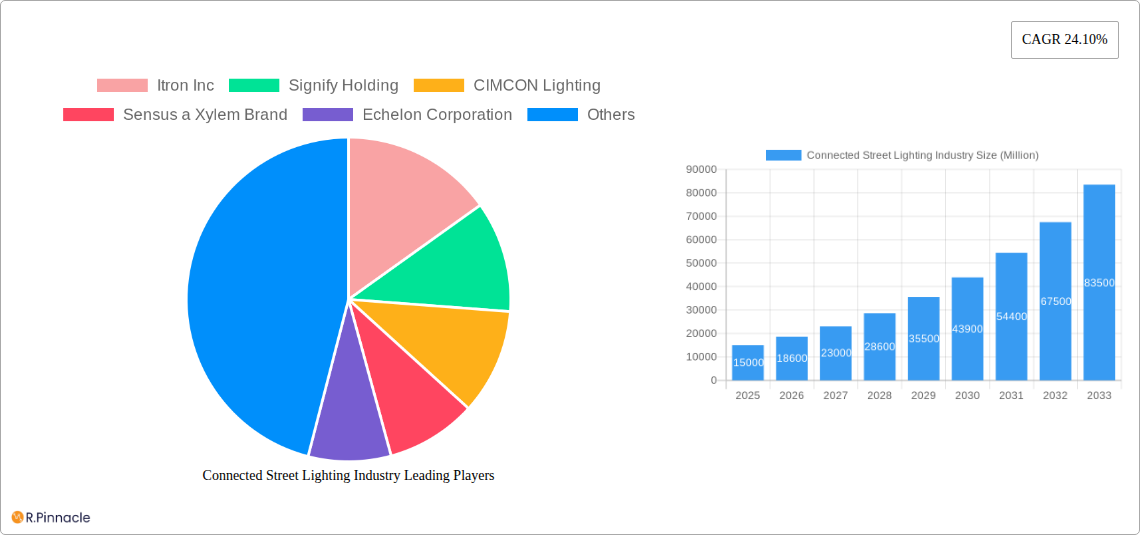
This section analyzes the competitive landscape, innovation drivers, regulatory factors, and market dynamics within the connected street lighting industry. The market is characterized by a mix of large multinational corporations and specialized smaller players. Key players like Itron Inc, Signify Holding, and Acuity Brands Inc hold significant market share, while smaller companies like CIMCON Lighting and Telensa Limited focus on niche technologies and geographic regions. Market concentration is moderate, with the top 5 players accounting for approximately xx% of the market share in 2025.

Innovation is driven by the demand for energy efficiency, improved safety, and enhanced city management capabilities. Regulatory frameworks, including government incentives for energy-efficient infrastructure and smart city initiatives, significantly impact market growth. Product substitutes, such as traditional street lighting systems, are gradually losing market share due to the superior benefits offered by connected solutions. The industry has witnessed several mergers and acquisitions (M&A) in recent years, with deal values totaling approximately xx Million in 2024. These M&A activities reflect the strategic consolidation and expansion efforts of major players.

Connected Street Lighting Industry Growth

Connected Street Lighting Industry Market Dynamics & Trends

The connected street lighting market is experiencing significant growth, fueled by increasing urbanization, rising energy costs, and government initiatives promoting smart city development. Technological advancements, such as the integration of IoT (Internet of Things) technologies, AI, and improved sensor capabilities, are driving market penetration. Consumer preferences are shifting toward energy-efficient, sustainable solutions that enhance public safety and improve city aesthetics. Competitive dynamics are characterized by product differentiation, technological innovation, and strategic partnerships. The market is expected to experience substantial growth over the forecast period, primarily driven by increasing adoption in developing economies.

Connected Street Lighting Industry Growth

Dominant Regions & Segments in Connected Street Lighting Industry

The North American region is currently the dominant market for connected street lighting, driven by strong government support, robust infrastructure, and high adoption rates in major cities. Europe also holds significant market share, exhibiting strong growth due to increasing investments in smart city projects and sustainability initiatives. Within the segments, Smart Streetlights constitute the largest market share, followed by Connected Controllers and Software Platforms. The Commercial application segment is currently leading, with a significant portion of the investments coming from corporate entities.

  • Key Drivers for North America:

    • Robust infrastructure and high technological adoption rates.
    • Strong government support for smart city initiatives and energy efficiency programs.
    • High disposable income levels and willingness to invest in advanced technologies.
  • Key Drivers for Europe:

    • Growing emphasis on sustainability and environmental protection.
    • Increasing investments in smart city projects and related infrastructure development.
    • Stringent regulations and policies promoting energy efficiency.
  • Key Drivers for Commercial Segment:

    • Higher ROI due to energy cost savings and improved operational efficiency.
    • Increased focus on enhancing security and safety in commercial areas.
    • Demand for smart city solutions and data-driven insights for improved business operations.

Connected Street Lighting Industry Product Innovations

Recent product innovations focus on improving energy efficiency, incorporating advanced sensor technologies, and enhancing data analytics capabilities. The integration of AI and machine learning allows for predictive maintenance and optimized energy management. Manufacturers are increasingly offering customized solutions to cater to specific city needs and budgets. The competitive advantage hinges on providing reliable, cost-effective, and scalable solutions that meet the evolving requirements of smart city initiatives.

Report Scope & Segmentation Analysis

The report segments the connected street lighting market by Type (Smart Streetlights, Connected Controllers, Software Platforms) and Application (Residential, Commercial, Industrial). Each segment presents distinct growth dynamics, market size, and competitive landscapes. The Smart Streetlights segment is the largest and fastest-growing, driven by high demand for energy-efficient and feature-rich street lighting solutions. The Commercial application segment exhibits the highest growth rate, fueled by large-scale deployments in urban areas. The market size for each segment is projected to grow significantly during the forecast period, driven by increasing urbanization, technological advancements, and government policies.

Key Drivers of Connected Street Lighting Industry Growth

The growth of the connected street lighting industry is primarily driven by increasing urbanization, rising energy costs, and government initiatives promoting energy efficiency and smart city development. Technological advancements such as IoT sensors, AI-powered analytics, and improved energy-saving capabilities are key drivers. Stringent environmental regulations are also pushing the adoption of energy-efficient street lighting solutions. For example, many cities are implementing incentives and rebates for upgrading to smart street lighting infrastructure.

Challenges in the Connected Street Lighting Industry Sector

Challenges include the high initial investment costs associated with infrastructure upgrades, concerns regarding data security and privacy, and the complexity of integrating various systems and technologies. Supply chain disruptions and the availability of skilled labor for installation and maintenance also pose challenges. Furthermore, regulatory compliance and standardization issues can impact market growth and hinder widespread adoption.

Emerging Opportunities in Connected Street Lighting Industry

Emerging opportunities lie in the integration of advanced technologies like 5G networks, improved sensor capabilities, and the development of innovative data analytics solutions for city management. The expanding adoption of smart city initiatives globally presents substantial growth opportunities. Furthermore, new market segments, such as smart highway lighting and industrial area lighting, are showing high potential for growth.

Leading Players in the Connected Street Lighting Industry Market

  • Itron Inc
  • Signify Holding
  • CIMCON Lighting
  • Sensus a Xylem Brand
  • Echelon Corporation
  • TVILIGHT Projects BV
  • GridComm
  • Acuity Brands Inc
  • InteliLIGHT (Flashnet SA)
  • Telensa Limited
  • Guangdong Rongwen Energy Technology Group
  • Delta Electronics Inc
  • List Not Exhaustive

Key Developments in Connected Street Lighting Industry

  • December 2022: Itron, Inc. partners with Baltimore Gas & Electric (BGE) to connect and manage 260,000 smart streetlights, reducing energy consumption and enhancing community safety.
  • October 2022: Telensa Holdings Ltd. introduces connected street light solutions with enhanced cellular connectivity, providing a highly adaptable solution.

Future Outlook for Connected Street Lighting Industry Market

The connected street lighting market is poised for significant growth, driven by continued urbanization, technological advancements, and government support for smart city initiatives. The focus on sustainable solutions, energy efficiency, and data-driven city management will further drive adoption. Strategic partnerships, technological innovation, and expansion into new markets will be key factors in shaping the future of the industry.

Connected Street Lighting Industry Segmentation

  • 1. Production Analysis
  • 2. Consumption Analysis
  • 3. Import Market Analysis (Value & Volume)
  • 4. Export Market Analysis (Value & Volume)
  • 5. Price Trend Analysis

Connected Street Lighting Industry Segmentation By Geography

  • 1. North America
  • 2. Europe
  • 3. Asia Pacific
  • 4. Rest of the World
Connected Street Lighting Industry Regional Share


Connected Street Lighting Industry REPORT HIGHLIGHTS

AspectsDetails
Study Period 2019-2033
Base Year 2024
Estimated Year 2025
Forecast Period2025-2033
Historical Period2019-2024
Growth RateCAGR of 24.10% from 2019-2033
Segmentation
    • By Production Analysis
    • By Consumption Analysis
    • By Import Market Analysis (Value & Volume)
    • By Export Market Analysis (Value & Volume)
    • By Price Trend Analysis
  • By Geography
    • North America
    • Europe
    • Asia Pacific
    • Rest of the World


Table of Contents

  1. 1. Introduction
    • 1.1. Research Scope
    • 1.2. Market Segmentation
    • 1.3. Research Methodology
    • 1.4. Definitions and Assumptions
  2. 2. Executive Summary
    • 2.1. Introduction
  3. 3. Market Dynamics
    • 3.1. Introduction
      • 3.2. Market Drivers
        • 3.2.1 Government Regulations Mandating the Use of Energy Efficient Automation Solutions; Adoption of Advanced Wireless Connectivity Technologies (RF Mesh Networks
        • 3.2.2 5G
        • 3.2.3 LTE etc.); Increasing Number of Smart City Initiative and Down Trend of LED Prices
      • 3.3. Market Restrains
        • 3.3.1. Higher Capital Investment for Retrofitting or New Installations Leading to Budget Constraints; Cyber security and Operational Constraints Often Limiting the Installations to Cities with Fitting IT and Communication Infrastructure
      • 3.4. Market Trends
        • 3.4.1. Increasing Number of Smart City Initiative and Down Trend of LED Prices to Drive the Market
  4. 4. Market Factor Analysis
    • 4.1. Porters Five Forces
    • 4.2. Supply/Value Chain
    • 4.3. PESTEL analysis
    • 4.4. Market Entropy
    • 4.5. Patent/Trademark Analysis
  5. 5. Global Connected Street Lighting Industry Analysis, Insights and Forecast, 2019-2031
    • 5.1. Market Analysis, Insights and Forecast - by Production Analysis
      • 5.2. Market Analysis, Insights and Forecast - by Consumption Analysis
        • 5.3. Market Analysis, Insights and Forecast - by Import Market Analysis (Value & Volume)
          • 5.4. Market Analysis, Insights and Forecast - by Export Market Analysis (Value & Volume)
            • 5.5. Market Analysis, Insights and Forecast - by Price Trend Analysis
              • 5.6. Market Analysis, Insights and Forecast - by Region
                • 5.6.1. North America
                • 5.6.2. Europe
                • 5.6.3. Asia Pacific
                • 5.6.4. Rest of the World
            • 6. North America Connected Street Lighting Industry Analysis, Insights and Forecast, 2019-2031
              • 6.1. Market Analysis, Insights and Forecast - by Production Analysis
                • 6.2. Market Analysis, Insights and Forecast - by Consumption Analysis
                  • 6.3. Market Analysis, Insights and Forecast - by Import Market Analysis (Value & Volume)
                    • 6.4. Market Analysis, Insights and Forecast - by Export Market Analysis (Value & Volume)
                      • 6.5. Market Analysis, Insights and Forecast - by Price Trend Analysis
                      • 7. Europe Connected Street Lighting Industry Analysis, Insights and Forecast, 2019-2031
                        • 7.1. Market Analysis, Insights and Forecast - by Production Analysis
                          • 7.2. Market Analysis, Insights and Forecast - by Consumption Analysis
                            • 7.3. Market Analysis, Insights and Forecast - by Import Market Analysis (Value & Volume)
                              • 7.4. Market Analysis, Insights and Forecast - by Export Market Analysis (Value & Volume)
                                • 7.5. Market Analysis, Insights and Forecast - by Price Trend Analysis
                                • 8. Asia Pacific Connected Street Lighting Industry Analysis, Insights and Forecast, 2019-2031
                                  • 8.1. Market Analysis, Insights and Forecast - by Production Analysis
                                    • 8.2. Market Analysis, Insights and Forecast - by Consumption Analysis
                                      • 8.3. Market Analysis, Insights and Forecast - by Import Market Analysis (Value & Volume)
                                        • 8.4. Market Analysis, Insights and Forecast - by Export Market Analysis (Value & Volume)
                                          • 8.5. Market Analysis, Insights and Forecast - by Price Trend Analysis
                                          • 9. Rest of the World Connected Street Lighting Industry Analysis, Insights and Forecast, 2019-2031
                                            • 9.1. Market Analysis, Insights and Forecast - by Production Analysis
                                              • 9.2. Market Analysis, Insights and Forecast - by Consumption Analysis
                                                • 9.3. Market Analysis, Insights and Forecast - by Import Market Analysis (Value & Volume)
                                                  • 9.4. Market Analysis, Insights and Forecast - by Export Market Analysis (Value & Volume)
                                                    • 9.5. Market Analysis, Insights and Forecast - by Price Trend Analysis
                                                    • 10. North America Connected Street Lighting Industry Analysis, Insights and Forecast, 2019-2031
                                                        • 10.1. Market Analysis, Insights and Forecast - By Country/Sub-region
                                                          • 10.1.1 United States
                                                          • 10.1.2 Canada
                                                          • 10.1.3 Mexico
                                                    • 11. Europe Connected Street Lighting Industry Analysis, Insights and Forecast, 2019-2031
                                                        • 11.1. Market Analysis, Insights and Forecast - By Country/Sub-region
                                                          • 11.1.1 Germany
                                                          • 11.1.2 France
                                                          • 11.1.3 Italy
                                                          • 11.1.4 United Kingdom
                                                          • 11.1.5 Netherlands
                                                          • 11.1.6 Sweden
                                                          • 11.1.7 Rest of Europe
                                                    • 12. Asia Pacific Connected Street Lighting Industry Analysis, Insights and Forecast, 2019-2031
                                                        • 12.1. Market Analysis, Insights and Forecast - By Country/Sub-region
                                                          • 12.1.1 China
                                                          • 12.1.2 Japan
                                                          • 12.1.3 India
                                                          • 12.1.4 South Korea
                                                          • 12.1.5 Taiwan
                                                          • 12.1.6 Australia
                                                          • 12.1.7 Rest of Asia-Pacific
                                                    • 13. South America Connected Street Lighting Industry Analysis, Insights and Forecast, 2019-2031
                                                        • 13.1. Market Analysis, Insights and Forecast - By Country/Sub-region
                                                          • 13.1.1 Brazil
                                                          • 13.1.2 Argentina
                                                          • 13.1.3 Rest of South America
                                                    • 14. MEA Connected Street Lighting Industry Analysis, Insights and Forecast, 2019-2031
                                                        • 14.1. Market Analysis, Insights and Forecast - By Country/Sub-region
                                                          • 14.1.1 United Arab Emirates
                                                          • 14.1.2 Saudi Arabia
                                                          • 14.1.3 South Africa
                                                          • 14.1.4 Rest of Middle East and Africa
                                                    • 15. Competitive Analysis
                                                      • 15.1. Global Market Share Analysis 2024
                                                        • 15.2. Company Profiles
                                                          • 15.2.1 Itron Inc
                                                            • 15.2.1.1. Overview
                                                            • 15.2.1.2. Products
                                                            • 15.2.1.3. SWOT Analysis
                                                            • 15.2.1.4. Recent Developments
                                                            • 15.2.1.5. Financials (Based on Availability)
                                                          • 15.2.2 Signify Holding
                                                            • 15.2.2.1. Overview
                                                            • 15.2.2.2. Products
                                                            • 15.2.2.3. SWOT Analysis
                                                            • 15.2.2.4. Recent Developments
                                                            • 15.2.2.5. Financials (Based on Availability)
                                                          • 15.2.3 CIMCON Lighting
                                                            • 15.2.3.1. Overview
                                                            • 15.2.3.2. Products
                                                            • 15.2.3.3. SWOT Analysis
                                                            • 15.2.3.4. Recent Developments
                                                            • 15.2.3.5. Financials (Based on Availability)
                                                          • 15.2.4 Sensus a Xylem Brand
                                                            • 15.2.4.1. Overview
                                                            • 15.2.4.2. Products
                                                            • 15.2.4.3. SWOT Analysis
                                                            • 15.2.4.4. Recent Developments
                                                            • 15.2.4.5. Financials (Based on Availability)
                                                          • 15.2.5 Echelon Corporation
                                                            • 15.2.5.1. Overview
                                                            • 15.2.5.2. Products
                                                            • 15.2.5.3. SWOT Analysis
                                                            • 15.2.5.4. Recent Developments
                                                            • 15.2.5.5. Financials (Based on Availability)
                                                          • 15.2.6 TVILIGHT Projects BV
                                                            • 15.2.6.1. Overview
                                                            • 15.2.6.2. Products
                                                            • 15.2.6.3. SWOT Analysis
                                                            • 15.2.6.4. Recent Developments
                                                            • 15.2.6.5. Financials (Based on Availability)
                                                          • 15.2.7 GridComm
                                                            • 15.2.7.1. Overview
                                                            • 15.2.7.2. Products
                                                            • 15.2.7.3. SWOT Analysis
                                                            • 15.2.7.4. Recent Developments
                                                            • 15.2.7.5. Financials (Based on Availability)
                                                          • 15.2.8 Acuity Brands Inc
                                                            • 15.2.8.1. Overview
                                                            • 15.2.8.2. Products
                                                            • 15.2.8.3. SWOT Analysis
                                                            • 15.2.8.4. Recent Developments
                                                            • 15.2.8.5. Financials (Based on Availability)
                                                          • 15.2.9 InteliLIGHT (Flashnet SA)
                                                            • 15.2.9.1. Overview
                                                            • 15.2.9.2. Products
                                                            • 15.2.9.3. SWOT Analysis
                                                            • 15.2.9.4. Recent Developments
                                                            • 15.2.9.5. Financials (Based on Availability)
                                                          • 15.2.10 Telensa Limited
                                                            • 15.2.10.1. Overview
                                                            • 15.2.10.2. Products
                                                            • 15.2.10.3. SWOT Analysis
                                                            • 15.2.10.4. Recent Developments
                                                            • 15.2.10.5. Financials (Based on Availability)
                                                          • 15.2.11 Guangdong Rongwen Energy Technology Group
                                                            • 15.2.11.1. Overview
                                                            • 15.2.11.2. Products
                                                            • 15.2.11.3. SWOT Analysis
                                                            • 15.2.11.4. Recent Developments
                                                            • 15.2.11.5. Financials (Based on Availability)
                                                          • 15.2.12 Delta Electronics Inc *List Not Exhaustive
                                                            • 15.2.12.1. Overview
                                                            • 15.2.12.2. Products
                                                            • 15.2.12.3. SWOT Analysis
                                                            • 15.2.12.4. Recent Developments
                                                            • 15.2.12.5. Financials (Based on Availability)

                                                    List of Figures

                                                    1. Figure 1: Global Connected Street Lighting Industry Revenue Breakdown (Million, %) by Region 2024 & 2032
                                                    2. Figure 2: North America Connected Street Lighting Industry Revenue (Million), by Country 2024 & 2032
                                                    3. Figure 3: North America Connected Street Lighting Industry Revenue Share (%), by Country 2024 & 2032
                                                    4. Figure 4: Europe Connected Street Lighting Industry Revenue (Million), by Country 2024 & 2032
                                                    5. Figure 5: Europe Connected Street Lighting Industry Revenue Share (%), by Country 2024 & 2032
                                                    6. Figure 6: Asia Pacific Connected Street Lighting Industry Revenue (Million), by Country 2024 & 2032
                                                    7. Figure 7: Asia Pacific Connected Street Lighting Industry Revenue Share (%), by Country 2024 & 2032
                                                    8. Figure 8: South America Connected Street Lighting Industry Revenue (Million), by Country 2024 & 2032
                                                    9. Figure 9: South America Connected Street Lighting Industry Revenue Share (%), by Country 2024 & 2032
                                                    10. Figure 10: MEA Connected Street Lighting Industry Revenue (Million), by Country 2024 & 2032
                                                    11. Figure 11: MEA Connected Street Lighting Industry Revenue Share (%), by Country 2024 & 2032
                                                    12. Figure 12: North America Connected Street Lighting Industry Revenue (Million), by Production Analysis 2024 & 2032
                                                    13. Figure 13: North America Connected Street Lighting Industry Revenue Share (%), by Production Analysis 2024 & 2032
                                                    14. Figure 14: North America Connected Street Lighting Industry Revenue (Million), by Consumption Analysis 2024 & 2032
                                                    15. Figure 15: North America Connected Street Lighting Industry Revenue Share (%), by Consumption Analysis 2024 & 2032
                                                    16. Figure 16: North America Connected Street Lighting Industry Revenue (Million), by Import Market Analysis (Value & Volume) 2024 & 2032
                                                    17. Figure 17: North America Connected Street Lighting Industry Revenue Share (%), by Import Market Analysis (Value & Volume) 2024 & 2032
                                                    18. Figure 18: North America Connected Street Lighting Industry Revenue (Million), by Export Market Analysis (Value & Volume) 2024 & 2032
                                                    19. Figure 19: North America Connected Street Lighting Industry Revenue Share (%), by Export Market Analysis (Value & Volume) 2024 & 2032
                                                    20. Figure 20: North America Connected Street Lighting Industry Revenue (Million), by Price Trend Analysis 2024 & 2032
                                                    21. Figure 21: North America Connected Street Lighting Industry Revenue Share (%), by Price Trend Analysis 2024 & 2032
                                                    22. Figure 22: North America Connected Street Lighting Industry Revenue (Million), by Country 2024 & 2032
                                                    23. Figure 23: North America Connected Street Lighting Industry Revenue Share (%), by Country 2024 & 2032
                                                    24. Figure 24: Europe Connected Street Lighting Industry Revenue (Million), by Production Analysis 2024 & 2032
                                                    25. Figure 25: Europe Connected Street Lighting Industry Revenue Share (%), by Production Analysis 2024 & 2032
                                                    26. Figure 26: Europe Connected Street Lighting Industry Revenue (Million), by Consumption Analysis 2024 & 2032
                                                    27. Figure 27: Europe Connected Street Lighting Industry Revenue Share (%), by Consumption Analysis 2024 & 2032
                                                    28. Figure 28: Europe Connected Street Lighting Industry Revenue (Million), by Import Market Analysis (Value & Volume) 2024 & 2032
                                                    29. Figure 29: Europe Connected Street Lighting Industry Revenue Share (%), by Import Market Analysis (Value & Volume) 2024 & 2032
                                                    30. Figure 30: Europe Connected Street Lighting Industry Revenue (Million), by Export Market Analysis (Value & Volume) 2024 & 2032
                                                    31. Figure 31: Europe Connected Street Lighting Industry Revenue Share (%), by Export Market Analysis (Value & Volume) 2024 & 2032
                                                    32. Figure 32: Europe Connected Street Lighting Industry Revenue (Million), by Price Trend Analysis 2024 & 2032
                                                    33. Figure 33: Europe Connected Street Lighting Industry Revenue Share (%), by Price Trend Analysis 2024 & 2032
                                                    34. Figure 34: Europe Connected Street Lighting Industry Revenue (Million), by Country 2024 & 2032
                                                    35. Figure 35: Europe Connected Street Lighting Industry Revenue Share (%), by Country 2024 & 2032
                                                    36. Figure 36: Asia Pacific Connected Street Lighting Industry Revenue (Million), by Production Analysis 2024 & 2032
                                                    37. Figure 37: Asia Pacific Connected Street Lighting Industry Revenue Share (%), by Production Analysis 2024 & 2032
                                                    38. Figure 38: Asia Pacific Connected Street Lighting Industry Revenue (Million), by Consumption Analysis 2024 & 2032
                                                    39. Figure 39: Asia Pacific Connected Street Lighting Industry Revenue Share (%), by Consumption Analysis 2024 & 2032
                                                    40. Figure 40: Asia Pacific Connected Street Lighting Industry Revenue (Million), by Import Market Analysis (Value & Volume) 2024 & 2032
                                                    41. Figure 41: Asia Pacific Connected Street Lighting Industry Revenue Share (%), by Import Market Analysis (Value & Volume) 2024 & 2032
                                                    42. Figure 42: Asia Pacific Connected Street Lighting Industry Revenue (Million), by Export Market Analysis (Value & Volume) 2024 & 2032
                                                    43. Figure 43: Asia Pacific Connected Street Lighting Industry Revenue Share (%), by Export Market Analysis (Value & Volume) 2024 & 2032
                                                    44. Figure 44: Asia Pacific Connected Street Lighting Industry Revenue (Million), by Price Trend Analysis 2024 & 2032
                                                    45. Figure 45: Asia Pacific Connected Street Lighting Industry Revenue Share (%), by Price Trend Analysis 2024 & 2032
                                                    46. Figure 46: Asia Pacific Connected Street Lighting Industry Revenue (Million), by Country 2024 & 2032
                                                    47. Figure 47: Asia Pacific Connected Street Lighting Industry Revenue Share (%), by Country 2024 & 2032
                                                    48. Figure 48: Rest of the World Connected Street Lighting Industry Revenue (Million), by Production Analysis 2024 & 2032
                                                    49. Figure 49: Rest of the World Connected Street Lighting Industry Revenue Share (%), by Production Analysis 2024 & 2032
                                                    50. Figure 50: Rest of the World Connected Street Lighting Industry Revenue (Million), by Consumption Analysis 2024 & 2032
                                                    51. Figure 51: Rest of the World Connected Street Lighting Industry Revenue Share (%), by Consumption Analysis 2024 & 2032
                                                    52. Figure 52: Rest of the World Connected Street Lighting Industry Revenue (Million), by Import Market Analysis (Value & Volume) 2024 & 2032
                                                    53. Figure 53: Rest of the World Connected Street Lighting Industry Revenue Share (%), by Import Market Analysis (Value & Volume) 2024 & 2032
                                                    54. Figure 54: Rest of the World Connected Street Lighting Industry Revenue (Million), by Export Market Analysis (Value & Volume) 2024 & 2032
                                                    55. Figure 55: Rest of the World Connected Street Lighting Industry Revenue Share (%), by Export Market Analysis (Value & Volume) 2024 & 2032
                                                    56. Figure 56: Rest of the World Connected Street Lighting Industry Revenue (Million), by Price Trend Analysis 2024 & 2032
                                                    57. Figure 57: Rest of the World Connected Street Lighting Industry Revenue Share (%), by Price Trend Analysis 2024 & 2032
                                                    58. Figure 58: Rest of the World Connected Street Lighting Industry Revenue (Million), by Country 2024 & 2032
                                                    59. Figure 59: Rest of the World Connected Street Lighting Industry Revenue Share (%), by Country 2024 & 2032

                                                    List of Tables

                                                    1. Table 1: Global Connected Street Lighting Industry Revenue Million Forecast, by Region 2019 & 2032
                                                    2. Table 2: Global Connected Street Lighting Industry Revenue Million Forecast, by Production Analysis 2019 & 2032
                                                    3. Table 3: Global Connected Street Lighting Industry Revenue Million Forecast, by Consumption Analysis 2019 & 2032
                                                    4. Table 4: Global Connected Street Lighting Industry Revenue Million Forecast, by Import Market Analysis (Value & Volume) 2019 & 2032
                                                    5. Table 5: Global Connected Street Lighting Industry Revenue Million Forecast, by Export Market Analysis (Value & Volume) 2019 & 2032
                                                    6. Table 6: Global Connected Street Lighting Industry Revenue Million Forecast, by Price Trend Analysis 2019 & 2032
                                                    7. Table 7: Global Connected Street Lighting Industry Revenue Million Forecast, by Region 2019 & 2032
                                                    8. Table 8: Global Connected Street Lighting Industry Revenue Million Forecast, by Country 2019 & 2032
                                                    9. Table 9: United States Connected Street Lighting Industry Revenue (Million) Forecast, by Application 2019 & 2032
                                                    10. Table 10: Canada Connected Street Lighting Industry Revenue (Million) Forecast, by Application 2019 & 2032
                                                    11. Table 11: Mexico Connected Street Lighting Industry Revenue (Million) Forecast, by Application 2019 & 2032
                                                    12. Table 12: Global Connected Street Lighting Industry Revenue Million Forecast, by Country 2019 & 2032
                                                    13. Table 13: Germany Connected Street Lighting Industry Revenue (Million) Forecast, by Application 2019 & 2032
                                                    14. Table 14: France Connected Street Lighting Industry Revenue (Million) Forecast, by Application 2019 & 2032
                                                    15. Table 15: Italy Connected Street Lighting Industry Revenue (Million) Forecast, by Application 2019 & 2032
                                                    16. Table 16: United Kingdom Connected Street Lighting Industry Revenue (Million) Forecast, by Application 2019 & 2032
                                                    17. Table 17: Netherlands Connected Street Lighting Industry Revenue (Million) Forecast, by Application 2019 & 2032
                                                    18. Table 18: Sweden Connected Street Lighting Industry Revenue (Million) Forecast, by Application 2019 & 2032
                                                    19. Table 19: Rest of Europe Connected Street Lighting Industry Revenue (Million) Forecast, by Application 2019 & 2032
                                                    20. Table 20: Global Connected Street Lighting Industry Revenue Million Forecast, by Country 2019 & 2032
                                                    21. Table 21: China Connected Street Lighting Industry Revenue (Million) Forecast, by Application 2019 & 2032
                                                    22. Table 22: Japan Connected Street Lighting Industry Revenue (Million) Forecast, by Application 2019 & 2032
                                                    23. Table 23: India Connected Street Lighting Industry Revenue (Million) Forecast, by Application 2019 & 2032
                                                    24. Table 24: South Korea Connected Street Lighting Industry Revenue (Million) Forecast, by Application 2019 & 2032
                                                    25. Table 25: Taiwan Connected Street Lighting Industry Revenue (Million) Forecast, by Application 2019 & 2032
                                                    26. Table 26: Australia Connected Street Lighting Industry Revenue (Million) Forecast, by Application 2019 & 2032
                                                    27. Table 27: Rest of Asia-Pacific Connected Street Lighting Industry Revenue (Million) Forecast, by Application 2019 & 2032
                                                    28. Table 28: Global Connected Street Lighting Industry Revenue Million Forecast, by Country 2019 & 2032
                                                    29. Table 29: Brazil Connected Street Lighting Industry Revenue (Million) Forecast, by Application 2019 & 2032
                                                    30. Table 30: Argentina Connected Street Lighting Industry Revenue (Million) Forecast, by Application 2019 & 2032
                                                    31. Table 31: Rest of South America Connected Street Lighting Industry Revenue (Million) Forecast, by Application 2019 & 2032
                                                    32. Table 32: Global Connected Street Lighting Industry Revenue Million Forecast, by Country 2019 & 2032
                                                    33. Table 33: United Arab Emirates Connected Street Lighting Industry Revenue (Million) Forecast, by Application 2019 & 2032
                                                    34. Table 34: Saudi Arabia Connected Street Lighting Industry Revenue (Million) Forecast, by Application 2019 & 2032
                                                    35. Table 35: South Africa Connected Street Lighting Industry Revenue (Million) Forecast, by Application 2019 & 2032
                                                    36. Table 36: Rest of Middle East and Africa Connected Street Lighting Industry Revenue (Million) Forecast, by Application 2019 & 2032
                                                    37. Table 37: Global Connected Street Lighting Industry Revenue Million Forecast, by Production Analysis 2019 & 2032
                                                    38. Table 38: Global Connected Street Lighting Industry Revenue Million Forecast, by Consumption Analysis 2019 & 2032
                                                    39. Table 39: Global Connected Street Lighting Industry Revenue Million Forecast, by Import Market Analysis (Value & Volume) 2019 & 2032
                                                    40. Table 40: Global Connected Street Lighting Industry Revenue Million Forecast, by Export Market Analysis (Value & Volume) 2019 & 2032
                                                    41. Table 41: Global Connected Street Lighting Industry Revenue Million Forecast, by Price Trend Analysis 2019 & 2032
                                                    42. Table 42: Global Connected Street Lighting Industry Revenue Million Forecast, by Country 2019 & 2032
                                                    43. Table 43: Global Connected Street Lighting Industry Revenue Million Forecast, by Production Analysis 2019 & 2032
                                                    44. Table 44: Global Connected Street Lighting Industry Revenue Million Forecast, by Consumption Analysis 2019 & 2032
                                                    45. Table 45: Global Connected Street Lighting Industry Revenue Million Forecast, by Import Market Analysis (Value & Volume) 2019 & 2032
                                                    46. Table 46: Global Connected Street Lighting Industry Revenue Million Forecast, by Export Market Analysis (Value & Volume) 2019 & 2032
                                                    47. Table 47: Global Connected Street Lighting Industry Revenue Million Forecast, by Price Trend Analysis 2019 & 2032
                                                    48. Table 48: Global Connected Street Lighting Industry Revenue Million Forecast, by Country 2019 & 2032
                                                    49. Table 49: Global Connected Street Lighting Industry Revenue Million Forecast, by Production Analysis 2019 & 2032
                                                    50. Table 50: Global Connected Street Lighting Industry Revenue Million Forecast, by Consumption Analysis 2019 & 2032
                                                    51. Table 51: Global Connected Street Lighting Industry Revenue Million Forecast, by Import Market Analysis (Value & Volume) 2019 & 2032
                                                    52. Table 52: Global Connected Street Lighting Industry Revenue Million Forecast, by Export Market Analysis (Value & Volume) 2019 & 2032
                                                    53. Table 53: Global Connected Street Lighting Industry Revenue Million Forecast, by Price Trend Analysis 2019 & 2032
                                                    54. Table 54: Global Connected Street Lighting Industry Revenue Million Forecast, by Country 2019 & 2032
                                                    55. Table 55: Global Connected Street Lighting Industry Revenue Million Forecast, by Production Analysis 2019 & 2032
                                                    56. Table 56: Global Connected Street Lighting Industry Revenue Million Forecast, by Consumption Analysis 2019 & 2032
                                                    57. Table 57: Global Connected Street Lighting Industry Revenue Million Forecast, by Import Market Analysis (Value & Volume) 2019 & 2032
                                                    58. Table 58: Global Connected Street Lighting Industry Revenue Million Forecast, by Export Market Analysis (Value & Volume) 2019 & 2032
                                                    59. Table 59: Global Connected Street Lighting Industry Revenue Million Forecast, by Price Trend Analysis 2019 & 2032
                                                    60. Table 60: Global Connected Street Lighting Industry Revenue Million Forecast, by Country 2019 & 2032


                                                    Frequently Asked Questions

                                                    1. What is the projected Compound Annual Growth Rate (CAGR) of the Connected Street Lighting Industry?

                                                    The projected CAGR is approximately 24.10%.

                                                    2. Which companies are prominent players in the Connected Street Lighting Industry?

                                                    Key companies in the market include Itron Inc, Signify Holding, CIMCON Lighting, Sensus a Xylem Brand, Echelon Corporation, TVILIGHT Projects BV, GridComm, Acuity Brands Inc, InteliLIGHT (Flashnet SA), Telensa Limited, Guangdong Rongwen Energy Technology Group, Delta Electronics Inc *List Not Exhaustive.

                                                    3. What are the main segments of the Connected Street Lighting Industry?

                                                    The market segments include Production Analysis, Consumption Analysis, Import Market Analysis (Value & Volume), Export Market Analysis (Value & Volume), Price Trend Analysis.

                                                    4. Can you provide details about the market size?

                                                    The market size is estimated to be USD XX Million as of 2022.

                                                    5. What are some drivers contributing to market growth?

                                                    Government Regulations Mandating the Use of Energy Efficient Automation Solutions; Adoption of Advanced Wireless Connectivity Technologies (RF Mesh Networks. 5G. LTE etc.); Increasing Number of Smart City Initiative and Down Trend of LED Prices.

                                                    6. What are the notable trends driving market growth?

                                                    Increasing Number of Smart City Initiative and Down Trend of LED Prices to Drive the Market.

                                                    7. Are there any restraints impacting market growth?

                                                    Higher Capital Investment for Retrofitting or New Installations Leading to Budget Constraints; Cyber security and Operational Constraints Often Limiting the Installations to Cities with Fitting IT and Communication Infrastructure.

                                                    8. Can you provide examples of recent developments in the market?

                                                    December 2022 - Itron, Inc. announced that it's working together with Maryland's gas and electric utility, Baltimore Gas & Electric (BGE), to connect and manage 260,000 Itron smart streetlights across the utility's service territory, which will help reduce energy consumption and enhance the wellbeing and safety of the community. BGE will use its existing Itron multi-purpose IIoT network to connect the smart streetlights, which are expected to be deployed through 2026.

                                                    9. What pricing options are available for accessing the report?

                                                    Pricing options include single-user, multi-user, and enterprise licenses priced at USD 4750, USD 5250, and USD 8750 respectively.

                                                    10. Is the market size provided in terms of value or volume?

                                                    The market size is provided in terms of value, measured in Million.

                                                    11. Are there any specific market keywords associated with the report?

                                                    Yes, the market keyword associated with the report is "Connected Street Lighting Industry," which aids in identifying and referencing the specific market segment covered.

                                                    12. How do I determine which pricing option suits my needs best?

                                                    The pricing options vary based on user requirements and access needs. Individual users may opt for single-user licenses, while businesses requiring broader access may choose multi-user or enterprise licenses for cost-effective access to the report.

                                                    13. Are there any additional resources or data provided in the Connected Street Lighting Industry report?

                                                    While the report offers comprehensive insights, it's advisable to review the specific contents or supplementary materials provided to ascertain if additional resources or data are available.

                                                    14. How can I stay updated on further developments or reports in the Connected Street Lighting Industry?

                                                    To stay informed about further developments, trends, and reports in the Connected Street Lighting Industry, consider subscribing to industry newsletters, following relevant companies and organizations, or regularly checking reputable industry news sources and publications.


                                                    Methodology

                                                    Step 1 - Identification of Relevant Samples Size from Population Database

                                                    Step Chart
                                                    Bar Chart
                                                    Method Chart

                                                    Step 2 - Approaches for Defining Global Market Size (Value, Volume* & Price*)

                                                    Approach Chart
                                                    Top-down and bottom-up approaches are used to validate the global market size and estimate the market size for manufactures, regional segments, product, and application.

                                                    Note*: In applicable scenarios

                                                    Step 3 - Data Sources

                                                    Primary Research

                                                    • Web Analytics
                                                    • Survey Reports
                                                    • Research Institute
                                                    • Latest Research Reports
                                                    • Opinion Leaders

                                                    Secondary Research

                                                    • Annual Reports
                                                    • White Paper
                                                    • Latest Press Release
                                                    • Industry Association
                                                    • Paid Database
                                                    • Investor Presentations
                                                    Analyst Chart

                                                    Step 4 - Data Triangulation

                                                    Involves using different sources of information in order to increase the validity of a study

                                                    These sources are likely to be stakeholders in a program - participants, other researchers, program staff, other community members, and so on.

                                                    Then we put all data in single framework & apply various statistical tools to find out the dynamic on the market.

                                                    During the analysis stage, feedback from the stakeholder groups would be compared to determine areas of agreement as well as areas of divergence

                                                    Additionally, after gathering mixed and scattered data from a wide range of sources, data is triangulated and correlated to come up with estimated figures which are further validated through primary mediums or industry experts, opinion leaders.

                                                    About Report Pinnacle

                                                    Report Pinnacle provides top-tier market research, industry intelligence, and actionable insights for finance, technology, healthcare, and consumer sectors. Our reports empower you to make informed decisions and achieve business success.

                                                    Our expert team combines primary research, data analytics, and industry knowledge to deliver insights you can trust. We offer syndicated reports, custom research, and consulting services tailored to your unique business needs.

                                                    At Report Pinnacle, we are committed to quality, transparency, and client satisfaction. Every report is rigorously validated to ensure accuracy and relevance. Our global perspective and local expertise help you understand both broad trends and detailed market shifts.

                                                    Stay ahead with Report Pinnacle. Subscribe to our newsletter for the latest insights and research highlights, and follow us on social media for real-time updates.

                                                    Report Pinnacle – Your Partner for Reaching the Top in Market Intelligence.

                                                    artwork spiralartwork spiralRelated Reports
                                                    artwork underline

                                                    Cyber Security in Insurance Industry Industry Analysis and Consumer Behavior

                                                    The cybersecurity insurance market is booming, projected to reach \$16.09 billion by 2025, with a 19.72% CAGR. Learn about key drivers, trends, restraints, and leading companies shaping this rapidly evolving sector. Explore regional market share and growth projections for North America, Europe, Asia-Pacific, and more.

                                                    July 2025
                                                    Base Year: 2024
                                                    No Of Pages: 234
                                                    Price: $4750

                                                    Complex Event Processing Industry Growth Forecast and Consumer Insights

                                                    The Complex Event Processing (CEP) market is booming, projected to reach \$5.27 billion by 2025 with a 23.76% CAGR. Discover key trends, drivers, and regional insights shaping this dynamic industry, including major players and lucrative market segments like BFSI and healthcare. Explore the future of real-time data analytics.

                                                    July 2025
                                                    Base Year: 2024
                                                    No Of Pages: 234
                                                    Price: $4750

                                                    Europe Temperature Sensor Industry Market Analysis and Forecasts

                                                    The European temperature sensor market is booming, projected to reach €[Estimated Value for 2033 based on CAGR] million by 2033, driven by automation, smart technologies, and stringent regulations. Learn about key trends, leading players (Honeywell, ABB, etc.), and regional market dynamics in this comprehensive analysis.

                                                    July 2025
                                                    Base Year: 2024
                                                    No Of Pages: 234
                                                    Price: $4750

                                                    Growth Catalysts in India Optic Fiber Cable and Accessories Market Market

                                                    The India Optic Fiber Cable and Accessories Market is booming, with a projected CAGR of 14.27% through 2033. Driven by digitalization and 5G expansion, leading players like Finolex and Polycab are capitalizing on surging demand. Explore market trends, key players, and future growth potential in this comprehensive analysis.

                                                    July 2025
                                                    Base Year: 2024
                                                    No Of Pages: 197
                                                    Price: $3800

                                                    Middle East and Africa Automated Storage and Retrieval System Market Market Dynamics: Drivers and Barriers to Growth 2025-2033

                                                    Discover the booming Middle East & Africa Automated Storage and Retrieval System (AS/RS) market. This analysis reveals key drivers, trends, and restraints impacting growth through 2033, with insights into regional market share and leading companies like Murata Machinery and Kardex AG. Explore market size projections, CAGR, and segment breakdowns for informed strategic planning.

                                                    July 2025
                                                    Base Year: 2024
                                                    No Of Pages: 210
                                                    Price: $4750

                                                    Growth Trajectories in Nigeria Data Center Networking Market: Industry Outlook to 2033

                                                    The Nigeria Data Center Networking market is booming, with a projected CAGR of 21.24% (2019-2024). Discover key trends, drivers, restraints, and leading companies shaping this dynamic sector. Explore market size projections, segment analysis, and future growth opportunities in this comprehensive market report.

                                                    July 2025
                                                    Base Year: 2024
                                                    No Of Pages: 197
                                                    Price: $3800

                                                    Inertial Systems Market in Transportation Report 2025: Growth Driven by Government Incentives and Partnerships

                                                    The Inertial Systems Market in Transportation is booming, projected to reach $XX million by 2033 with a CAGR of 11.28%. Driven by autonomous vehicles, drones, and industrial automation, this report analyzes market size, growth drivers, regional trends, and key players like Bosch and Honeywell. Explore market segmentation, including IMUs and INS, and discover future opportunities.

                                                    July 2025
                                                    Base Year: 2024
                                                    No Of Pages: 197
                                                    Price: $3800

                                                    Kuwait ICT Industry 2025-2033 Market Analysis: Trends, Dynamics, and Growth Opportunities

                                                    Discover the booming Kuwait ICT market, projected to reach $X million by 2033 with a 9.84% CAGR. This in-depth analysis reveals key drivers, trends, and challenges shaping the industry, including significant investments in 5G, cloud computing, and digital transformation initiatives across key sectors. Learn about leading players and market segmentation for informed business decisions.

                                                    July 2025
                                                    Base Year: 2024
                                                    No Of Pages: 197
                                                    Price: $3800

                                                    Telecom Power Systems Industry Analysis 2025 and Forecasts 2033: Unveiling Growth Opportunities

                                                    The Telecom Power Systems market is booming, projected to reach YY million by 2033 with a 3.87% CAGR. Driven by 5G rollout and cloud adoption, this report analyzes market size, segmentation (power range, end-user application), key players (Huawei, ABB, Delta), and regional trends. Discover insights for investment and strategic planning.

                                                    July 2025
                                                    Base Year: 2024
                                                    No Of Pages: 234
                                                    Price: $4750

                                                    Strategic Planning for Thermal Imaging Systems Industry Industry Expansion

                                                    The thermal imaging systems market is booming, projected to reach [estimated 2033 market size] by 2033, driven by technological advancements and increasing demand across diverse sectors like defense, automotive, and building inspection. Explore market trends, key players, and future growth potential in this comprehensive analysis.

                                                    July 2025
                                                    Base Year: 2024
                                                    No Of Pages: 234
                                                    Price: $4750

                                                    Subscriber Data Analysis Market Market’s Evolutionary Trends 2025-2033

                                                    The Subscriber Data Management (SDM) market is booming, with a CAGR exceeding 14%! This comprehensive analysis explores market size, growth drivers (5G, cloud adoption), key players (Ericsson, Huawei, Nokia), and regional trends. Discover the latest insights and forecasts for the SDM market from 2025 to 2033.

                                                    July 2025
                                                    Base Year: 2024
                                                    No Of Pages: 234
                                                    Price: $4750

                                                    Technological Advances in US Wireless Telecom Tower Industry Market: Trends and Opportunities 2025-2033

                                                    The US wireless telecom tower industry is booming, with a projected CAGR of 4.62% through 2033. Driven by 5G deployment and IoT growth, this market analysis reveals key trends, segments (rooftop, ground-based, ownership types), major players (SBA Communications, Crown Castle, etc.), and regional variations. Discover the opportunities and challenges shaping this dynamic sector.

                                                    July 2025
                                                    Base Year: 2024
                                                    No Of Pages: 197
                                                    Price: $3800

                                                    Growth Strategies in Electronic Nose (E-Nose) Market Market: 2025-2033 Outlook

                                                    The Electronic Nose (E-Nose) market is booming, projected to reach [estimated 2033 market size in millions] by 2033, with a CAGR of 14.17%. Discover key trends, drivers, and leading companies shaping this rapidly expanding industry across healthcare, food safety, and environmental monitoring.

                                                    July 2025
                                                    Base Year: 2024
                                                    No Of Pages: 234
                                                    Price: $4750

                                                    APAC Warehouse Automation Industry Competitive Advantage: Trends and Opportunities to 2033

                                                    The APAC warehouse automation market is booming, projected to reach $43.6 billion by 2033 with a 17.3% CAGR. Discover key trends, drivers, and regional insights in this in-depth market analysis, including the roles of China, India, and Japan, and the impact of AI and IoT on future growth. Explore leading companies and investment opportunities.

                                                    July 2025
                                                    Base Year: 2024
                                                    No Of Pages: 210
                                                    Price: $4750

                                                    Europe MLCC Market CAGR Growth Drivers and Trends: Forecasts 2025-2033

                                                    Discover the booming European MLCC market forecast to 2033! This comprehensive analysis reveals key drivers, trends, and market segmentation, including data on capacitance, mounting type, and end-user applications across major European countries. Explore growth opportunities and leading players shaping this dynamic sector.

                                                    July 2025
                                                    Base Year: 2024
                                                    No Of Pages: 197
                                                    Price: $3800

                                                    Application Delivery Network Industry Industry Insights and Forecasts

                                                    The Application Delivery Network (ADN) market is booming, projected to reach \$8.67B in 2025 with a 10.92% CAGR. Discover key drivers, trends, and restraints shaping this dynamic sector, including cloud adoption, cybersecurity concerns, and leading companies like Radware and F5 Networks. Explore regional market shares and future growth projections in this in-depth analysis.

                                                    July 2025
                                                    Base Year: 2024
                                                    No Of Pages: 234
                                                    Price: $4750

                                                    Exploring Image Sensors for Security Application Industry Market Evolution 2025-2033

                                                    The Image Sensor for Security Applications market is booming, with an 8.83% CAGR projected to 2033. Driven by AI, smart cities, and rising demand for surveillance, this report analyzes market size, key players (Sony, Canon, OmniVision), regional trends, and growth opportunities in consumer, commercial, and infrastructure segments.

                                                    July 2025
                                                    Base Year: 2024
                                                    No Of Pages: 234
                                                    Price: $4750

                                                    Overcoming Challenges in Hyperspectral Imaging Market Market: Strategic Insights 2025-2033

                                                    The hyperspectral imaging market is booming, projected to reach \$226.08 million in 2025, with a CAGR of 15.46% through 2033. Driven by advancements in technology and increasing applications across food & agriculture, healthcare, and defense, this detailed market analysis explores key trends, restraints, and leading companies.

                                                    July 2025
                                                    Base Year: 2024
                                                    No Of Pages: 234
                                                    Price: $4750

                                                    Animation And VFX Market Analysis Report 2025: Market to Grow by a CAGR of XX to 2033, Driven by Government Incentives, Popularity of Virtual Assistants, and Strategic Partnerships

                                                    The Animation & VFX market is booming, projected to reach [estimated 2033 value based on CAGR] by 2033, driven by OTT growth, gaming, and advertising. Explore market trends, key players (Adobe, Autodesk, etc.), and regional insights in this comprehensive analysis.

                                                    July 2025
                                                    Base Year: 2024
                                                    No Of Pages: 234
                                                    Price: $4750

                                                    Southeast Asia Telematics Market Is Set To Reach XXX Million By 2033, Growing At A CAGR Of XX

                                                    Discover the booming Southeast Asia telematics market! This report reveals key trends, drivers, and restraints impacting growth through 2033, including insights into regional market share (Thailand, Indonesia, Malaysia) and leading companies. Explore the CAGR, market segmentation by vehicle type (LCV, M/HCV), and future opportunities in this dynamic sector.

                                                    July 2025
                                                    Base Year: 2024
                                                    No Of Pages: 210
                                                    Price: $4750
                                                    • Home
                                                    • About Us
                                                    • Industries
                                                      • Aerospace & Defense
                                                      • Agriculture
                                                      • Animal Nutrition & Wellness
                                                      • Automotive
                                                      • Chemicals & Materials
                                                      • Consumer Goods and Services
                                                      • Energy & Power
                                                      • Financial Services and Investment Intelligence
                                                      • Food & Beverage
                                                      • Home and Property Improvement
                                                      • Hospitality and Tourism
                                                      • Logistics
                                                      • Manufacturing Products and Services
                                                      • Packaging
                                                      • Professional and Commercial Services
                                                      • Real Estate and Construction
                                                      • Retail
                                                      • Technology, Media and Telecom
                                                      • Healthcare
                                                    • Services
                                                    • Contact
                                                    Main Logo
                                                    • Home
                                                    • About Us
                                                    • Industries
                                                      • Aerospace & Defense
                                                      • Agriculture
                                                      • Animal Nutrition & Wellness
                                                      • Automotive
                                                      • Chemicals & Materials
                                                      • Consumer Goods and Services
                                                      • Energy & Power
                                                      • Financial Services and Investment Intelligence
                                                      • Food & Beverage
                                                      • Home and Property Improvement
                                                      • Hospitality and Tourism
                                                      • Logistics
                                                      • Manufacturing Products and Services
                                                      • Packaging
                                                      • Professional and Commercial Services
                                                      • Real Estate and Construction
                                                      • Retail
                                                      • Technology, Media and Telecom
                                                      • Healthcare
                                                    • Services
                                                    • Contact
                                                    +17162654855
                                                    [email protected]

                                                    +17162654855

                                                    [email protected]

                                                    Business Address

                                                    Head Office

                                                    Office no. A 5010, fifth floor, Solitaire Business Hub, Near Phoenix mall, Pune, Maharashtra 411014

                                                    Contact Information

                                                    Craig Francis

                                                    Business Development Head

                                                    +17162654855

                                                    [email protected]

                                                    Connect With Us

                                                    Secure Payment Partners

                                                    payment image
                                                    RetailLogisticsPackagingAutomotiveHealthcareAgricultureEnergy & PowerFood & BeverageAerospace & DefenseChemicals & MaterialsHospitality and TourismAnimal Nutrition & WellnessConsumer Goods and ServicesReal Estate and ConstructionHome and Property ImprovementTechnology, Media and TelecomManufacturing Products and ServicesFinancial Services and Investment Intelligence

                                                    © 2025 All rights reserved


                                                    Privacy Policy
                                                    Terms and Conditions
                                                    FAQ