
Key Insights
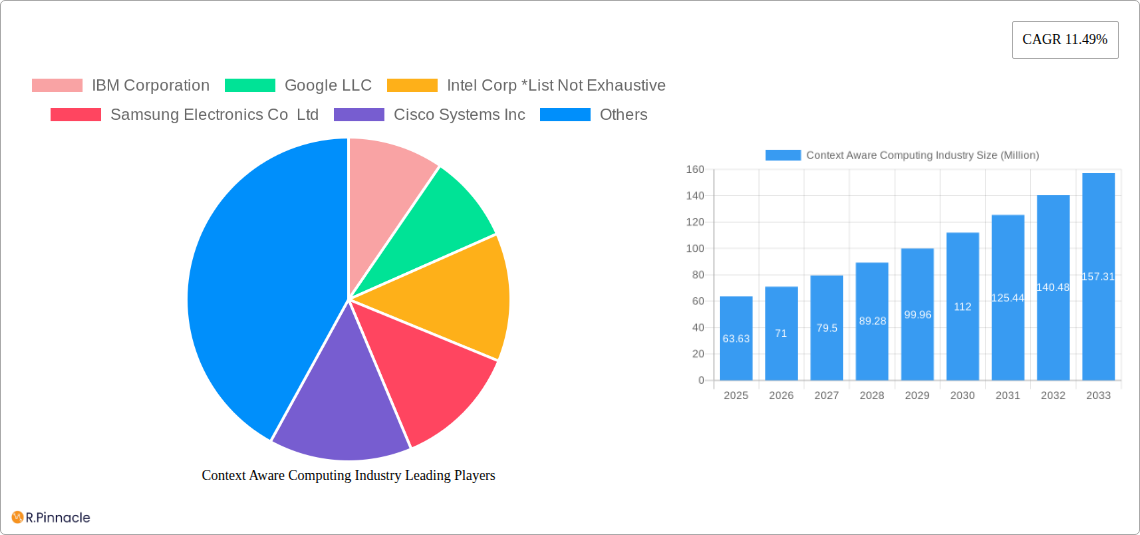
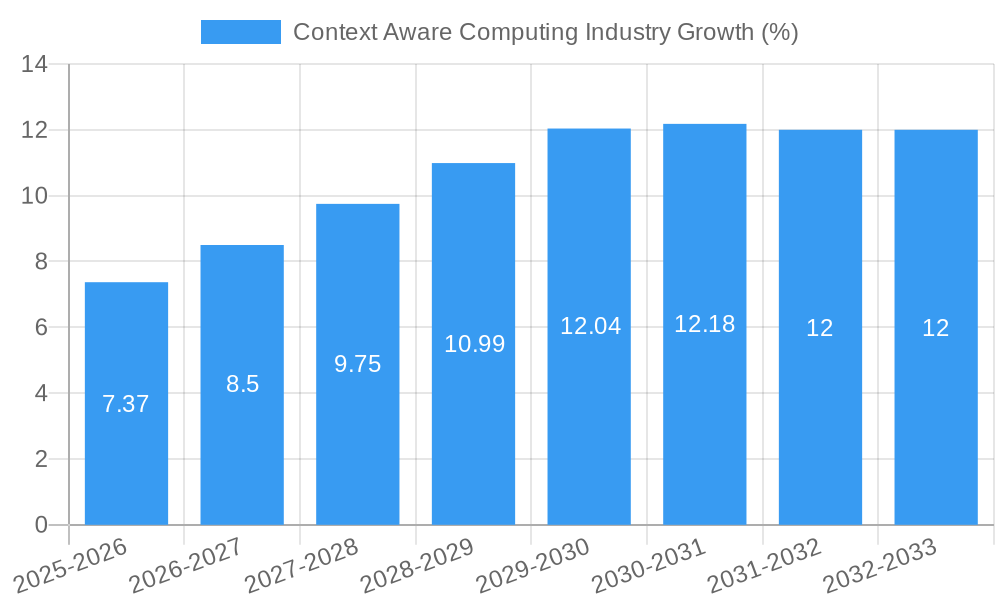
The Context Aware Computing market is experiencing robust growth, projected to reach a substantial size driven by several key factors. The market, valued at $63.63 million in 2025, is poised for significant expansion, exhibiting a Compound Annual Growth Rate (CAGR) of 11.49% from 2025 to 2033. This growth is fueled by the increasing adoption of sophisticated technologies like IoT (Internet of Things), AI (Artificial Intelligence), and Big Data analytics across various sectors. The BFSI (Banking, Financial Services, and Insurance) sector, along with Consumer Electronics, Media and Entertainment, and Automotive industries, are major contributors to this market expansion. The ability of context-aware computing to personalize user experiences, optimize resource allocation, and enhance operational efficiency is driving adoption. Furthermore, the continuous innovation in hardware, software, and services supporting context-aware applications contributes to its escalating market value. The emergence of new applications in healthcare and logistics further fuels market growth. Significant players like IBM, Google, Intel, Samsung, and Cisco are actively shaping this market through continuous R&D and strategic partnerships. While challenges such as data privacy concerns and high implementation costs exist, the overall market trajectory remains positive, indicating promising opportunities for both established and emerging players.
The geographical distribution of the market showcases a varied growth pattern across regions. North America, driven by technological advancements and early adoption, holds a significant market share. Europe follows closely, with strong government initiatives and private sector investments fueling market growth. Asia Pacific, particularly China and India, exhibits high growth potential, owing to rising smartphone penetration and digitalization. The market in other regions, including South America and the Middle East & Africa, is expected to witness moderate growth, driven by increasing infrastructure development and growing digital literacy. The diverse segments within the market—hardware, software, services—present unique opportunities. The vendor landscape is also competitive, with device manufacturers, mobile network operators, and online vendors playing key roles. This diversified landscape underscores the dynamic nature of this rapidly evolving market and its potential for substantial growth throughout the forecast period.
Context Aware Computing Industry Market Report: 2019-2033
This comprehensive report provides an in-depth analysis of the Context Aware Computing industry, projecting a market value exceeding $XX Million by 2033. The study covers the period 2019-2033, with 2025 as the base and estimated year. This report is essential for industry professionals, investors, and strategists seeking actionable insights into this rapidly evolving sector.
Context Aware Computing Industry Market Structure & Innovation Trends
The Context Aware Computing market exhibits a moderately concentrated structure, with key players like IBM Corporation, Google LLC, Intel Corp, Samsung Electronics Co Ltd, Cisco Systems Inc, Verizon Communications Inc, Microsoft Corporation, Amazon Web Services Inc, and Oracle Corporation holding significant market share. However, the presence of numerous smaller players fosters competition. The market's innovation is driven by advancements in AI, machine learning, and 5G technologies, constantly pushing the boundaries of personalized user experiences. Regulatory frameworks surrounding data privacy and security significantly impact market dynamics. Product substitutes, such as traditional computing systems, pose a competitive challenge, although the unique capabilities of context-aware computing are driving its adoption. The end-user demographic is expanding across various sectors, fueled by increasing digitalization. M&A activity within the sector is robust, with deal values exceeding $XX Million in recent years, signifying strategic expansion and consolidation. For example, the recent collaboration between T-Mobile and Cisco demonstrates a major investment in cloud-native infrastructure, strengthening market leadership. Market share estimates for major players are unavailable at this time and will be incorporated into the final report.
Context Aware Computing Industry Market Dynamics & Trends
The Context Aware Computing market is experiencing robust growth, projected at a Compound Annual Growth Rate (CAGR) of XX% during the forecast period (2025-2033). Key growth drivers include the rising demand for personalized user experiences, the proliferation of smart devices, and the expansion of 5G networks. Technological disruptions, such as advancements in AI and edge computing, are accelerating innovation and expanding market applications. Consumer preferences for seamless and intuitive digital experiences are fueling demand. Competitive dynamics are characterized by intense innovation, strategic partnerships, and M&A activities among leading players. Market penetration is high in developed economies, with significant growth potential in emerging markets.
Dominant Regions & Segments in Context Aware Computing Industry
North America currently dominates the Context Aware Computing market, driven by strong technological advancements, high digital adoption rates, and robust investment in R&D. However, the Asia-Pacific region is poised for rapid growth owing to increasing smartphone penetration and burgeoning digital economies.
- Key Drivers in North America: Strong technological infrastructure, high consumer spending, supportive government policies.
- Key Drivers in Asia-Pacific: Rapid urbanization, rising disposable incomes, government initiatives promoting digitalization.
Dominant Segments:
The Software segment holds a significant market share due to the increasing demand for intelligent applications and platforms enabling context-aware functionality. The Device Manufacturers segment is crucial for hardware innovation, pushing the limits of contextual computing capabilities. Mobile Network Operators play a vital role in providing the necessary infrastructure for connectivity and data transmission.
Context Aware Computing Industry Product Innovations
Recent product innovations focus on enhancing personalization, improving user experience through seamless integration of data, and developing advanced analytics for optimizing context-aware applications. Technological trends include advancements in AI, machine learning, and edge computing, improving real-time responsiveness and efficiency. These innovations are enhancing market fit by addressing specific end-user needs across various sectors, from BFSI to healthcare.
Report Scope & Segmentation Analysis
This report comprehensively segments the Context Aware Computing market by:
Type: Hardware, Software, Services. The Software segment is predicted to exhibit the highest CAGR due to growing demand for advanced applications. Hardware is expected to witness steady growth driven by the expansion of compatible devices. Services will see growth due to increasing needs for integration and customization.
Vendor: Device Manufacturers, Mobile Network Operators, Online, Web, and Social Networking Vendors. Device manufacturers are central to hardware innovation, driving market growth through continuous product improvements. Mobile network operators are vital for connectivity and data infrastructure. Online, web, and social networking vendors are developing and deploying context-aware applications and services.
End-user Industry: BFSI, Consumer Electronics, Media and Entertainment, Automotive, Healthcare, Telecommunication, Logistics and Transportation, Other End-user Industries. BFSI and Healthcare are expected to exhibit strong growth due to the increased need for personalized and secure services. Consumer electronics will continue to adopt context-aware features for enhanced user experience. Automotive and Telecommunication will also experience notable growth.
Each segment's growth projections, market size estimates, and competitive dynamics are detailed in the full report.
Key Drivers of Context Aware Computing Industry Growth
Several factors fuel the Context Aware Computing market's growth: advancements in artificial intelligence and machine learning, leading to more sophisticated applications; the proliferation of smart devices and IoT adoption; and increasing demand for personalized and intuitive digital experiences. Government support for digital infrastructure development also contributes to market expansion. 5G network rollouts are creating a foundation for higher bandwidth and lower latency, essential for context-aware solutions.
Challenges in the Context Aware Computing Industry Sector
The industry faces challenges, including the complexity of integrating diverse data sources, data privacy and security concerns, and the need for robust cybersecurity measures to prevent data breaches. Supply chain disruptions, impacting the availability of essential components, can also hinder growth. Competitive pressure from established technology companies and emerging startups necessitates continuous innovation to maintain market share.
Emerging Opportunities in Context Aware Computing Industry
The industry presents exciting opportunities: expansion into new markets, especially in developing economies; the integration of context-aware technologies in emerging sectors like smart cities and industrial IoT; and growing demand for customized and secure applications addressing specific industry needs. These developments promise significant market expansion and technological innovation.
Leading Players in the Context Aware Computing Industry Market
- IBM Corporation
- Google LLC
- Intel Corp
- Samsung Electronics Co Ltd
- Cisco Systems Inc
- Verizon Communications Inc
- Microsoft Corporation
- Amazon Web Services Inc
- Oracle Corporation
Key Developments in Context Aware Computing Industry
December 2022: T-Mobile and Cisco launched a nationwide cloud-native converged core gateway, improving customer performance by more than 10% and accelerating the rollout of new 5G and IoT services. This demonstrates the growing adoption of cloud-native technologies in the telecom industry.
November 2022: TCS and AWS launched a quantum computing lab, highlighting the potential of quantum computing in advancing AI, optimization, and digital security. This indicates the exploration of novel computing paradigms for future context-aware systems.
Future Outlook for Context Aware Computing Industry Market
The Context Aware Computing market exhibits immense growth potential. Continued advancements in AI, machine learning, and 5G technologies, coupled with increasing adoption across various industries, will drive significant market expansion. Strategic partnerships and investments in R&D will further accelerate market growth, offering lucrative opportunities for businesses to capitalize on this transformative technology.
Context Aware Computing Industry Segmentation
-
1. Type
- 1.1. Hardware
- 1.2. Software
- 1.3. Services
-
2. Vendor (Qualitative Analysis)
- 2.1. Device Manufacturers
- 2.2. Mobile Network Operators
- 2.3. Online, Web, and Social Networking Vendors
-
3. End-user Industry
- 3.1. BFSI
- 3.2. Consumer Electronics
- 3.3. Media and Entertainment
- 3.4. Automotive
- 3.5. Healthcare
- 3.6. Telecommunication
- 3.7. Logistics and Transportation
- 3.8. Other End-user Industries
Context Aware Computing Industry Segmentation By Geography
- 1. North America
- 2. Europe
- 3. Asia Pacific
- 4. Latin America
- 5. Middle East and Africa

Context Aware Computing Industry REPORT HIGHLIGHTS
| Aspects | Details |
|---|---|
| Study Period | 2019-2033 |
| Base Year | 2024 |
| Estimated Year | 2025 |
| Forecast Period | 2025-2033 |
| Historical Period | 2019-2024 |
| Growth Rate | CAGR of 11.49% from 2019-2033 |
| Segmentation |
|
Table of Contents
- 1. Introduction
- 1.1. Research Scope
- 1.2. Market Segmentation
- 1.3. Research Methodology
- 1.4. Definitions and Assumptions
- 2. Executive Summary
- 2.1. Introduction
- 3. Market Dynamics
- 3.1. Introduction
- 3.2. Market Drivers
- 3.2.1. Integration of Artificial Intelligence into Mobile Apps; Rise in Integrated IoT Offerings
- 3.3. Market Restrains
- 3.3.1. Computational Complexities
- 3.4. Market Trends
- 3.4.1. Consumer Electronics Segment is Expected to Witness Significant Growth
- 4. Market Factor Analysis
- 4.1. Porters Five Forces
- 4.2. Supply/Value Chain
- 4.3. PESTEL analysis
- 4.4. Market Entropy
- 4.5. Patent/Trademark Analysis
- 5. Global Context Aware Computing Industry Analysis, Insights and Forecast, 2019-2031
- 5.1. Market Analysis, Insights and Forecast - by Type
- 5.1.1. Hardware
- 5.1.2. Software
- 5.1.3. Services
- 5.2. Market Analysis, Insights and Forecast - by Vendor (Qualitative Analysis)
- 5.2.1. Device Manufacturers
- 5.2.2. Mobile Network Operators
- 5.2.3. Online, Web, and Social Networking Vendors
- 5.3. Market Analysis, Insights and Forecast - by End-user Industry
- 5.3.1. BFSI
- 5.3.2. Consumer Electronics
- 5.3.3. Media and Entertainment
- 5.3.4. Automotive
- 5.3.5. Healthcare
- 5.3.6. Telecommunication
- 5.3.7. Logistics and Transportation
- 5.3.8. Other End-user Industries
- 5.4. Market Analysis, Insights and Forecast - by Region
- 5.4.1. North America
- 5.4.2. Europe
- 5.4.3. Asia Pacific
- 5.4.4. Latin America
- 5.4.5. Middle East and Africa
- 5.1. Market Analysis, Insights and Forecast - by Type
- 6. North America Context Aware Computing Industry Analysis, Insights and Forecast, 2019-2031
- 6.1. Market Analysis, Insights and Forecast - by Type
- 6.1.1. Hardware
- 6.1.2. Software
- 6.1.3. Services
- 6.2. Market Analysis, Insights and Forecast - by Vendor (Qualitative Analysis)
- 6.2.1. Device Manufacturers
- 6.2.2. Mobile Network Operators
- 6.2.3. Online, Web, and Social Networking Vendors
- 6.3. Market Analysis, Insights and Forecast - by End-user Industry
- 6.3.1. BFSI
- 6.3.2. Consumer Electronics
- 6.3.3. Media and Entertainment
- 6.3.4. Automotive
- 6.3.5. Healthcare
- 6.3.6. Telecommunication
- 6.3.7. Logistics and Transportation
- 6.3.8. Other End-user Industries
- 6.1. Market Analysis, Insights and Forecast - by Type
- 7. Europe Context Aware Computing Industry Analysis, Insights and Forecast, 2019-2031
- 7.1. Market Analysis, Insights and Forecast - by Type
- 7.1.1. Hardware
- 7.1.2. Software
- 7.1.3. Services
- 7.2. Market Analysis, Insights and Forecast - by Vendor (Qualitative Analysis)
- 7.2.1. Device Manufacturers
- 7.2.2. Mobile Network Operators
- 7.2.3. Online, Web, and Social Networking Vendors
- 7.3. Market Analysis, Insights and Forecast - by End-user Industry
- 7.3.1. BFSI
- 7.3.2. Consumer Electronics
- 7.3.3. Media and Entertainment
- 7.3.4. Automotive
- 7.3.5. Healthcare
- 7.3.6. Telecommunication
- 7.3.7. Logistics and Transportation
- 7.3.8. Other End-user Industries
- 7.1. Market Analysis, Insights and Forecast - by Type
- 8. Asia Pacific Context Aware Computing Industry Analysis, Insights and Forecast, 2019-2031
- 8.1. Market Analysis, Insights and Forecast - by Type
- 8.1.1. Hardware
- 8.1.2. Software
- 8.1.3. Services
- 8.2. Market Analysis, Insights and Forecast - by Vendor (Qualitative Analysis)
- 8.2.1. Device Manufacturers
- 8.2.2. Mobile Network Operators
- 8.2.3. Online, Web, and Social Networking Vendors
- 8.3. Market Analysis, Insights and Forecast - by End-user Industry
- 8.3.1. BFSI
- 8.3.2. Consumer Electronics
- 8.3.3. Media and Entertainment
- 8.3.4. Automotive
- 8.3.5. Healthcare
- 8.3.6. Telecommunication
- 8.3.7. Logistics and Transportation
- 8.3.8. Other End-user Industries
- 8.1. Market Analysis, Insights and Forecast - by Type
- 9. Latin America Context Aware Computing Industry Analysis, Insights and Forecast, 2019-2031
- 9.1. Market Analysis, Insights and Forecast - by Type
- 9.1.1. Hardware
- 9.1.2. Software
- 9.1.3. Services
- 9.2. Market Analysis, Insights and Forecast - by Vendor (Qualitative Analysis)
- 9.2.1. Device Manufacturers
- 9.2.2. Mobile Network Operators
- 9.2.3. Online, Web, and Social Networking Vendors
- 9.3. Market Analysis, Insights and Forecast - by End-user Industry
- 9.3.1. BFSI
- 9.3.2. Consumer Electronics
- 9.3.3. Media and Entertainment
- 9.3.4. Automotive
- 9.3.5. Healthcare
- 9.3.6. Telecommunication
- 9.3.7. Logistics and Transportation
- 9.3.8. Other End-user Industries
- 9.1. Market Analysis, Insights and Forecast - by Type
- 10. Middle East and Africa Context Aware Computing Industry Analysis, Insights and Forecast, 2019-2031
- 10.1. Market Analysis, Insights and Forecast - by Type
- 10.1.1. Hardware
- 10.1.2. Software
- 10.1.3. Services
- 10.2. Market Analysis, Insights and Forecast - by Vendor (Qualitative Analysis)
- 10.2.1. Device Manufacturers
- 10.2.2. Mobile Network Operators
- 10.2.3. Online, Web, and Social Networking Vendors
- 10.3. Market Analysis, Insights and Forecast - by End-user Industry
- 10.3.1. BFSI
- 10.3.2. Consumer Electronics
- 10.3.3. Media and Entertainment
- 10.3.4. Automotive
- 10.3.5. Healthcare
- 10.3.6. Telecommunication
- 10.3.7. Logistics and Transportation
- 10.3.8. Other End-user Industries
- 10.1. Market Analysis, Insights and Forecast - by Type
- 11. North America Context Aware Computing Industry Analysis, Insights and Forecast, 2019-2031
- 11.1. Market Analysis, Insights and Forecast - By Country/Sub-region
- 11.1.1 United States
- 11.1.2 Canada
- 11.1.3 Mexico
- 12. Europe Context Aware Computing Industry Analysis, Insights and Forecast, 2019-2031
- 12.1. Market Analysis, Insights and Forecast - By Country/Sub-region
- 12.1.1 Germany
- 12.1.2 United Kingdom
- 12.1.3 France
- 12.1.4 Spain
- 12.1.5 Italy
- 12.1.6 Spain
- 12.1.7 Belgium
- 12.1.8 Netherland
- 12.1.9 Nordics
- 12.1.10 Rest of Europe
- 13. Asia Pacific Context Aware Computing Industry Analysis, Insights and Forecast, 2019-2031
- 13.1. Market Analysis, Insights and Forecast - By Country/Sub-region
- 13.1.1 China
- 13.1.2 Japan
- 13.1.3 India
- 13.1.4 South Korea
- 13.1.5 Southeast Asia
- 13.1.6 Australia
- 13.1.7 Indonesia
- 13.1.8 Phillipes
- 13.1.9 Singapore
- 13.1.10 Thailandc
- 13.1.11 Rest of Asia Pacific
- 14. South America Context Aware Computing Industry Analysis, Insights and Forecast, 2019-2031
- 14.1. Market Analysis, Insights and Forecast - By Country/Sub-region
- 14.1.1 Brazil
- 14.1.2 Argentina
- 14.1.3 Peru
- 14.1.4 Chile
- 14.1.5 Colombia
- 14.1.6 Ecuador
- 14.1.7 Venezuela
- 14.1.8 Rest of South America
- 15. North America Context Aware Computing Industry Analysis, Insights and Forecast, 2019-2031
- 15.1. Market Analysis, Insights and Forecast - By Country/Sub-region
- 15.1.1 United States
- 15.1.2 Canada
- 15.1.3 Mexico
- 16. MEA Context Aware Computing Industry Analysis, Insights and Forecast, 2019-2031
- 16.1. Market Analysis, Insights and Forecast - By Country/Sub-region
- 16.1.1 United Arab Emirates
- 16.1.2 Saudi Arabia
- 16.1.3 South Africa
- 16.1.4 Rest of Middle East and Africa
- 17. Competitive Analysis
- 17.1. Global Market Share Analysis 2024
- 17.2. Company Profiles
- 17.2.1 IBM Corporation
- 17.2.1.1. Overview
- 17.2.1.2. Products
- 17.2.1.3. SWOT Analysis
- 17.2.1.4. Recent Developments
- 17.2.1.5. Financials (Based on Availability)
- 17.2.2 Google LLC
- 17.2.2.1. Overview
- 17.2.2.2. Products
- 17.2.2.3. SWOT Analysis
- 17.2.2.4. Recent Developments
- 17.2.2.5. Financials (Based on Availability)
- 17.2.3 Intel Corp *List Not Exhaustive
- 17.2.3.1. Overview
- 17.2.3.2. Products
- 17.2.3.3. SWOT Analysis
- 17.2.3.4. Recent Developments
- 17.2.3.5. Financials (Based on Availability)
- 17.2.4 Samsung Electronics Co Ltd
- 17.2.4.1. Overview
- 17.2.4.2. Products
- 17.2.4.3. SWOT Analysis
- 17.2.4.4. Recent Developments
- 17.2.4.5. Financials (Based on Availability)
- 17.2.5 Cisco Systems Inc
- 17.2.5.1. Overview
- 17.2.5.2. Products
- 17.2.5.3. SWOT Analysis
- 17.2.5.4. Recent Developments
- 17.2.5.5. Financials (Based on Availability)
- 17.2.6 Verizon Communications Inc
- 17.2.6.1. Overview
- 17.2.6.2. Products
- 17.2.6.3. SWOT Analysis
- 17.2.6.4. Recent Developments
- 17.2.6.5. Financials (Based on Availability)
- 17.2.7 Microsoft Corporation
- 17.2.7.1. Overview
- 17.2.7.2. Products
- 17.2.7.3. SWOT Analysis
- 17.2.7.4. Recent Developments
- 17.2.7.5. Financials (Based on Availability)
- 17.2.8 Amazon Web Services Inc
- 17.2.8.1. Overview
- 17.2.8.2. Products
- 17.2.8.3. SWOT Analysis
- 17.2.8.4. Recent Developments
- 17.2.8.5. Financials (Based on Availability)
- 17.2.9 Oracle Corporation
- 17.2.9.1. Overview
- 17.2.9.2. Products
- 17.2.9.3. SWOT Analysis
- 17.2.9.4. Recent Developments
- 17.2.9.5. Financials (Based on Availability)
- 17.2.1 IBM Corporation
List of Figures
- Figure 1: Global Context Aware Computing Industry Revenue Breakdown (Million, %) by Region 2024 & 2032
- Figure 2: North America Context Aware Computing Industry Revenue (Million), by Country 2024 & 2032
- Figure 3: North America Context Aware Computing Industry Revenue Share (%), by Country 2024 & 2032
- Figure 4: Europe Context Aware Computing Industry Revenue (Million), by Country 2024 & 2032
- Figure 5: Europe Context Aware Computing Industry Revenue Share (%), by Country 2024 & 2032
- Figure 6: Asia Pacific Context Aware Computing Industry Revenue (Million), by Country 2024 & 2032
- Figure 7: Asia Pacific Context Aware Computing Industry Revenue Share (%), by Country 2024 & 2032
- Figure 8: South America Context Aware Computing Industry Revenue (Million), by Country 2024 & 2032
- Figure 9: South America Context Aware Computing Industry Revenue Share (%), by Country 2024 & 2032
- Figure 10: North America Context Aware Computing Industry Revenue (Million), by Country 2024 & 2032
- Figure 11: North America Context Aware Computing Industry Revenue Share (%), by Country 2024 & 2032
- Figure 12: MEA Context Aware Computing Industry Revenue (Million), by Country 2024 & 2032
- Figure 13: MEA Context Aware Computing Industry Revenue Share (%), by Country 2024 & 2032
- Figure 14: North America Context Aware Computing Industry Revenue (Million), by Type 2024 & 2032
- Figure 15: North America Context Aware Computing Industry Revenue Share (%), by Type 2024 & 2032
- Figure 16: North America Context Aware Computing Industry Revenue (Million), by Vendor (Qualitative Analysis) 2024 & 2032
- Figure 17: North America Context Aware Computing Industry Revenue Share (%), by Vendor (Qualitative Analysis) 2024 & 2032
- Figure 18: North America Context Aware Computing Industry Revenue (Million), by End-user Industry 2024 & 2032
- Figure 19: North America Context Aware Computing Industry Revenue Share (%), by End-user Industry 2024 & 2032
- Figure 20: North America Context Aware Computing Industry Revenue (Million), by Country 2024 & 2032
- Figure 21: North America Context Aware Computing Industry Revenue Share (%), by Country 2024 & 2032
- Figure 22: Europe Context Aware Computing Industry Revenue (Million), by Type 2024 & 2032
- Figure 23: Europe Context Aware Computing Industry Revenue Share (%), by Type 2024 & 2032
- Figure 24: Europe Context Aware Computing Industry Revenue (Million), by Vendor (Qualitative Analysis) 2024 & 2032
- Figure 25: Europe Context Aware Computing Industry Revenue Share (%), by Vendor (Qualitative Analysis) 2024 & 2032
- Figure 26: Europe Context Aware Computing Industry Revenue (Million), by End-user Industry 2024 & 2032
- Figure 27: Europe Context Aware Computing Industry Revenue Share (%), by End-user Industry 2024 & 2032
- Figure 28: Europe Context Aware Computing Industry Revenue (Million), by Country 2024 & 2032
- Figure 29: Europe Context Aware Computing Industry Revenue Share (%), by Country 2024 & 2032
- Figure 30: Asia Pacific Context Aware Computing Industry Revenue (Million), by Type 2024 & 2032
- Figure 31: Asia Pacific Context Aware Computing Industry Revenue Share (%), by Type 2024 & 2032
- Figure 32: Asia Pacific Context Aware Computing Industry Revenue (Million), by Vendor (Qualitative Analysis) 2024 & 2032
- Figure 33: Asia Pacific Context Aware Computing Industry Revenue Share (%), by Vendor (Qualitative Analysis) 2024 & 2032
- Figure 34: Asia Pacific Context Aware Computing Industry Revenue (Million), by End-user Industry 2024 & 2032
- Figure 35: Asia Pacific Context Aware Computing Industry Revenue Share (%), by End-user Industry 2024 & 2032
- Figure 36: Asia Pacific Context Aware Computing Industry Revenue (Million), by Country 2024 & 2032
- Figure 37: Asia Pacific Context Aware Computing Industry Revenue Share (%), by Country 2024 & 2032
- Figure 38: Latin America Context Aware Computing Industry Revenue (Million), by Type 2024 & 2032
- Figure 39: Latin America Context Aware Computing Industry Revenue Share (%), by Type 2024 & 2032
- Figure 40: Latin America Context Aware Computing Industry Revenue (Million), by Vendor (Qualitative Analysis) 2024 & 2032
- Figure 41: Latin America Context Aware Computing Industry Revenue Share (%), by Vendor (Qualitative Analysis) 2024 & 2032
- Figure 42: Latin America Context Aware Computing Industry Revenue (Million), by End-user Industry 2024 & 2032
- Figure 43: Latin America Context Aware Computing Industry Revenue Share (%), by End-user Industry 2024 & 2032
- Figure 44: Latin America Context Aware Computing Industry Revenue (Million), by Country 2024 & 2032
- Figure 45: Latin America Context Aware Computing Industry Revenue Share (%), by Country 2024 & 2032
- Figure 46: Middle East and Africa Context Aware Computing Industry Revenue (Million), by Type 2024 & 2032
- Figure 47: Middle East and Africa Context Aware Computing Industry Revenue Share (%), by Type 2024 & 2032
- Figure 48: Middle East and Africa Context Aware Computing Industry Revenue (Million), by Vendor (Qualitative Analysis) 2024 & 2032
- Figure 49: Middle East and Africa Context Aware Computing Industry Revenue Share (%), by Vendor (Qualitative Analysis) 2024 & 2032
- Figure 50: Middle East and Africa Context Aware Computing Industry Revenue (Million), by End-user Industry 2024 & 2032
- Figure 51: Middle East and Africa Context Aware Computing Industry Revenue Share (%), by End-user Industry 2024 & 2032
- Figure 52: Middle East and Africa Context Aware Computing Industry Revenue (Million), by Country 2024 & 2032
- Figure 53: Middle East and Africa Context Aware Computing Industry Revenue Share (%), by Country 2024 & 2032
List of Tables
- Table 1: Global Context Aware Computing Industry Revenue Million Forecast, by Region 2019 & 2032
- Table 2: Global Context Aware Computing Industry Revenue Million Forecast, by Type 2019 & 2032
- Table 3: Global Context Aware Computing Industry Revenue Million Forecast, by Vendor (Qualitative Analysis) 2019 & 2032
- Table 4: Global Context Aware Computing Industry Revenue Million Forecast, by End-user Industry 2019 & 2032
- Table 5: Global Context Aware Computing Industry Revenue Million Forecast, by Region 2019 & 2032
- Table 6: Global Context Aware Computing Industry Revenue Million Forecast, by Country 2019 & 2032
- Table 7: United States Context Aware Computing Industry Revenue (Million) Forecast, by Application 2019 & 2032
- Table 8: Canada Context Aware Computing Industry Revenue (Million) Forecast, by Application 2019 & 2032
- Table 9: Mexico Context Aware Computing Industry Revenue (Million) Forecast, by Application 2019 & 2032
- Table 10: Global Context Aware Computing Industry Revenue Million Forecast, by Country 2019 & 2032
- Table 11: Germany Context Aware Computing Industry Revenue (Million) Forecast, by Application 2019 & 2032
- Table 12: United Kingdom Context Aware Computing Industry Revenue (Million) Forecast, by Application 2019 & 2032
- Table 13: France Context Aware Computing Industry Revenue (Million) Forecast, by Application 2019 & 2032
- Table 14: Spain Context Aware Computing Industry Revenue (Million) Forecast, by Application 2019 & 2032
- Table 15: Italy Context Aware Computing Industry Revenue (Million) Forecast, by Application 2019 & 2032
- Table 16: Spain Context Aware Computing Industry Revenue (Million) Forecast, by Application 2019 & 2032
- Table 17: Belgium Context Aware Computing Industry Revenue (Million) Forecast, by Application 2019 & 2032
- Table 18: Netherland Context Aware Computing Industry Revenue (Million) Forecast, by Application 2019 & 2032
- Table 19: Nordics Context Aware Computing Industry Revenue (Million) Forecast, by Application 2019 & 2032
- Table 20: Rest of Europe Context Aware Computing Industry Revenue (Million) Forecast, by Application 2019 & 2032
- Table 21: Global Context Aware Computing Industry Revenue Million Forecast, by Country 2019 & 2032
- Table 22: China Context Aware Computing Industry Revenue (Million) Forecast, by Application 2019 & 2032
- Table 23: Japan Context Aware Computing Industry Revenue (Million) Forecast, by Application 2019 & 2032
- Table 24: India Context Aware Computing Industry Revenue (Million) Forecast, by Application 2019 & 2032
- Table 25: South Korea Context Aware Computing Industry Revenue (Million) Forecast, by Application 2019 & 2032
- Table 26: Southeast Asia Context Aware Computing Industry Revenue (Million) Forecast, by Application 2019 & 2032
- Table 27: Australia Context Aware Computing Industry Revenue (Million) Forecast, by Application 2019 & 2032
- Table 28: Indonesia Context Aware Computing Industry Revenue (Million) Forecast, by Application 2019 & 2032
- Table 29: Phillipes Context Aware Computing Industry Revenue (Million) Forecast, by Application 2019 & 2032
- Table 30: Singapore Context Aware Computing Industry Revenue (Million) Forecast, by Application 2019 & 2032
- Table 31: Thailandc Context Aware Computing Industry Revenue (Million) Forecast, by Application 2019 & 2032
- Table 32: Rest of Asia Pacific Context Aware Computing Industry Revenue (Million) Forecast, by Application 2019 & 2032
- Table 33: Global Context Aware Computing Industry Revenue Million Forecast, by Country 2019 & 2032
- Table 34: Brazil Context Aware Computing Industry Revenue (Million) Forecast, by Application 2019 & 2032
- Table 35: Argentina Context Aware Computing Industry Revenue (Million) Forecast, by Application 2019 & 2032
- Table 36: Peru Context Aware Computing Industry Revenue (Million) Forecast, by Application 2019 & 2032
- Table 37: Chile Context Aware Computing Industry Revenue (Million) Forecast, by Application 2019 & 2032
- Table 38: Colombia Context Aware Computing Industry Revenue (Million) Forecast, by Application 2019 & 2032
- Table 39: Ecuador Context Aware Computing Industry Revenue (Million) Forecast, by Application 2019 & 2032
- Table 40: Venezuela Context Aware Computing Industry Revenue (Million) Forecast, by Application 2019 & 2032
- Table 41: Rest of South America Context Aware Computing Industry Revenue (Million) Forecast, by Application 2019 & 2032
- Table 42: Global Context Aware Computing Industry Revenue Million Forecast, by Country 2019 & 2032
- Table 43: United States Context Aware Computing Industry Revenue (Million) Forecast, by Application 2019 & 2032
- Table 44: Canada Context Aware Computing Industry Revenue (Million) Forecast, by Application 2019 & 2032
- Table 45: Mexico Context Aware Computing Industry Revenue (Million) Forecast, by Application 2019 & 2032
- Table 46: Global Context Aware Computing Industry Revenue Million Forecast, by Country 2019 & 2032
- Table 47: United Arab Emirates Context Aware Computing Industry Revenue (Million) Forecast, by Application 2019 & 2032
- Table 48: Saudi Arabia Context Aware Computing Industry Revenue (Million) Forecast, by Application 2019 & 2032
- Table 49: South Africa Context Aware Computing Industry Revenue (Million) Forecast, by Application 2019 & 2032
- Table 50: Rest of Middle East and Africa Context Aware Computing Industry Revenue (Million) Forecast, by Application 2019 & 2032
- Table 51: Global Context Aware Computing Industry Revenue Million Forecast, by Type 2019 & 2032
- Table 52: Global Context Aware Computing Industry Revenue Million Forecast, by Vendor (Qualitative Analysis) 2019 & 2032
- Table 53: Global Context Aware Computing Industry Revenue Million Forecast, by End-user Industry 2019 & 2032
- Table 54: Global Context Aware Computing Industry Revenue Million Forecast, by Country 2019 & 2032
- Table 55: Global Context Aware Computing Industry Revenue Million Forecast, by Type 2019 & 2032
- Table 56: Global Context Aware Computing Industry Revenue Million Forecast, by Vendor (Qualitative Analysis) 2019 & 2032
- Table 57: Global Context Aware Computing Industry Revenue Million Forecast, by End-user Industry 2019 & 2032
- Table 58: Global Context Aware Computing Industry Revenue Million Forecast, by Country 2019 & 2032
- Table 59: Global Context Aware Computing Industry Revenue Million Forecast, by Type 2019 & 2032
- Table 60: Global Context Aware Computing Industry Revenue Million Forecast, by Vendor (Qualitative Analysis) 2019 & 2032
- Table 61: Global Context Aware Computing Industry Revenue Million Forecast, by End-user Industry 2019 & 2032
- Table 62: Global Context Aware Computing Industry Revenue Million Forecast, by Country 2019 & 2032
- Table 63: Global Context Aware Computing Industry Revenue Million Forecast, by Type 2019 & 2032
- Table 64: Global Context Aware Computing Industry Revenue Million Forecast, by Vendor (Qualitative Analysis) 2019 & 2032
- Table 65: Global Context Aware Computing Industry Revenue Million Forecast, by End-user Industry 2019 & 2032
- Table 66: Global Context Aware Computing Industry Revenue Million Forecast, by Country 2019 & 2032
- Table 67: Global Context Aware Computing Industry Revenue Million Forecast, by Type 2019 & 2032
- Table 68: Global Context Aware Computing Industry Revenue Million Forecast, by Vendor (Qualitative Analysis) 2019 & 2032
- Table 69: Global Context Aware Computing Industry Revenue Million Forecast, by End-user Industry 2019 & 2032
- Table 70: Global Context Aware Computing Industry Revenue Million Forecast, by Country 2019 & 2032
Frequently Asked Questions
1. What is the projected Compound Annual Growth Rate (CAGR) of the Context Aware Computing Industry?
The projected CAGR is approximately 11.49%.
2. Which companies are prominent players in the Context Aware Computing Industry?
Key companies in the market include IBM Corporation, Google LLC, Intel Corp *List Not Exhaustive, Samsung Electronics Co Ltd, Cisco Systems Inc, Verizon Communications Inc, Microsoft Corporation, Amazon Web Services Inc, Oracle Corporation.
3. What are the main segments of the Context Aware Computing Industry?
The market segments include Type, Vendor (Qualitative Analysis), End-user Industry.
4. Can you provide details about the market size?
The market size is estimated to be USD 63.63 Million as of 2022.
5. What are some drivers contributing to market growth?
Integration of Artificial Intelligence into Mobile Apps; Rise in Integrated IoT Offerings.
6. What are the notable trends driving market growth?
Consumer Electronics Segment is Expected to Witness Significant Growth.
7. Are there any restraints impacting market growth?
Computational Complexities.
8. Can you provide examples of recent developments in the market?
December 2022: T-Mobile announced a collaboration with Cisco to launch the world's largest highly scalable and distributed nationwide cloud native converged core gateway, taking the Un-carrier's 5G standalone core to the next level. The Un-carrier has moved all of its 5G and 4G traffic to the new cloud-native core gateway, immediately improving customer performance by more than 10% in speed and latency. Furthermore, the new converged core gateway simplifies operations for T-Mobile, allowing the Un-carrier to shift resources with greater agility and roll out services such as 5G Home Internet. It will also shorten the time to market for new 5G and IoT services such as network slicing and Voice over 5G (VoNR) by allowing T-Mobile to test and quickly deploy new capabilities at scale.
9. What pricing options are available for accessing the report?
Pricing options include single-user, multi-user, and enterprise licenses priced at USD 4750, USD 5250, and USD 8750 respectively.
10. Is the market size provided in terms of value or volume?
The market size is provided in terms of value, measured in Million.
11. Are there any specific market keywords associated with the report?
Yes, the market keyword associated with the report is "Context Aware Computing Industry," which aids in identifying and referencing the specific market segment covered.
12. How do I determine which pricing option suits my needs best?
The pricing options vary based on user requirements and access needs. Individual users may opt for single-user licenses, while businesses requiring broader access may choose multi-user or enterprise licenses for cost-effective access to the report.
13. Are there any additional resources or data provided in the Context Aware Computing Industry report?
While the report offers comprehensive insights, it's advisable to review the specific contents or supplementary materials provided to ascertain if additional resources or data are available.
14. How can I stay updated on further developments or reports in the Context Aware Computing Industry?
To stay informed about further developments, trends, and reports in the Context Aware Computing Industry, consider subscribing to industry newsletters, following relevant companies and organizations, or regularly checking reputable industry news sources and publications.
Methodology
Step 1 - Identification of Relevant Samples Size from Population Database


Step 2 - Approaches for Defining Global Market Size (Value, Volume* & Price*)

Note*: In applicable scenarios
Step 3 - Data Sources
Primary Research
- Web Analytics
- Survey Reports
- Research Institute
- Latest Research Reports
- Opinion Leaders
Secondary Research
- Annual Reports
- White Paper
- Latest Press Release
- Industry Association
- Paid Database
- Investor Presentations

Step 4 - Data Triangulation
Involves using different sources of information in order to increase the validity of a study
These sources are likely to be stakeholders in a program - participants, other researchers, program staff, other community members, and so on.
Then we put all data in single framework & apply various statistical tools to find out the dynamic on the market.
During the analysis stage, feedback from the stakeholder groups would be compared to determine areas of agreement as well as areas of divergence


