
Key Insights
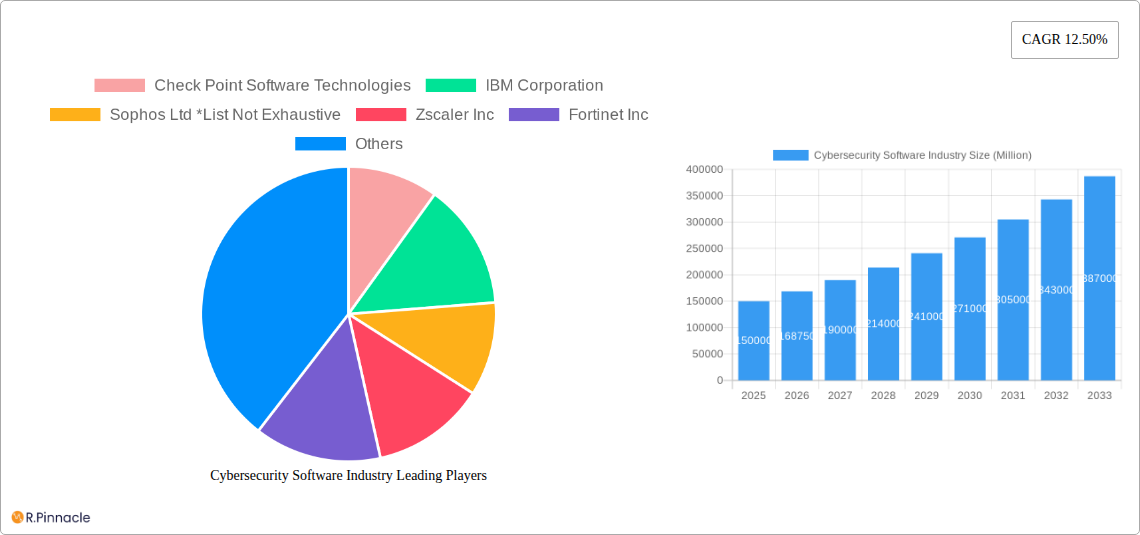
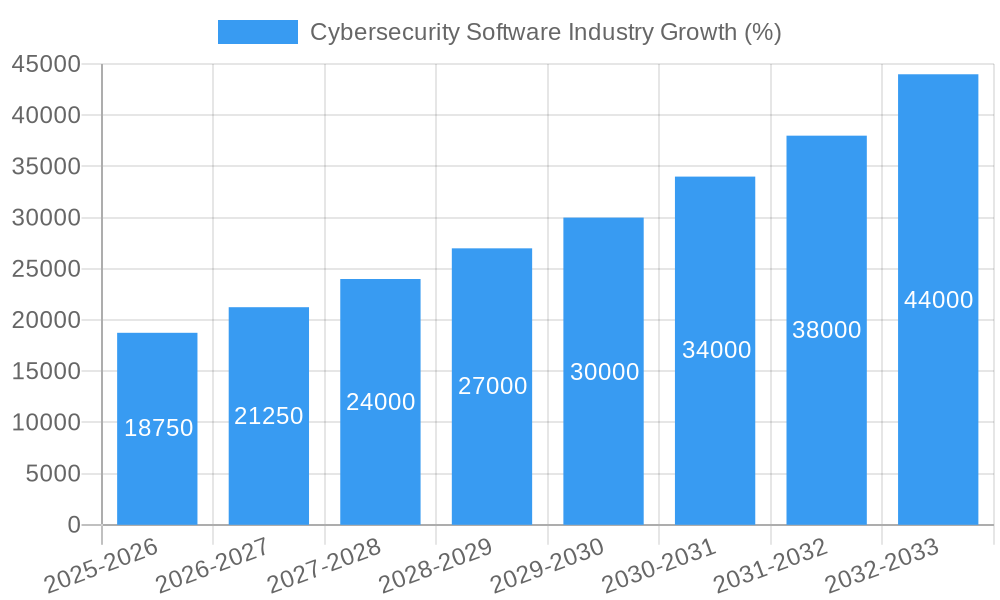
The global cybersecurity software market is experiencing robust growth, projected to reach a substantial size within the forecast period (2025-2033). A compound annual growth rate (CAGR) of 12.50% indicates significant market expansion driven by several key factors. The increasing sophistication and frequency of cyberattacks targeting businesses and individuals necessitate robust cybersecurity measures. The rising adoption of cloud computing, IoT devices, and remote work models expands the attack surface, fueling demand for comprehensive security solutions. Furthermore, stringent government regulations regarding data protection and privacy compliance are compelling organizations to invest heavily in cybersecurity software. Market segmentation reveals strong growth across various offerings (software and services), deployment models (on-premises and cloud), and end-user sectors (BFSI, healthcare, manufacturing, government & defense, IT & telecommunications). The cloud deployment segment is expected to dominate due to its scalability, cost-effectiveness, and accessibility. The BFSI sector represents a major end-user segment, given the high value and sensitivity of financial data. Competitive landscape analysis shows a multitude of established players and emerging vendors, indicating a dynamic and evolving market. While challenges such as the complexity of managing diverse security solutions and the skills gap in cybersecurity professionals exist, the overall market trajectory points towards sustained and considerable expansion.
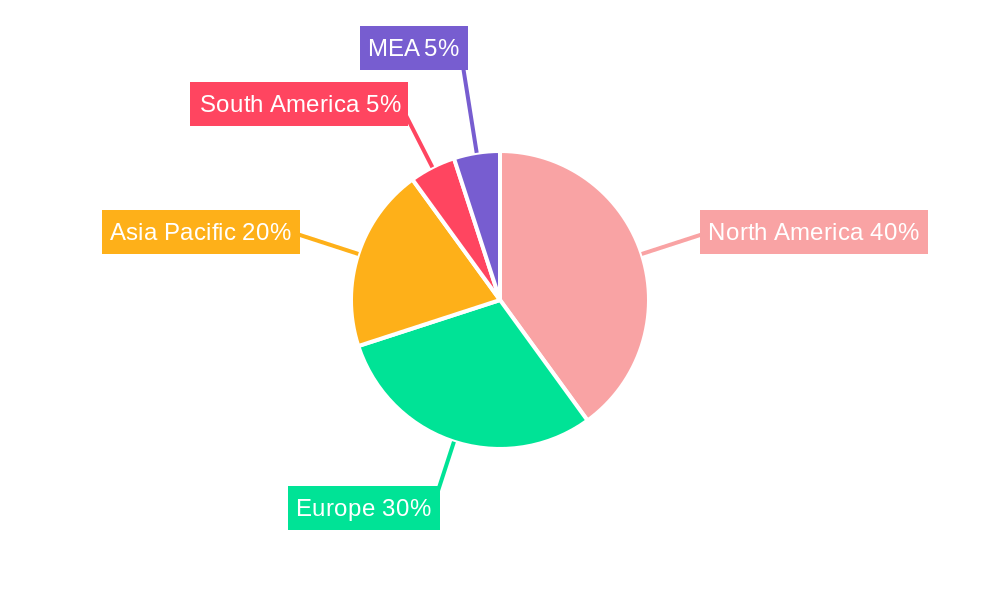
The continued growth of the cybersecurity software market is expected to be further influenced by advancements in artificial intelligence (AI) and machine learning (ML) for threat detection and response. These technologies enable proactive security measures, automating threat identification and reducing the reliance on manual intervention. Furthermore, the increasing adoption of blockchain technology for enhancing data security and the growing awareness of cybersecurity risks amongst consumers are additional drivers of market growth. While the market faces restraints such as high implementation costs and the need for continuous updates to counter evolving threats, the imperative for robust cybersecurity will continue to outweigh these challenges. This ensures consistent demand across various geographical regions, with North America and Europe currently holding significant market shares, while the Asia-Pacific region demonstrates substantial growth potential due to rapid technological adoption and increasing digitalization.
Cybersecurity Software Industry Report: 2019-2033
This comprehensive report provides an in-depth analysis of the global Cybersecurity Software industry, projecting a market value exceeding XX Million by 2033. The study covers the period 2019-2033, with 2025 as the base and estimated year. It offers actionable insights for industry professionals, investors, and strategic decision-makers navigating this rapidly evolving landscape.
Cybersecurity Software Industry Market Structure & Innovation Trends
The cybersecurity software market is characterized by a moderately concentrated structure, with key players like Check Point Software Technologies, IBM Corporation, and Sophos Ltd holding significant market share. However, the market also accommodates numerous smaller niche players, leading to intense competition. Innovation is driven by the relentless evolution of cyber threats, necessitating continuous advancements in security technologies. Regulatory frameworks, such as GDPR and CCPA, significantly impact market dynamics, driving demand for compliant solutions. Product substitutes, such as open-source security tools, present a competitive challenge, although the complexity and support requirements often favor established vendors. The end-user demographics are expanding to encompass virtually all sectors, with BFSI, healthcare, and government & defense showing the highest demand. M&A activity is vibrant, with significant deals such as Google Cloud’s acquisition of Mandiant for USD 5.4 Billion in March 2022, highlighting the strategic importance of security solutions. This activity consolidates market power and introduces new technologies and capabilities. The total value of M&A deals in the sector during the historical period (2019-2024) is estimated at XX Million. Market share distribution among top players is roughly as follows (estimated): Check Point – xx%, IBM – xx%, Sophos – xx%, others – xx%.
Cybersecurity Software Industry Market Dynamics & Trends
The cybersecurity software market exhibits robust growth, driven primarily by the escalating sophistication and frequency of cyberattacks. Technological disruptions, such as the rise of cloud computing, IoT, and AI, present both opportunities and challenges. The increasing adoption of cloud-based solutions is fueling market expansion, while the integration of AI and machine learning in security technologies enhances threat detection and response capabilities. Consumer preferences are shifting towards integrated, comprehensive security platforms that offer ease of use and scalability. Competitive dynamics are intense, with players focusing on differentiation through advanced features, strategic partnerships, and acquisitions. The market is projected to achieve a CAGR of XX% during the forecast period (2025-2033). Market penetration in key segments like BFSI is reaching approximately XX%, showcasing significant industry adoption.
Dominant Regions & Segments in Cybersecurity Software Industry
North America currently dominates the cybersecurity software market, driven by a combination of factors.
- Strong technological infrastructure: Advanced digital infrastructure supports the deployment of sophisticated security solutions.
- High level of cybersecurity awareness: Organizations and individuals are highly aware of cyber threats.
- Robust regulatory environment: Strong data protection regulations drive demand for security solutions.
- High adoption rates of cloud and IoT technologies: This fuels the need for integrated security solutions.
The cloud-based deployment segment exhibits the fastest growth, driven by its scalability, cost-effectiveness, and accessibility. Within the end-user segments, BFSI, healthcare, and government & defense demonstrate the highest demand due to stringent regulatory requirements and the sensitivity of their data.
Cybersecurity Software Industry Product Innovations
Recent product innovations focus on advanced threat detection using AI and machine learning, automated security response mechanisms, and integrated security platforms that consolidate multiple security functions. These innovations offer enhanced protection, reduced management complexity, and improved efficiency, aligning with market demand for comprehensive and user-friendly solutions. The integration of cloud-based security technologies and improved threat intelligence sharing are major competitive advantages in this rapidly changing industry.
Report Scope & Segmentation Analysis
This report segments the market by:
- Offering: Software and Services. Software is experiencing substantial growth due to its inherent flexibility and scalability; Services segment provides added value through consulting and implementation.
- Deployment: On-premises and Cloud. The cloud segment shows significantly higher growth due to its inherent advantages.
- End User: BFSI, Healthcare, Manufacturing, Government & Defense, IT and Telecommunication, and Other End Users. Each segment demonstrates unique needs and presents varying growth trajectories.
Each segment's growth projection, market size, and competitive landscape are analyzed in detail within the full report.
Key Drivers of Cybersecurity Software Industry Growth
The cybersecurity software market is propelled by several key drivers: the rising frequency and severity of cyberattacks, increasing adoption of cloud-based technologies, stringent government regulations around data protection (like GDPR and CCPA), the growing reliance on interconnected devices (IoT), and the increasing adoption of AI and machine learning for advanced threat detection and response.
Challenges in the Cybersecurity Software Industry Sector
The industry faces challenges including the rapid evolution of sophisticated cyber threats, a shortage of skilled cybersecurity professionals, the complexity of integrating multiple security solutions, the rising cost of security solutions, and the need for constant updates to address new vulnerabilities. These factors can impede market growth.
Emerging Opportunities in Cybersecurity Software Industry
Significant opportunities exist in the expanding adoption of cloud-based security, increased demand for AI-powered security solutions, the growth of IoT security, the expansion into emerging markets, and the development of advanced threat intelligence platforms. These opportunities present significant potential for future growth within the industry.
Leading Players in the Cybersecurity Software Industry Market
- Check Point Software Technologies
- IBM Corporation
- Sophos Ltd
- Zscaler Inc
- Fortinet Inc
- F5 Networks Inc
- Cisco Systems Inc
- Broadcom Inc
- Microsoft Corporation
- Proofpoint Inc
- Mandiant Inc
- CyberArk Software Ltd
- Palo Alto Networks Inc
Key Developments in Cybersecurity Software Industry
- March 2022: Google Cloud acquired Mandiant for USD 5.4 Billion, demonstrating the increasing strategic importance of robust cybersecurity solutions.
- April 2022: Comcast Business expanded its partnership with Cisco, integrating Cisco SD-WAN into its managed SD-WAN portfolio, highlighting the growing demand for comprehensive and secure networking solutions.
Future Outlook for Cybersecurity Software Industry Market
The cybersecurity software market is poised for sustained growth, driven by ongoing technological advancements, escalating cyber threats, and increasing regulatory pressures. Strategic partnerships, acquisitions, and the development of innovative security solutions will shape the competitive landscape. The market presents lucrative opportunities for companies that can effectively address the evolving needs of businesses and individuals in an increasingly digital world.
Cybersecurity Software Industry Segmentation
-
1. Offering
- 1.1. Software
- 1.2. Services
-
2. Deployment
- 2.1. On-premises
- 2.2. Cloud
-
3. End User
- 3.1. BFSI
- 3.2. Healthcare
- 3.3. Manufacturing
- 3.4. Government & Defense
- 3.5. IT and Telecommunication
- 3.6. Other End Users
Cybersecurity Software Industry Segmentation By Geography
- 1. North America
- 2. Europe
- 3. Asia Pacific
- 4. Latin America
- 5. Middle East
Cybersecurity Software Industry REPORT HIGHLIGHTS
| Aspects | Details |
|---|---|
| Study Period | 2019-2033 |
| Base Year | 2024 |
| Estimated Year | 2025 |
| Forecast Period | 2025-2033 |
| Historical Period | 2019-2024 |
| Growth Rate | CAGR of 12.50% from 2019-2033 |
| Segmentation |
|
Table of Contents
- 1. Introduction
- 1.1. Research Scope
- 1.2. Market Segmentation
- 1.3. Research Methodology
- 1.4. Definitions and Assumptions
- 2. Executive Summary
- 2.1. Introduction
- 3. Market Dynamics
- 3.1. Introduction
- 3.2. Market Drivers
- 3.2.1. Increasing Demand for Digitalization and Scalable IT Infrastructure; Rapidly Increasing Cybersecurity Incidents and Regulations Requiring Their Reporting
- 3.3. Market Restrains
- 3.3.1. Computational Complexities
- 3.4. Market Trends
- 3.4.1. The BFSI End-User Segment is Expected to Witness Significant Growth
- 4. Market Factor Analysis
- 4.1. Porters Five Forces
- 4.2. Supply/Value Chain
- 4.3. PESTEL analysis
- 4.4. Market Entropy
- 4.5. Patent/Trademark Analysis
- 5. Global Cybersecurity Software Industry Analysis, Insights and Forecast, 2019-2031
- 5.1. Market Analysis, Insights and Forecast - by Offering
- 5.1.1. Software
- 5.1.2. Services
- 5.2. Market Analysis, Insights and Forecast - by Deployment
- 5.2.1. On-premises
- 5.2.2. Cloud
- 5.3. Market Analysis, Insights and Forecast - by End User
- 5.3.1. BFSI
- 5.3.2. Healthcare
- 5.3.3. Manufacturing
- 5.3.4. Government & Defense
- 5.3.5. IT and Telecommunication
- 5.3.6. Other End Users
- 5.4. Market Analysis, Insights and Forecast - by Region
- 5.4.1. North America
- 5.4.2. Europe
- 5.4.3. Asia Pacific
- 5.4.4. Latin America
- 5.4.5. Middle East
- 5.1. Market Analysis, Insights and Forecast - by Offering
- 6. North America Cybersecurity Software Industry Analysis, Insights and Forecast, 2019-2031
- 6.1. Market Analysis, Insights and Forecast - by Offering
- 6.1.1. Software
- 6.1.2. Services
- 6.2. Market Analysis, Insights and Forecast - by Deployment
- 6.2.1. On-premises
- 6.2.2. Cloud
- 6.3. Market Analysis, Insights and Forecast - by End User
- 6.3.1. BFSI
- 6.3.2. Healthcare
- 6.3.3. Manufacturing
- 6.3.4. Government & Defense
- 6.3.5. IT and Telecommunication
- 6.3.6. Other End Users
- 6.1. Market Analysis, Insights and Forecast - by Offering
- 7. Europe Cybersecurity Software Industry Analysis, Insights and Forecast, 2019-2031
- 7.1. Market Analysis, Insights and Forecast - by Offering
- 7.1.1. Software
- 7.1.2. Services
- 7.2. Market Analysis, Insights and Forecast - by Deployment
- 7.2.1. On-premises
- 7.2.2. Cloud
- 7.3. Market Analysis, Insights and Forecast - by End User
- 7.3.1. BFSI
- 7.3.2. Healthcare
- 7.3.3. Manufacturing
- 7.3.4. Government & Defense
- 7.3.5. IT and Telecommunication
- 7.3.6. Other End Users
- 7.1. Market Analysis, Insights and Forecast - by Offering
- 8. Asia Pacific Cybersecurity Software Industry Analysis, Insights and Forecast, 2019-2031
- 8.1. Market Analysis, Insights and Forecast - by Offering
- 8.1.1. Software
- 8.1.2. Services
- 8.2. Market Analysis, Insights and Forecast - by Deployment
- 8.2.1. On-premises
- 8.2.2. Cloud
- 8.3. Market Analysis, Insights and Forecast - by End User
- 8.3.1. BFSI
- 8.3.2. Healthcare
- 8.3.3. Manufacturing
- 8.3.4. Government & Defense
- 8.3.5. IT and Telecommunication
- 8.3.6. Other End Users
- 8.1. Market Analysis, Insights and Forecast - by Offering
- 9. Latin America Cybersecurity Software Industry Analysis, Insights and Forecast, 2019-2031
- 9.1. Market Analysis, Insights and Forecast - by Offering
- 9.1.1. Software
- 9.1.2. Services
- 9.2. Market Analysis, Insights and Forecast - by Deployment
- 9.2.1. On-premises
- 9.2.2. Cloud
- 9.3. Market Analysis, Insights and Forecast - by End User
- 9.3.1. BFSI
- 9.3.2. Healthcare
- 9.3.3. Manufacturing
- 9.3.4. Government & Defense
- 9.3.5. IT and Telecommunication
- 9.3.6. Other End Users
- 9.1. Market Analysis, Insights and Forecast - by Offering
- 10. Middle East Cybersecurity Software Industry Analysis, Insights and Forecast, 2019-2031
- 10.1. Market Analysis, Insights and Forecast - by Offering
- 10.1.1. Software
- 10.1.2. Services
- 10.2. Market Analysis, Insights and Forecast - by Deployment
- 10.2.1. On-premises
- 10.2.2. Cloud
- 10.3. Market Analysis, Insights and Forecast - by End User
- 10.3.1. BFSI
- 10.3.2. Healthcare
- 10.3.3. Manufacturing
- 10.3.4. Government & Defense
- 10.3.5. IT and Telecommunication
- 10.3.6. Other End Users
- 10.1. Market Analysis, Insights and Forecast - by Offering
- 11. North America Cybersecurity Software Industry Analysis, Insights and Forecast, 2019-2031
- 11.1. Market Analysis, Insights and Forecast - By Country/Sub-region
- 11.1.1 United States
- 11.1.2 Canada
- 11.1.3 Mexico
- 12. Europe Cybersecurity Software Industry Analysis, Insights and Forecast, 2019-2031
- 12.1. Market Analysis, Insights and Forecast - By Country/Sub-region
- 12.1.1 Germany
- 12.1.2 United Kingdom
- 12.1.3 France
- 12.1.4 Spain
- 12.1.5 Italy
- 12.1.6 Spain
- 12.1.7 Belgium
- 12.1.8 Netherland
- 12.1.9 Nordics
- 12.1.10 Rest of Europe
- 13. Asia Pacific Cybersecurity Software Industry Analysis, Insights and Forecast, 2019-2031
- 13.1. Market Analysis, Insights and Forecast - By Country/Sub-region
- 13.1.1 China
- 13.1.2 Japan
- 13.1.3 India
- 13.1.4 South Korea
- 13.1.5 Southeast Asia
- 13.1.6 Australia
- 13.1.7 Indonesia
- 13.1.8 Phillipes
- 13.1.9 Singapore
- 13.1.10 Thailandc
- 13.1.11 Rest of Asia Pacific
- 14. South America Cybersecurity Software Industry Analysis, Insights and Forecast, 2019-2031
- 14.1. Market Analysis, Insights and Forecast - By Country/Sub-region
- 14.1.1 Brazil
- 14.1.2 Argentina
- 14.1.3 Peru
- 14.1.4 Chile
- 14.1.5 Colombia
- 14.1.6 Ecuador
- 14.1.7 Venezuela
- 14.1.8 Rest of South America
- 15. North America Cybersecurity Software Industry Analysis, Insights and Forecast, 2019-2031
- 15.1. Market Analysis, Insights and Forecast - By Country/Sub-region
- 15.1.1 United States
- 15.1.2 Canada
- 15.1.3 Mexico
- 16. MEA Cybersecurity Software Industry Analysis, Insights and Forecast, 2019-2031
- 16.1. Market Analysis, Insights and Forecast - By Country/Sub-region
- 16.1.1 United Arab Emirates
- 16.1.2 Saudi Arabia
- 16.1.3 South Africa
- 16.1.4 Rest of Middle East and Africa
- 17. Competitive Analysis
- 17.1. Global Market Share Analysis 2024
- 17.2. Company Profiles
- 17.2.1 Check Point Software Technologies
- 17.2.1.1. Overview
- 17.2.1.2. Products
- 17.2.1.3. SWOT Analysis
- 17.2.1.4. Recent Developments
- 17.2.1.5. Financials (Based on Availability)
- 17.2.2 IBM Corporation
- 17.2.2.1. Overview
- 17.2.2.2. Products
- 17.2.2.3. SWOT Analysis
- 17.2.2.4. Recent Developments
- 17.2.2.5. Financials (Based on Availability)
- 17.2.3 Sophos Ltd *List Not Exhaustive
- 17.2.3.1. Overview
- 17.2.3.2. Products
- 17.2.3.3. SWOT Analysis
- 17.2.3.4. Recent Developments
- 17.2.3.5. Financials (Based on Availability)
- 17.2.4 Zscaler Inc
- 17.2.4.1. Overview
- 17.2.4.2. Products
- 17.2.4.3. SWOT Analysis
- 17.2.4.4. Recent Developments
- 17.2.4.5. Financials (Based on Availability)
- 17.2.5 Fortinet Inc
- 17.2.5.1. Overview
- 17.2.5.2. Products
- 17.2.5.3. SWOT Analysis
- 17.2.5.4. Recent Developments
- 17.2.5.5. Financials (Based on Availability)
- 17.2.6 F5 Networks Inc
- 17.2.6.1. Overview
- 17.2.6.2. Products
- 17.2.6.3. SWOT Analysis
- 17.2.6.4. Recent Developments
- 17.2.6.5. Financials (Based on Availability)
- 17.2.7 Cisco Systems Inc
- 17.2.7.1. Overview
- 17.2.7.2. Products
- 17.2.7.3. SWOT Analysis
- 17.2.7.4. Recent Developments
- 17.2.7.5. Financials (Based on Availability)
- 17.2.8 Broadcom Inc
- 17.2.8.1. Overview
- 17.2.8.2. Products
- 17.2.8.3. SWOT Analysis
- 17.2.8.4. Recent Developments
- 17.2.8.5. Financials (Based on Availability)
- 17.2.9 Microsoft Corporation
- 17.2.9.1. Overview
- 17.2.9.2. Products
- 17.2.9.3. SWOT Analysis
- 17.2.9.4. Recent Developments
- 17.2.9.5. Financials (Based on Availability)
- 17.2.10 Proofpoint Inc
- 17.2.10.1. Overview
- 17.2.10.2. Products
- 17.2.10.3. SWOT Analysis
- 17.2.10.4. Recent Developments
- 17.2.10.5. Financials (Based on Availability)
- 17.2.11 Mandiant Inc
- 17.2.11.1. Overview
- 17.2.11.2. Products
- 17.2.11.3. SWOT Analysis
- 17.2.11.4. Recent Developments
- 17.2.11.5. Financials (Based on Availability)
- 17.2.12 CyberArk Software Ltd
- 17.2.12.1. Overview
- 17.2.12.2. Products
- 17.2.12.3. SWOT Analysis
- 17.2.12.4. Recent Developments
- 17.2.12.5. Financials (Based on Availability)
- 17.2.13 Palo Alto Networks Inc
- 17.2.13.1. Overview
- 17.2.13.2. Products
- 17.2.13.3. SWOT Analysis
- 17.2.13.4. Recent Developments
- 17.2.13.5. Financials (Based on Availability)
- 17.2.1 Check Point Software Technologies
List of Figures
- Figure 1: Global Cybersecurity Software Industry Revenue Breakdown (Million, %) by Region 2024 & 2032
- Figure 2: North America Cybersecurity Software Industry Revenue (Million), by Country 2024 & 2032
- Figure 3: North America Cybersecurity Software Industry Revenue Share (%), by Country 2024 & 2032
- Figure 4: Europe Cybersecurity Software Industry Revenue (Million), by Country 2024 & 2032
- Figure 5: Europe Cybersecurity Software Industry Revenue Share (%), by Country 2024 & 2032
- Figure 6: Asia Pacific Cybersecurity Software Industry Revenue (Million), by Country 2024 & 2032
- Figure 7: Asia Pacific Cybersecurity Software Industry Revenue Share (%), by Country 2024 & 2032
- Figure 8: South America Cybersecurity Software Industry Revenue (Million), by Country 2024 & 2032
- Figure 9: South America Cybersecurity Software Industry Revenue Share (%), by Country 2024 & 2032
- Figure 10: North America Cybersecurity Software Industry Revenue (Million), by Country 2024 & 2032
- Figure 11: North America Cybersecurity Software Industry Revenue Share (%), by Country 2024 & 2032
- Figure 12: MEA Cybersecurity Software Industry Revenue (Million), by Country 2024 & 2032
- Figure 13: MEA Cybersecurity Software Industry Revenue Share (%), by Country 2024 & 2032
- Figure 14: North America Cybersecurity Software Industry Revenue (Million), by Offering 2024 & 2032
- Figure 15: North America Cybersecurity Software Industry Revenue Share (%), by Offering 2024 & 2032
- Figure 16: North America Cybersecurity Software Industry Revenue (Million), by Deployment 2024 & 2032
- Figure 17: North America Cybersecurity Software Industry Revenue Share (%), by Deployment 2024 & 2032
- Figure 18: North America Cybersecurity Software Industry Revenue (Million), by End User 2024 & 2032
- Figure 19: North America Cybersecurity Software Industry Revenue Share (%), by End User 2024 & 2032
- Figure 20: North America Cybersecurity Software Industry Revenue (Million), by Country 2024 & 2032
- Figure 21: North America Cybersecurity Software Industry Revenue Share (%), by Country 2024 & 2032
- Figure 22: Europe Cybersecurity Software Industry Revenue (Million), by Offering 2024 & 2032
- Figure 23: Europe Cybersecurity Software Industry Revenue Share (%), by Offering 2024 & 2032
- Figure 24: Europe Cybersecurity Software Industry Revenue (Million), by Deployment 2024 & 2032
- Figure 25: Europe Cybersecurity Software Industry Revenue Share (%), by Deployment 2024 & 2032
- Figure 26: Europe Cybersecurity Software Industry Revenue (Million), by End User 2024 & 2032
- Figure 27: Europe Cybersecurity Software Industry Revenue Share (%), by End User 2024 & 2032
- Figure 28: Europe Cybersecurity Software Industry Revenue (Million), by Country 2024 & 2032
- Figure 29: Europe Cybersecurity Software Industry Revenue Share (%), by Country 2024 & 2032
- Figure 30: Asia Pacific Cybersecurity Software Industry Revenue (Million), by Offering 2024 & 2032
- Figure 31: Asia Pacific Cybersecurity Software Industry Revenue Share (%), by Offering 2024 & 2032
- Figure 32: Asia Pacific Cybersecurity Software Industry Revenue (Million), by Deployment 2024 & 2032
- Figure 33: Asia Pacific Cybersecurity Software Industry Revenue Share (%), by Deployment 2024 & 2032
- Figure 34: Asia Pacific Cybersecurity Software Industry Revenue (Million), by End User 2024 & 2032
- Figure 35: Asia Pacific Cybersecurity Software Industry Revenue Share (%), by End User 2024 & 2032
- Figure 36: Asia Pacific Cybersecurity Software Industry Revenue (Million), by Country 2024 & 2032
- Figure 37: Asia Pacific Cybersecurity Software Industry Revenue Share (%), by Country 2024 & 2032
- Figure 38: Latin America Cybersecurity Software Industry Revenue (Million), by Offering 2024 & 2032
- Figure 39: Latin America Cybersecurity Software Industry Revenue Share (%), by Offering 2024 & 2032
- Figure 40: Latin America Cybersecurity Software Industry Revenue (Million), by Deployment 2024 & 2032
- Figure 41: Latin America Cybersecurity Software Industry Revenue Share (%), by Deployment 2024 & 2032
- Figure 42: Latin America Cybersecurity Software Industry Revenue (Million), by End User 2024 & 2032
- Figure 43: Latin America Cybersecurity Software Industry Revenue Share (%), by End User 2024 & 2032
- Figure 44: Latin America Cybersecurity Software Industry Revenue (Million), by Country 2024 & 2032
- Figure 45: Latin America Cybersecurity Software Industry Revenue Share (%), by Country 2024 & 2032
- Figure 46: Middle East Cybersecurity Software Industry Revenue (Million), by Offering 2024 & 2032
- Figure 47: Middle East Cybersecurity Software Industry Revenue Share (%), by Offering 2024 & 2032
- Figure 48: Middle East Cybersecurity Software Industry Revenue (Million), by Deployment 2024 & 2032
- Figure 49: Middle East Cybersecurity Software Industry Revenue Share (%), by Deployment 2024 & 2032
- Figure 50: Middle East Cybersecurity Software Industry Revenue (Million), by End User 2024 & 2032
- Figure 51: Middle East Cybersecurity Software Industry Revenue Share (%), by End User 2024 & 2032
- Figure 52: Middle East Cybersecurity Software Industry Revenue (Million), by Country 2024 & 2032
- Figure 53: Middle East Cybersecurity Software Industry Revenue Share (%), by Country 2024 & 2032
List of Tables
- Table 1: Global Cybersecurity Software Industry Revenue Million Forecast, by Region 2019 & 2032
- Table 2: Global Cybersecurity Software Industry Revenue Million Forecast, by Offering 2019 & 2032
- Table 3: Global Cybersecurity Software Industry Revenue Million Forecast, by Deployment 2019 & 2032
- Table 4: Global Cybersecurity Software Industry Revenue Million Forecast, by End User 2019 & 2032
- Table 5: Global Cybersecurity Software Industry Revenue Million Forecast, by Region 2019 & 2032
- Table 6: Global Cybersecurity Software Industry Revenue Million Forecast, by Country 2019 & 2032
- Table 7: United States Cybersecurity Software Industry Revenue (Million) Forecast, by Application 2019 & 2032
- Table 8: Canada Cybersecurity Software Industry Revenue (Million) Forecast, by Application 2019 & 2032
- Table 9: Mexico Cybersecurity Software Industry Revenue (Million) Forecast, by Application 2019 & 2032
- Table 10: Global Cybersecurity Software Industry Revenue Million Forecast, by Country 2019 & 2032
- Table 11: Germany Cybersecurity Software Industry Revenue (Million) Forecast, by Application 2019 & 2032
- Table 12: United Kingdom Cybersecurity Software Industry Revenue (Million) Forecast, by Application 2019 & 2032
- Table 13: France Cybersecurity Software Industry Revenue (Million) Forecast, by Application 2019 & 2032
- Table 14: Spain Cybersecurity Software Industry Revenue (Million) Forecast, by Application 2019 & 2032
- Table 15: Italy Cybersecurity Software Industry Revenue (Million) Forecast, by Application 2019 & 2032
- Table 16: Spain Cybersecurity Software Industry Revenue (Million) Forecast, by Application 2019 & 2032
- Table 17: Belgium Cybersecurity Software Industry Revenue (Million) Forecast, by Application 2019 & 2032
- Table 18: Netherland Cybersecurity Software Industry Revenue (Million) Forecast, by Application 2019 & 2032
- Table 19: Nordics Cybersecurity Software Industry Revenue (Million) Forecast, by Application 2019 & 2032
- Table 20: Rest of Europe Cybersecurity Software Industry Revenue (Million) Forecast, by Application 2019 & 2032
- Table 21: Global Cybersecurity Software Industry Revenue Million Forecast, by Country 2019 & 2032
- Table 22: China Cybersecurity Software Industry Revenue (Million) Forecast, by Application 2019 & 2032
- Table 23: Japan Cybersecurity Software Industry Revenue (Million) Forecast, by Application 2019 & 2032
- Table 24: India Cybersecurity Software Industry Revenue (Million) Forecast, by Application 2019 & 2032
- Table 25: South Korea Cybersecurity Software Industry Revenue (Million) Forecast, by Application 2019 & 2032
- Table 26: Southeast Asia Cybersecurity Software Industry Revenue (Million) Forecast, by Application 2019 & 2032
- Table 27: Australia Cybersecurity Software Industry Revenue (Million) Forecast, by Application 2019 & 2032
- Table 28: Indonesia Cybersecurity Software Industry Revenue (Million) Forecast, by Application 2019 & 2032
- Table 29: Phillipes Cybersecurity Software Industry Revenue (Million) Forecast, by Application 2019 & 2032
- Table 30: Singapore Cybersecurity Software Industry Revenue (Million) Forecast, by Application 2019 & 2032
- Table 31: Thailandc Cybersecurity Software Industry Revenue (Million) Forecast, by Application 2019 & 2032
- Table 32: Rest of Asia Pacific Cybersecurity Software Industry Revenue (Million) Forecast, by Application 2019 & 2032
- Table 33: Global Cybersecurity Software Industry Revenue Million Forecast, by Country 2019 & 2032
- Table 34: Brazil Cybersecurity Software Industry Revenue (Million) Forecast, by Application 2019 & 2032
- Table 35: Argentina Cybersecurity Software Industry Revenue (Million) Forecast, by Application 2019 & 2032
- Table 36: Peru Cybersecurity Software Industry Revenue (Million) Forecast, by Application 2019 & 2032
- Table 37: Chile Cybersecurity Software Industry Revenue (Million) Forecast, by Application 2019 & 2032
- Table 38: Colombia Cybersecurity Software Industry Revenue (Million) Forecast, by Application 2019 & 2032
- Table 39: Ecuador Cybersecurity Software Industry Revenue (Million) Forecast, by Application 2019 & 2032
- Table 40: Venezuela Cybersecurity Software Industry Revenue (Million) Forecast, by Application 2019 & 2032
- Table 41: Rest of South America Cybersecurity Software Industry Revenue (Million) Forecast, by Application 2019 & 2032
- Table 42: Global Cybersecurity Software Industry Revenue Million Forecast, by Country 2019 & 2032
- Table 43: United States Cybersecurity Software Industry Revenue (Million) Forecast, by Application 2019 & 2032
- Table 44: Canada Cybersecurity Software Industry Revenue (Million) Forecast, by Application 2019 & 2032
- Table 45: Mexico Cybersecurity Software Industry Revenue (Million) Forecast, by Application 2019 & 2032
- Table 46: Global Cybersecurity Software Industry Revenue Million Forecast, by Country 2019 & 2032
- Table 47: United Arab Emirates Cybersecurity Software Industry Revenue (Million) Forecast, by Application 2019 & 2032
- Table 48: Saudi Arabia Cybersecurity Software Industry Revenue (Million) Forecast, by Application 2019 & 2032
- Table 49: South Africa Cybersecurity Software Industry Revenue (Million) Forecast, by Application 2019 & 2032
- Table 50: Rest of Middle East and Africa Cybersecurity Software Industry Revenue (Million) Forecast, by Application 2019 & 2032
- Table 51: Global Cybersecurity Software Industry Revenue Million Forecast, by Offering 2019 & 2032
- Table 52: Global Cybersecurity Software Industry Revenue Million Forecast, by Deployment 2019 & 2032
- Table 53: Global Cybersecurity Software Industry Revenue Million Forecast, by End User 2019 & 2032
- Table 54: Global Cybersecurity Software Industry Revenue Million Forecast, by Country 2019 & 2032
- Table 55: Global Cybersecurity Software Industry Revenue Million Forecast, by Offering 2019 & 2032
- Table 56: Global Cybersecurity Software Industry Revenue Million Forecast, by Deployment 2019 & 2032
- Table 57: Global Cybersecurity Software Industry Revenue Million Forecast, by End User 2019 & 2032
- Table 58: Global Cybersecurity Software Industry Revenue Million Forecast, by Country 2019 & 2032
- Table 59: Global Cybersecurity Software Industry Revenue Million Forecast, by Offering 2019 & 2032
- Table 60: Global Cybersecurity Software Industry Revenue Million Forecast, by Deployment 2019 & 2032
- Table 61: Global Cybersecurity Software Industry Revenue Million Forecast, by End User 2019 & 2032
- Table 62: Global Cybersecurity Software Industry Revenue Million Forecast, by Country 2019 & 2032
- Table 63: Global Cybersecurity Software Industry Revenue Million Forecast, by Offering 2019 & 2032
- Table 64: Global Cybersecurity Software Industry Revenue Million Forecast, by Deployment 2019 & 2032
- Table 65: Global Cybersecurity Software Industry Revenue Million Forecast, by End User 2019 & 2032
- Table 66: Global Cybersecurity Software Industry Revenue Million Forecast, by Country 2019 & 2032
- Table 67: Global Cybersecurity Software Industry Revenue Million Forecast, by Offering 2019 & 2032
- Table 68: Global Cybersecurity Software Industry Revenue Million Forecast, by Deployment 2019 & 2032
- Table 69: Global Cybersecurity Software Industry Revenue Million Forecast, by End User 2019 & 2032
- Table 70: Global Cybersecurity Software Industry Revenue Million Forecast, by Country 2019 & 2032
Frequently Asked Questions
1. What is the projected Compound Annual Growth Rate (CAGR) of the Cybersecurity Software Industry?
The projected CAGR is approximately 12.50%.
2. Which companies are prominent players in the Cybersecurity Software Industry?
Key companies in the market include Check Point Software Technologies, IBM Corporation, Sophos Ltd *List Not Exhaustive, Zscaler Inc, Fortinet Inc, F5 Networks Inc, Cisco Systems Inc, Broadcom Inc, Microsoft Corporation, Proofpoint Inc, Mandiant Inc, CyberArk Software Ltd, Palo Alto Networks Inc.
3. What are the main segments of the Cybersecurity Software Industry?
The market segments include Offering, Deployment, End User.
4. Can you provide details about the market size?
The market size is estimated to be USD XX Million as of 2022.
5. What are some drivers contributing to market growth?
Increasing Demand for Digitalization and Scalable IT Infrastructure; Rapidly Increasing Cybersecurity Incidents and Regulations Requiring Their Reporting.
6. What are the notable trends driving market growth?
The BFSI End-User Segment is Expected to Witness Significant Growth.
7. Are there any restraints impacting market growth?
Computational Complexities.
8. Can you provide examples of recent developments in the market?
April 2022 - Comcast business announced the expansion of its strategic partnership with Cisco by adding Cisco SD-WAN powered by Viptela to its managed SD-WAN solution portfolio. The partnership expands the ability of the company to provide enterprise customers with comprehensive, global secure networking solutions with Ethernet, SD-WAN(software-defined vast area network), and security solutions.
9. What pricing options are available for accessing the report?
Pricing options include single-user, multi-user, and enterprise licenses priced at USD 4750, USD 5250, and USD 8750 respectively.
10. Is the market size provided in terms of value or volume?
The market size is provided in terms of value, measured in Million.
11. Are there any specific market keywords associated with the report?
Yes, the market keyword associated with the report is "Cybersecurity Software Industry," which aids in identifying and referencing the specific market segment covered.
12. How do I determine which pricing option suits my needs best?
The pricing options vary based on user requirements and access needs. Individual users may opt for single-user licenses, while businesses requiring broader access may choose multi-user or enterprise licenses for cost-effective access to the report.
13. Are there any additional resources or data provided in the Cybersecurity Software Industry report?
While the report offers comprehensive insights, it's advisable to review the specific contents or supplementary materials provided to ascertain if additional resources or data are available.
14. How can I stay updated on further developments or reports in the Cybersecurity Software Industry?
To stay informed about further developments, trends, and reports in the Cybersecurity Software Industry, consider subscribing to industry newsletters, following relevant companies and organizations, or regularly checking reputable industry news sources and publications.
Methodology
Step 1 - Identification of Relevant Samples Size from Population Database


Step 2 - Approaches for Defining Global Market Size (Value, Volume* & Price*)

Note*: In applicable scenarios
Step 3 - Data Sources
Primary Research
- Web Analytics
- Survey Reports
- Research Institute
- Latest Research Reports
- Opinion Leaders
Secondary Research
- Annual Reports
- White Paper
- Latest Press Release
- Industry Association
- Paid Database
- Investor Presentations

Step 4 - Data Triangulation
Involves using different sources of information in order to increase the validity of a study
These sources are likely to be stakeholders in a program - participants, other researchers, program staff, other community members, and so on.
Then we put all data in single framework & apply various statistical tools to find out the dynamic on the market.
During the analysis stage, feedback from the stakeholder groups would be compared to determine areas of agreement as well as areas of divergence


