
Key Insights
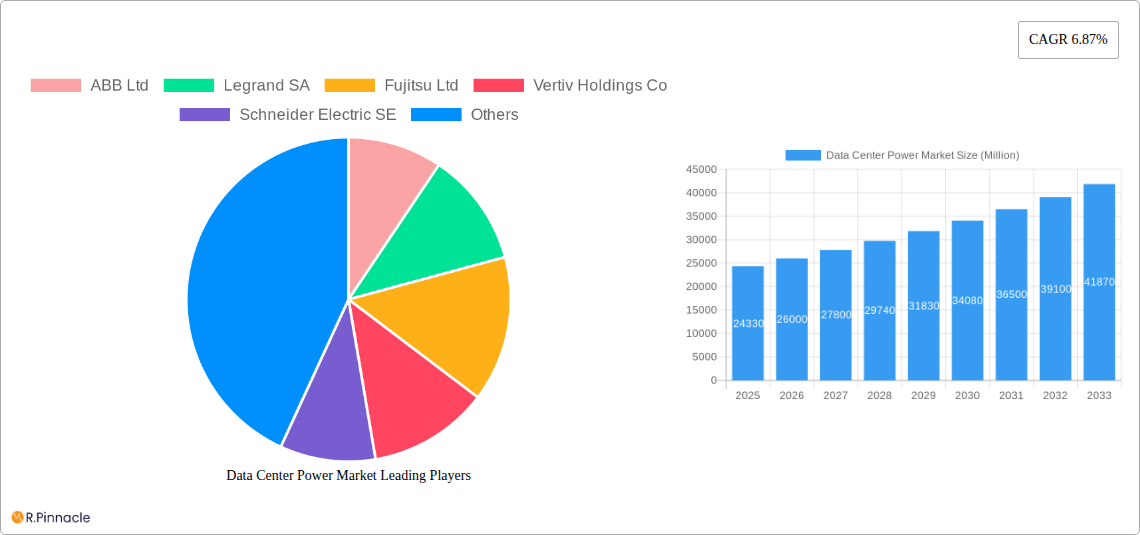
The data center power market, valued at $24.33 billion in 2025, is experiencing robust growth, projected to expand at a Compound Annual Growth Rate (CAGR) of 6.87% from 2025 to 2033. This expansion is fueled by several key factors. The increasing adoption of cloud computing and big data analytics necessitates substantial power infrastructure for data centers worldwide. Furthermore, the growing demand for higher computing power and energy-efficient solutions is driving innovation and investment in advanced power management technologies. The shift towards edge computing also contributes significantly, as it requires a distributed network of smaller data centers, each needing reliable power. Market segmentation reveals significant opportunities across various types (solutions and services), end-user applications (IT, manufacturing, BFSI, government, telecom), and data center sizes (small/medium and large). Companies like ABB, Schneider Electric, and Vertiv are leading the market, offering a diverse portfolio of power solutions. North America and Europe currently hold significant market shares, but the Asia-Pacific region is expected to witness substantial growth driven by rapid digital transformation and infrastructure development.
The competitive landscape is characterized by both established players and specialized niche providers. Large multinational corporations are leveraging their global reach and established distribution networks to cater to the growing demand. Meanwhile, smaller, specialized companies are focusing on providing innovative solutions and services within specific segments of the market. The market faces some constraints, including the increasing cost of energy and stringent environmental regulations promoting sustainable power solutions. However, these challenges also present opportunities for companies offering energy-efficient technologies and solutions that minimize the environmental impact of data center operations. The overall outlook for the data center power market remains highly positive, driven by long-term trends in digital transformation and the ever-growing demand for computing power across various industries.
Data Center Power Market Report: 2019-2033
This comprehensive report provides a detailed analysis of the Data Center Power Market, offering invaluable insights for industry professionals, investors, and strategic decision-makers. Covering the period from 2019 to 2033, with a focus on 2025, this report meticulously examines market dynamics, segmentation, leading players, and future growth prospects. The market is expected to reach xx Million by 2033, exhibiting a CAGR of xx% during the forecast period (2025-2033).
Data Center Power Market Market Structure & Innovation Trends
This section analyzes the competitive landscape, innovation drivers, and regulatory influences shaping the Data Center Power Market. The market exhibits moderate concentration, with key players such as ABB Ltd, Schneider Electric SE, and Vertiv Holdings Co holding significant market share. However, numerous smaller players contribute significantly to the overall market size, especially in niche segments. Innovation is driven by the increasing demand for higher power densities, improved energy efficiency, and enhanced reliability in data centers. Regulatory frameworks focused on energy conservation and sustainability are also playing a significant role. Product substitution is limited due to the specialized nature of data center power solutions.
- Market Concentration: Moderately concentrated, with top 5 players holding approximately xx% of market share in 2025.
- Innovation Drivers: Demand for higher power density, improved energy efficiency, enhanced reliability, and sustainable solutions.
- Regulatory Frameworks: Increasing emphasis on energy conservation and sustainability impacting product development and adoption.
- M&A Activities: A steady stream of mergers and acquisitions (M&A) activity, with total deal value estimated at xx Million in the last 5 years. These activities are primarily driven by consolidation efforts and expansion into new markets. Examples include [Insert specific examples of relevant M&A activity if available, otherwise state "Specific examples not available for disclosure"].
Data Center Power Market Market Dynamics & Trends
The Data Center Power Market is experiencing robust growth fueled by several key factors. The rapid expansion of cloud computing, big data analytics, and the Internet of Things (IoT) are driving the demand for more powerful and efficient data centers. Technological advancements, such as the adoption of AI and machine learning, further amplify this trend. Consumer preferences are shifting towards greater reliability, energy efficiency, and sustainability. The competitive landscape is characterized by intense competition among established players and emerging companies, leading to continuous innovation and improved product offerings.
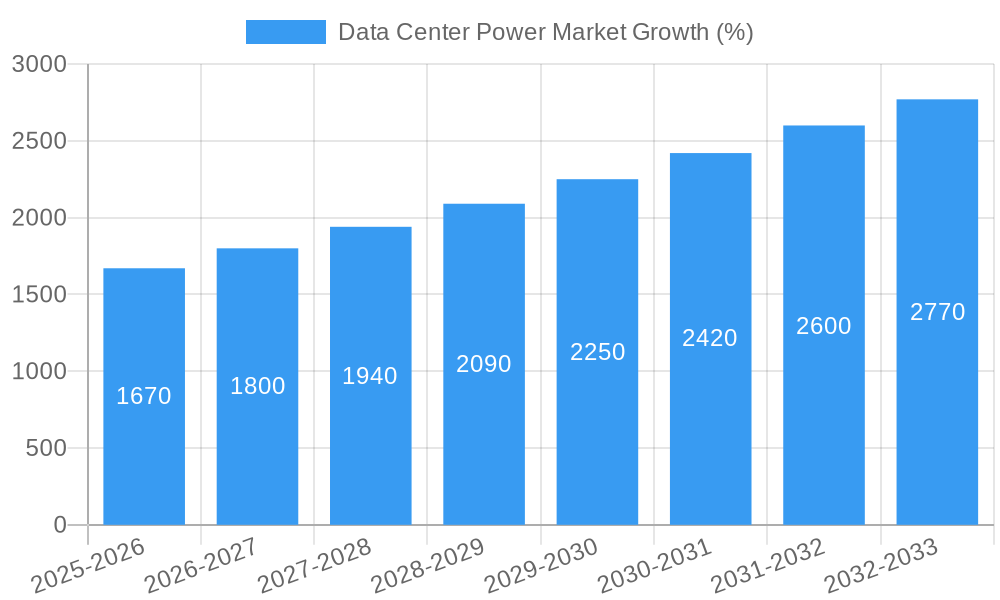
The market experienced a growth of xx Million from 2019 to 2024 and is projected to continue this growth trajectory in the forecast period. Market penetration of advanced power solutions, such as modular data centers and intelligent power distribution units, is steadily increasing.
Dominant Regions & Segments in Data Center Power Market
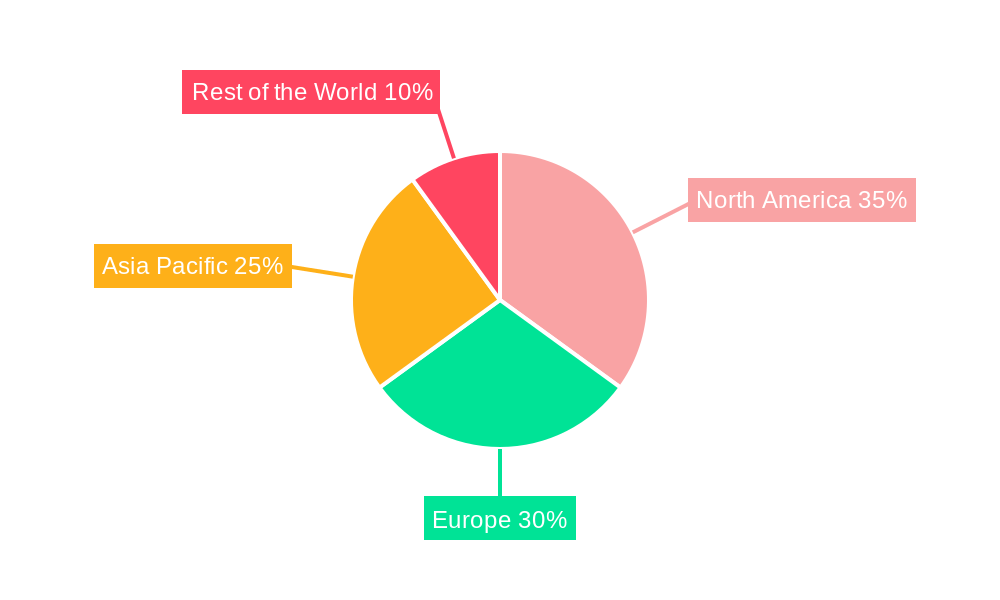
North America currently dominates the Data Center Power Market, driven by high investments in data center infrastructure and technological advancements. However, Asia Pacific is exhibiting the fastest growth rate, fueled by increasing digitalization and economic growth in developing economies.
- By Type: The "Solutions" segment currently holds the largest market share, with a projected value of xx Million in 2025. "Services" is growing rapidly, driven by the increasing need for maintenance and support services.
- By End-user Application: The Information Technology sector is the dominant end-user segment, followed by the BFSI and Manufacturing sectors. Government and Telecom sectors are also exhibiting notable growth.
- By Data Center Size: The Large Data Center segment holds the largest market share due to higher power requirements, but the Small and Medium Data Center segment is growing rapidly, driven by the increasing popularity of edge computing.
Key Drivers:
- North America: High levels of technological advancement, significant investment in data center infrastructure.
- Asia Pacific: Rapid digitalization, economic growth in developing economies, increasing adoption of cloud computing.
- Europe: Strong presence of established players, government initiatives to support digital transformation.
Data Center Power Market Product Innovations
Recent product innovations focus on modularity, energy efficiency, and intelligent control systems. Prefabricated modular data centers, such as Vertiv's SmartMod Max CW, are gaining popularity due to their flexibility, scalability, and reduced deployment time. Intelligent power distribution units (PDUs) with advanced monitoring and control capabilities are also enhancing operational efficiency and reliability. These innovations are driving market growth by addressing the challenges of increasing power density and improving overall data center operations.
Report Scope & Segmentation Analysis
This report segments the Data Center Power Market by Type (Solutions, Services), End-user Application (Information Technology, Manufacturing, BFSI, Government, Telecom, Other), and Data Center Size (Small and Medium, Large). Each segment's growth projections, market sizes, and competitive dynamics are thoroughly analyzed, providing insights into the opportunities and challenges within each segment. The solutions segment is expected to grow at a CAGR of xx% while the services segment is anticipated to witness a CAGR of xx% during the forecast period. The information technology segment is likely to maintain its dominance, driven by continued investments in cloud computing and digital transformation initiatives.
Key Drivers of Data Center Power Market Growth
The Data Center Power Market is driven by several factors, including:
- Growing demand for data storage and processing: Fueled by the rise of big data analytics, cloud computing, and IoT.
- Technological advancements: Improvements in power conversion efficiency, intelligent control systems, and modular data center designs.
- Increasing adoption of renewable energy sources: Driven by growing concerns about environmental sustainability and reducing carbon footprint.
Challenges in the Data Center Power Market Sector
The Data Center Power Market faces challenges such as:
- High upfront investment costs: Associated with deploying advanced power infrastructure.
- Supply chain disruptions: Impacting the availability of critical components and impacting project timelines.
- Stringent regulatory compliance: Requiring companies to meet energy efficiency standards and safety regulations.
Emerging Opportunities in Data Center Power Market
Emerging opportunities include:
- Growth of edge computing: Driving demand for smaller, more efficient data center power solutions.
- Adoption of AI and machine learning: Improving the efficiency and reliability of data center power management.
- Expansion into new markets: Including developing economies with growing data center infrastructure needs.
Leading Players in the Data Center Power Market Market
- ABB Ltd
- Legrand SA
- Fujitsu Ltd
- Vertiv Holdings Co
- Schneider Electric SE
- Rittal GmbH & Co KG
- Schleifenbauer Products BV
- Cisco Technology Inc
- Black Box Corporatio
- PDU Experts UK Ltd
- Eaton Corporation
Key Developments in Data Center Power Market Industry
- November 2023: Vertiv launched the Vertiv SmartMod Max CW, a prefabricated modular data center supporting up to 200kW of IT load, offering customization options and incorporating Liebert EXM UPS systems. This launch directly addresses the growing demand for scalable and efficient data center solutions, particularly in edge computing.
- October 2023: ABB introduced the ABB TruFit power distribution unit, a highly adjustable, all-in-one solution for 50-800 kVA applications. This addresses the need for fast deployment and configurable solutions in rapidly developing data center projects.
Future Outlook for Data Center Power Market Market
The Data Center Power Market is poised for continued strong growth, driven by the increasing demand for data center capacity globally. Technological advancements, including AI-powered optimization and the adoption of renewable energy, will further enhance market expansion. Strategic partnerships, acquisitions, and investments in research and development will shape the competitive landscape, creating opportunities for both established players and emerging companies to gain market share. The focus on sustainability and improved energy efficiency will drive future product innovation and market growth.
Data Center Power Market Segmentation
-
1. Type
-
1.1. Solutions
- 1.1.1. Power Distribution Unit
- 1.1.2. UPS
- 1.1.3. Busway
- 1.1.4. Other Solutions
-
1.2. Services
- 1.2.1. Consulting
- 1.2.2. System Integration
- 1.2.3. Professional Services
-
1.1. Solutions
-
2. End-user Application
- 2.1. Information Technology
- 2.2. Manufacturing
- 2.3. BFSI
- 2.4. Government
- 2.5. Telecom
- 2.6. Other End-user Applications
-
3. Data Center Size
- 3.1. Small and Medium
- 3.2. Large
Data Center Power Market Segmentation By Geography
- 1. North America
- 2. Europe
- 3. Asia
- 4. Australia and New Zealand
- 5. Latin America
- 6. Middle East and Africa
Data Center Power Market REPORT HIGHLIGHTS
| Aspects | Details |
|---|---|
| Study Period | 2019-2033 |
| Base Year | 2024 |
| Estimated Year | 2025 |
| Forecast Period | 2025-2033 |
| Historical Period | 2019-2024 |
| Growth Rate | CAGR of 6.87% from 2019-2033 |
| Segmentation |
|
Table of Contents
- 1. Introduction
- 1.1. Research Scope
- 1.2. Market Segmentation
- 1.3. Research Methodology
- 1.4. Definitions and Assumptions
- 2. Executive Summary
- 2.1. Introduction
- 3. Market Dynamics
- 3.1. Introduction
- 3.2. Market Drivers
- 3.2.1. Rising Adoption of Mega Data Centers and Cloud Computing; Increasing Demand to Reduce Operational Costs
- 3.3. Market Restrains
- 3.3.1. High Cost of Installation and Maintenance
- 3.4. Market Trends
- 3.4.1. UPS to be the Fastest Growing Solution Type
- 4. Market Factor Analysis
- 4.1. Porters Five Forces
- 4.2. Supply/Value Chain
- 4.3. PESTEL analysis
- 4.4. Market Entropy
- 4.5. Patent/Trademark Analysis
- 5. Global Data Center Power Market Analysis, Insights and Forecast, 2019-2031
- 5.1. Market Analysis, Insights and Forecast - by Type
- 5.1.1. Solutions
- 5.1.1.1. Power Distribution Unit
- 5.1.1.2. UPS
- 5.1.1.3. Busway
- 5.1.1.4. Other Solutions
- 5.1.2. Services
- 5.1.2.1. Consulting
- 5.1.2.2. System Integration
- 5.1.2.3. Professional Services
- 5.1.1. Solutions
- 5.2. Market Analysis, Insights and Forecast - by End-user Application
- 5.2.1. Information Technology
- 5.2.2. Manufacturing
- 5.2.3. BFSI
- 5.2.4. Government
- 5.2.5. Telecom
- 5.2.6. Other End-user Applications
- 5.3. Market Analysis, Insights and Forecast - by Data Center Size
- 5.3.1. Small and Medium
- 5.3.2. Large
- 5.4. Market Analysis, Insights and Forecast - by Region
- 5.4.1. North America
- 5.4.2. Europe
- 5.4.3. Asia
- 5.4.4. Australia and New Zealand
- 5.4.5. Latin America
- 5.4.6. Middle East and Africa
- 5.1. Market Analysis, Insights and Forecast - by Type
- 6. North America Data Center Power Market Analysis, Insights and Forecast, 2019-2031
- 6.1. Market Analysis, Insights and Forecast - by Type
- 6.1.1. Solutions
- 6.1.1.1. Power Distribution Unit
- 6.1.1.2. UPS
- 6.1.1.3. Busway
- 6.1.1.4. Other Solutions
- 6.1.2. Services
- 6.1.2.1. Consulting
- 6.1.2.2. System Integration
- 6.1.2.3. Professional Services
- 6.1.1. Solutions
- 6.2. Market Analysis, Insights and Forecast - by End-user Application
- 6.2.1. Information Technology
- 6.2.2. Manufacturing
- 6.2.3. BFSI
- 6.2.4. Government
- 6.2.5. Telecom
- 6.2.6. Other End-user Applications
- 6.3. Market Analysis, Insights and Forecast - by Data Center Size
- 6.3.1. Small and Medium
- 6.3.2. Large
- 6.1. Market Analysis, Insights and Forecast - by Type
- 7. Europe Data Center Power Market Analysis, Insights and Forecast, 2019-2031
- 7.1. Market Analysis, Insights and Forecast - by Type
- 7.1.1. Solutions
- 7.1.1.1. Power Distribution Unit
- 7.1.1.2. UPS
- 7.1.1.3. Busway
- 7.1.1.4. Other Solutions
- 7.1.2. Services
- 7.1.2.1. Consulting
- 7.1.2.2. System Integration
- 7.1.2.3. Professional Services
- 7.1.1. Solutions
- 7.2. Market Analysis, Insights and Forecast - by End-user Application
- 7.2.1. Information Technology
- 7.2.2. Manufacturing
- 7.2.3. BFSI
- 7.2.4. Government
- 7.2.5. Telecom
- 7.2.6. Other End-user Applications
- 7.3. Market Analysis, Insights and Forecast - by Data Center Size
- 7.3.1. Small and Medium
- 7.3.2. Large
- 7.1. Market Analysis, Insights and Forecast - by Type
- 8. Asia Data Center Power Market Analysis, Insights and Forecast, 2019-2031
- 8.1. Market Analysis, Insights and Forecast - by Type
- 8.1.1. Solutions
- 8.1.1.1. Power Distribution Unit
- 8.1.1.2. UPS
- 8.1.1.3. Busway
- 8.1.1.4. Other Solutions
- 8.1.2. Services
- 8.1.2.1. Consulting
- 8.1.2.2. System Integration
- 8.1.2.3. Professional Services
- 8.1.1. Solutions
- 8.2. Market Analysis, Insights and Forecast - by End-user Application
- 8.2.1. Information Technology
- 8.2.2. Manufacturing
- 8.2.3. BFSI
- 8.2.4. Government
- 8.2.5. Telecom
- 8.2.6. Other End-user Applications
- 8.3. Market Analysis, Insights and Forecast - by Data Center Size
- 8.3.1. Small and Medium
- 8.3.2. Large
- 8.1. Market Analysis, Insights and Forecast - by Type
- 9. Australia and New Zealand Data Center Power Market Analysis, Insights and Forecast, 2019-2031
- 9.1. Market Analysis, Insights and Forecast - by Type
- 9.1.1. Solutions
- 9.1.1.1. Power Distribution Unit
- 9.1.1.2. UPS
- 9.1.1.3. Busway
- 9.1.1.4. Other Solutions
- 9.1.2. Services
- 9.1.2.1. Consulting
- 9.1.2.2. System Integration
- 9.1.2.3. Professional Services
- 9.1.1. Solutions
- 9.2. Market Analysis, Insights and Forecast - by End-user Application
- 9.2.1. Information Technology
- 9.2.2. Manufacturing
- 9.2.3. BFSI
- 9.2.4. Government
- 9.2.5. Telecom
- 9.2.6. Other End-user Applications
- 9.3. Market Analysis, Insights and Forecast - by Data Center Size
- 9.3.1. Small and Medium
- 9.3.2. Large
- 9.1. Market Analysis, Insights and Forecast - by Type
- 10. Latin America Data Center Power Market Analysis, Insights and Forecast, 2019-2031
- 10.1. Market Analysis, Insights and Forecast - by Type
- 10.1.1. Solutions
- 10.1.1.1. Power Distribution Unit
- 10.1.1.2. UPS
- 10.1.1.3. Busway
- 10.1.1.4. Other Solutions
- 10.1.2. Services
- 10.1.2.1. Consulting
- 10.1.2.2. System Integration
- 10.1.2.3. Professional Services
- 10.1.1. Solutions
- 10.2. Market Analysis, Insights and Forecast - by End-user Application
- 10.2.1. Information Technology
- 10.2.2. Manufacturing
- 10.2.3. BFSI
- 10.2.4. Government
- 10.2.5. Telecom
- 10.2.6. Other End-user Applications
- 10.3. Market Analysis, Insights and Forecast - by Data Center Size
- 10.3.1. Small and Medium
- 10.3.2. Large
- 10.1. Market Analysis, Insights and Forecast - by Type
- 11. Middle East and Africa Data Center Power Market Analysis, Insights and Forecast, 2019-2031
- 11.1. Market Analysis, Insights and Forecast - by Type
- 11.1.1. Solutions
- 11.1.1.1. Power Distribution Unit
- 11.1.1.2. UPS
- 11.1.1.3. Busway
- 11.1.1.4. Other Solutions
- 11.1.2. Services
- 11.1.2.1. Consulting
- 11.1.2.2. System Integration
- 11.1.2.3. Professional Services
- 11.1.1. Solutions
- 11.2. Market Analysis, Insights and Forecast - by End-user Application
- 11.2.1. Information Technology
- 11.2.2. Manufacturing
- 11.2.3. BFSI
- 11.2.4. Government
- 11.2.5. Telecom
- 11.2.6. Other End-user Applications
- 11.3. Market Analysis, Insights and Forecast - by Data Center Size
- 11.3.1. Small and Medium
- 11.3.2. Large
- 11.1. Market Analysis, Insights and Forecast - by Type
- 12. North America Data Center Power Market Analysis, Insights and Forecast, 2019-2031
- 12.1. Market Analysis, Insights and Forecast - By Country/Sub-region
- 12.1.1.
- 13. Europe Data Center Power Market Analysis, Insights and Forecast, 2019-2031
- 13.1. Market Analysis, Insights and Forecast - By Country/Sub-region
- 13.1.1.
- 14. Asia Pacific Data Center Power Market Analysis, Insights and Forecast, 2019-2031
- 14.1. Market Analysis, Insights and Forecast - By Country/Sub-region
- 14.1.1.
- 15. Rest of the World Data Center Power Market Analysis, Insights and Forecast, 2019-2031
- 15.1. Market Analysis, Insights and Forecast - By Country/Sub-region
- 15.1.1.
- 16. Competitive Analysis
- 16.1. Global Market Share Analysis 2024
- 16.2. Company Profiles
- 16.2.1 ABB Ltd
- 16.2.1.1. Overview
- 16.2.1.2. Products
- 16.2.1.3. SWOT Analysis
- 16.2.1.4. Recent Developments
- 16.2.1.5. Financials (Based on Availability)
- 16.2.2 Legrand SA
- 16.2.2.1. Overview
- 16.2.2.2. Products
- 16.2.2.3. SWOT Analysis
- 16.2.2.4. Recent Developments
- 16.2.2.5. Financials (Based on Availability)
- 16.2.3 Fujitsu Ltd
- 16.2.3.1. Overview
- 16.2.3.2. Products
- 16.2.3.3. SWOT Analysis
- 16.2.3.4. Recent Developments
- 16.2.3.5. Financials (Based on Availability)
- 16.2.4 Vertiv Holdings Co
- 16.2.4.1. Overview
- 16.2.4.2. Products
- 16.2.4.3. SWOT Analysis
- 16.2.4.4. Recent Developments
- 16.2.4.5. Financials (Based on Availability)
- 16.2.5 Schneider Electric SE
- 16.2.5.1. Overview
- 16.2.5.2. Products
- 16.2.5.3. SWOT Analysis
- 16.2.5.4. Recent Developments
- 16.2.5.5. Financials (Based on Availability)
- 16.2.6 Rittal GmbH & Co KG
- 16.2.6.1. Overview
- 16.2.6.2. Products
- 16.2.6.3. SWOT Analysis
- 16.2.6.4. Recent Developments
- 16.2.6.5. Financials (Based on Availability)
- 16.2.7 Schleifenbauer Products BV
- 16.2.7.1. Overview
- 16.2.7.2. Products
- 16.2.7.3. SWOT Analysis
- 16.2.7.4. Recent Developments
- 16.2.7.5. Financials (Based on Availability)
- 16.2.8 Cisco Technology Inc
- 16.2.8.1. Overview
- 16.2.8.2. Products
- 16.2.8.3. SWOT Analysis
- 16.2.8.4. Recent Developments
- 16.2.8.5. Financials (Based on Availability)
- 16.2.9 Black Box Corporatio
- 16.2.9.1. Overview
- 16.2.9.2. Products
- 16.2.9.3. SWOT Analysis
- 16.2.9.4. Recent Developments
- 16.2.9.5. Financials (Based on Availability)
- 16.2.10 PDU Experts UK Ltd
- 16.2.10.1. Overview
- 16.2.10.2. Products
- 16.2.10.3. SWOT Analysis
- 16.2.10.4. Recent Developments
- 16.2.10.5. Financials (Based on Availability)
- 16.2.11 Eaton Corporation
- 16.2.11.1. Overview
- 16.2.11.2. Products
- 16.2.11.3. SWOT Analysis
- 16.2.11.4. Recent Developments
- 16.2.11.5. Financials (Based on Availability)
- 16.2.1 ABB Ltd
List of Figures
- Figure 1: Global Data Center Power Market Revenue Breakdown (Million, %) by Region 2024 & 2032
- Figure 2: North America Data Center Power Market Revenue (Million), by Country 2024 & 2032
- Figure 3: North America Data Center Power Market Revenue Share (%), by Country 2024 & 2032
- Figure 4: Europe Data Center Power Market Revenue (Million), by Country 2024 & 2032
- Figure 5: Europe Data Center Power Market Revenue Share (%), by Country 2024 & 2032
- Figure 6: Asia Pacific Data Center Power Market Revenue (Million), by Country 2024 & 2032
- Figure 7: Asia Pacific Data Center Power Market Revenue Share (%), by Country 2024 & 2032
- Figure 8: Rest of the World Data Center Power Market Revenue (Million), by Country 2024 & 2032
- Figure 9: Rest of the World Data Center Power Market Revenue Share (%), by Country 2024 & 2032
- Figure 10: North America Data Center Power Market Revenue (Million), by Type 2024 & 2032
- Figure 11: North America Data Center Power Market Revenue Share (%), by Type 2024 & 2032
- Figure 12: North America Data Center Power Market Revenue (Million), by End-user Application 2024 & 2032
- Figure 13: North America Data Center Power Market Revenue Share (%), by End-user Application 2024 & 2032
- Figure 14: North America Data Center Power Market Revenue (Million), by Data Center Size 2024 & 2032
- Figure 15: North America Data Center Power Market Revenue Share (%), by Data Center Size 2024 & 2032
- Figure 16: North America Data Center Power Market Revenue (Million), by Country 2024 & 2032
- Figure 17: North America Data Center Power Market Revenue Share (%), by Country 2024 & 2032
- Figure 18: Europe Data Center Power Market Revenue (Million), by Type 2024 & 2032
- Figure 19: Europe Data Center Power Market Revenue Share (%), by Type 2024 & 2032
- Figure 20: Europe Data Center Power Market Revenue (Million), by End-user Application 2024 & 2032
- Figure 21: Europe Data Center Power Market Revenue Share (%), by End-user Application 2024 & 2032
- Figure 22: Europe Data Center Power Market Revenue (Million), by Data Center Size 2024 & 2032
- Figure 23: Europe Data Center Power Market Revenue Share (%), by Data Center Size 2024 & 2032
- Figure 24: Europe Data Center Power Market Revenue (Million), by Country 2024 & 2032
- Figure 25: Europe Data Center Power Market Revenue Share (%), by Country 2024 & 2032
- Figure 26: Asia Data Center Power Market Revenue (Million), by Type 2024 & 2032
- Figure 27: Asia Data Center Power Market Revenue Share (%), by Type 2024 & 2032
- Figure 28: Asia Data Center Power Market Revenue (Million), by End-user Application 2024 & 2032
- Figure 29: Asia Data Center Power Market Revenue Share (%), by End-user Application 2024 & 2032
- Figure 30: Asia Data Center Power Market Revenue (Million), by Data Center Size 2024 & 2032
- Figure 31: Asia Data Center Power Market Revenue Share (%), by Data Center Size 2024 & 2032
- Figure 32: Asia Data Center Power Market Revenue (Million), by Country 2024 & 2032
- Figure 33: Asia Data Center Power Market Revenue Share (%), by Country 2024 & 2032
- Figure 34: Australia and New Zealand Data Center Power Market Revenue (Million), by Type 2024 & 2032
- Figure 35: Australia and New Zealand Data Center Power Market Revenue Share (%), by Type 2024 & 2032
- Figure 36: Australia and New Zealand Data Center Power Market Revenue (Million), by End-user Application 2024 & 2032
- Figure 37: Australia and New Zealand Data Center Power Market Revenue Share (%), by End-user Application 2024 & 2032
- Figure 38: Australia and New Zealand Data Center Power Market Revenue (Million), by Data Center Size 2024 & 2032
- Figure 39: Australia and New Zealand Data Center Power Market Revenue Share (%), by Data Center Size 2024 & 2032
- Figure 40: Australia and New Zealand Data Center Power Market Revenue (Million), by Country 2024 & 2032
- Figure 41: Australia and New Zealand Data Center Power Market Revenue Share (%), by Country 2024 & 2032
- Figure 42: Latin America Data Center Power Market Revenue (Million), by Type 2024 & 2032
- Figure 43: Latin America Data Center Power Market Revenue Share (%), by Type 2024 & 2032
- Figure 44: Latin America Data Center Power Market Revenue (Million), by End-user Application 2024 & 2032
- Figure 45: Latin America Data Center Power Market Revenue Share (%), by End-user Application 2024 & 2032
- Figure 46: Latin America Data Center Power Market Revenue (Million), by Data Center Size 2024 & 2032
- Figure 47: Latin America Data Center Power Market Revenue Share (%), by Data Center Size 2024 & 2032
- Figure 48: Latin America Data Center Power Market Revenue (Million), by Country 2024 & 2032
- Figure 49: Latin America Data Center Power Market Revenue Share (%), by Country 2024 & 2032
- Figure 50: Middle East and Africa Data Center Power Market Revenue (Million), by Type 2024 & 2032
- Figure 51: Middle East and Africa Data Center Power Market Revenue Share (%), by Type 2024 & 2032
- Figure 52: Middle East and Africa Data Center Power Market Revenue (Million), by End-user Application 2024 & 2032
- Figure 53: Middle East and Africa Data Center Power Market Revenue Share (%), by End-user Application 2024 & 2032
- Figure 54: Middle East and Africa Data Center Power Market Revenue (Million), by Data Center Size 2024 & 2032
- Figure 55: Middle East and Africa Data Center Power Market Revenue Share (%), by Data Center Size 2024 & 2032
- Figure 56: Middle East and Africa Data Center Power Market Revenue (Million), by Country 2024 & 2032
- Figure 57: Middle East and Africa Data Center Power Market Revenue Share (%), by Country 2024 & 2032
List of Tables
- Table 1: Global Data Center Power Market Revenue Million Forecast, by Region 2019 & 2032
- Table 2: Global Data Center Power Market Revenue Million Forecast, by Type 2019 & 2032
- Table 3: Global Data Center Power Market Revenue Million Forecast, by End-user Application 2019 & 2032
- Table 4: Global Data Center Power Market Revenue Million Forecast, by Data Center Size 2019 & 2032
- Table 5: Global Data Center Power Market Revenue Million Forecast, by Region 2019 & 2032
- Table 6: Global Data Center Power Market Revenue Million Forecast, by Country 2019 & 2032
- Table 7: Data Center Power Market Revenue (Million) Forecast, by Application 2019 & 2032
- Table 8: Global Data Center Power Market Revenue Million Forecast, by Country 2019 & 2032
- Table 9: Data Center Power Market Revenue (Million) Forecast, by Application 2019 & 2032
- Table 10: Global Data Center Power Market Revenue Million Forecast, by Country 2019 & 2032
- Table 11: Data Center Power Market Revenue (Million) Forecast, by Application 2019 & 2032
- Table 12: Global Data Center Power Market Revenue Million Forecast, by Country 2019 & 2032
- Table 13: Data Center Power Market Revenue (Million) Forecast, by Application 2019 & 2032
- Table 14: Global Data Center Power Market Revenue Million Forecast, by Type 2019 & 2032
- Table 15: Global Data Center Power Market Revenue Million Forecast, by End-user Application 2019 & 2032
- Table 16: Global Data Center Power Market Revenue Million Forecast, by Data Center Size 2019 & 2032
- Table 17: Global Data Center Power Market Revenue Million Forecast, by Country 2019 & 2032
- Table 18: Global Data Center Power Market Revenue Million Forecast, by Type 2019 & 2032
- Table 19: Global Data Center Power Market Revenue Million Forecast, by End-user Application 2019 & 2032
- Table 20: Global Data Center Power Market Revenue Million Forecast, by Data Center Size 2019 & 2032
- Table 21: Global Data Center Power Market Revenue Million Forecast, by Country 2019 & 2032
- Table 22: Global Data Center Power Market Revenue Million Forecast, by Type 2019 & 2032
- Table 23: Global Data Center Power Market Revenue Million Forecast, by End-user Application 2019 & 2032
- Table 24: Global Data Center Power Market Revenue Million Forecast, by Data Center Size 2019 & 2032
- Table 25: Global Data Center Power Market Revenue Million Forecast, by Country 2019 & 2032
- Table 26: Global Data Center Power Market Revenue Million Forecast, by Type 2019 & 2032
- Table 27: Global Data Center Power Market Revenue Million Forecast, by End-user Application 2019 & 2032
- Table 28: Global Data Center Power Market Revenue Million Forecast, by Data Center Size 2019 & 2032
- Table 29: Global Data Center Power Market Revenue Million Forecast, by Country 2019 & 2032
- Table 30: Global Data Center Power Market Revenue Million Forecast, by Type 2019 & 2032
- Table 31: Global Data Center Power Market Revenue Million Forecast, by End-user Application 2019 & 2032
- Table 32: Global Data Center Power Market Revenue Million Forecast, by Data Center Size 2019 & 2032
- Table 33: Global Data Center Power Market Revenue Million Forecast, by Country 2019 & 2032
- Table 34: Global Data Center Power Market Revenue Million Forecast, by Type 2019 & 2032
- Table 35: Global Data Center Power Market Revenue Million Forecast, by End-user Application 2019 & 2032
- Table 36: Global Data Center Power Market Revenue Million Forecast, by Data Center Size 2019 & 2032
- Table 37: Global Data Center Power Market Revenue Million Forecast, by Country 2019 & 2032
Frequently Asked Questions
1. What is the projected Compound Annual Growth Rate (CAGR) of the Data Center Power Market?
The projected CAGR is approximately 6.87%.
2. Which companies are prominent players in the Data Center Power Market?
Key companies in the market include ABB Ltd, Legrand SA, Fujitsu Ltd, Vertiv Holdings Co, Schneider Electric SE, Rittal GmbH & Co KG, Schleifenbauer Products BV, Cisco Technology Inc, Black Box Corporatio, PDU Experts UK Ltd, Eaton Corporation.
3. What are the main segments of the Data Center Power Market?
The market segments include Type, End-user Application, Data Center Size.
4. Can you provide details about the market size?
The market size is estimated to be USD 24.33 Million as of 2022.
5. What are some drivers contributing to market growth?
Rising Adoption of Mega Data Centers and Cloud Computing; Increasing Demand to Reduce Operational Costs.
6. What are the notable trends driving market growth?
UPS to be the Fastest Growing Solution Type.
7. Are there any restraints impacting market growth?
High Cost of Installation and Maintenance.
8. Can you provide examples of recent developments in the market?
November 2023: Vertiv introduced Vertiv SmartMod Max CW, a prefabricated modular data center designed to address the increasing demand. The solution supports up to 200kW of total IT load in a single system. It presents a range of customization options, including power capacities, number of racks and rack sizes, and module dimensions. Vertiv SmartMod Max CW incorporates Vertiv Liebert EXM uninterruptible power supply (UPS) system in 100 kW, 150 kW, and 200 kW power ratings and thermal management units with intelligent controls, enabling small-scale operations, like edge data centers, to meet their specific requirements.
9. What pricing options are available for accessing the report?
Pricing options include single-user, multi-user, and enterprise licenses priced at USD 4750, USD 5250, and USD 8750 respectively.
10. Is the market size provided in terms of value or volume?
The market size is provided in terms of value, measured in Million.
11. Are there any specific market keywords associated with the report?
Yes, the market keyword associated with the report is "Data Center Power Market," which aids in identifying and referencing the specific market segment covered.
12. How do I determine which pricing option suits my needs best?
The pricing options vary based on user requirements and access needs. Individual users may opt for single-user licenses, while businesses requiring broader access may choose multi-user or enterprise licenses for cost-effective access to the report.
13. Are there any additional resources or data provided in the Data Center Power Market report?
While the report offers comprehensive insights, it's advisable to review the specific contents or supplementary materials provided to ascertain if additional resources or data are available.
14. How can I stay updated on further developments or reports in the Data Center Power Market?
To stay informed about further developments, trends, and reports in the Data Center Power Market, consider subscribing to industry newsletters, following relevant companies and organizations, or regularly checking reputable industry news sources and publications.
Methodology
Step 1 - Identification of Relevant Samples Size from Population Database


Step 2 - Approaches for Defining Global Market Size (Value, Volume* & Price*)

Note*: In applicable scenarios
Step 3 - Data Sources
Primary Research
- Web Analytics
- Survey Reports
- Research Institute
- Latest Research Reports
- Opinion Leaders
Secondary Research
- Annual Reports
- White Paper
- Latest Press Release
- Industry Association
- Paid Database
- Investor Presentations

Step 4 - Data Triangulation
Involves using different sources of information in order to increase the validity of a study
These sources are likely to be stakeholders in a program - participants, other researchers, program staff, other community members, and so on.
Then we put all data in single framework & apply various statistical tools to find out the dynamic on the market.
During the analysis stage, feedback from the stakeholder groups would be compared to determine areas of agreement as well as areas of divergence


