
Key Insights
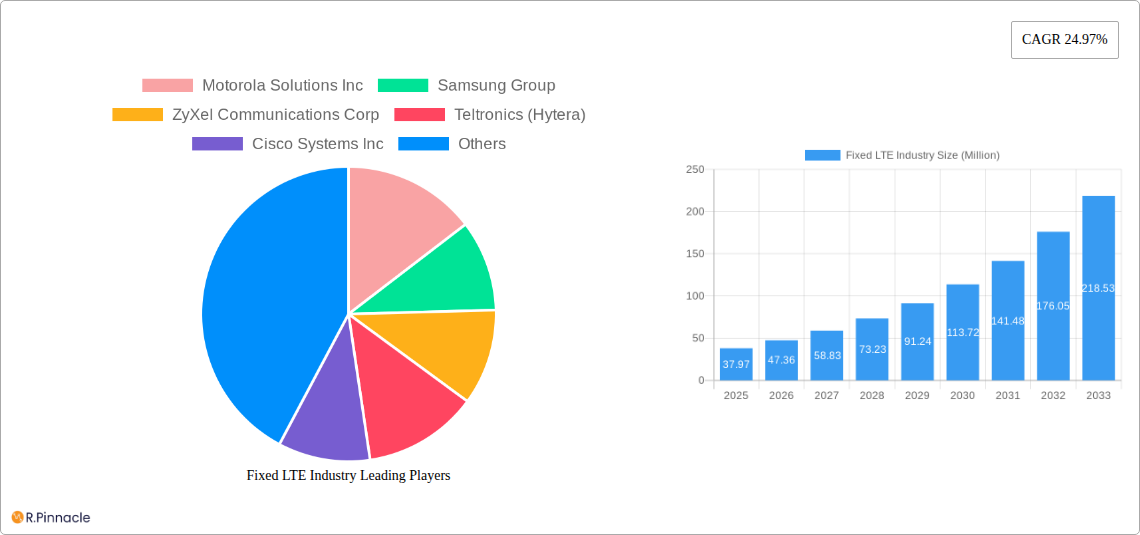
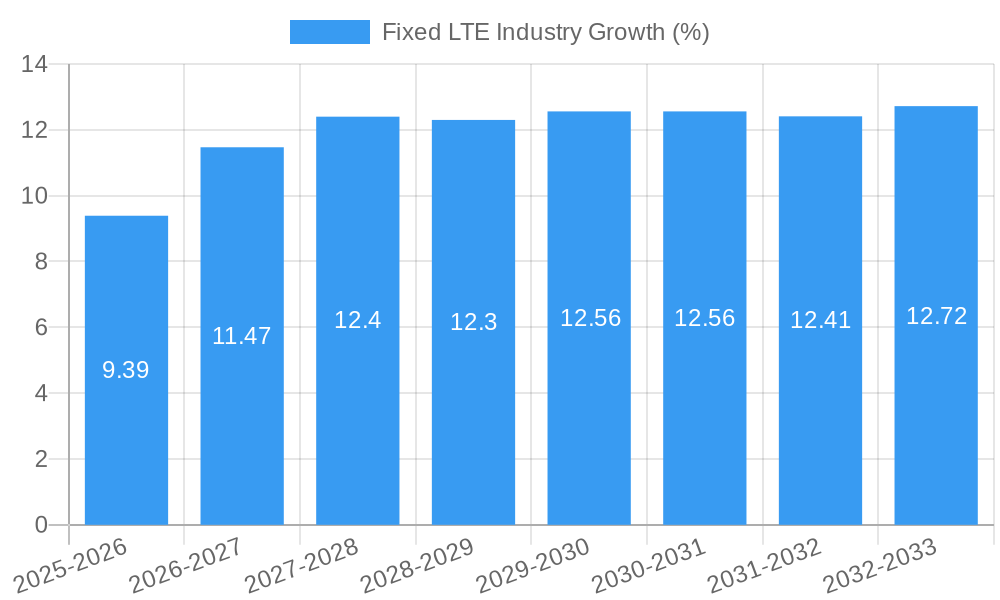
The Fixed LTE market, valued at $37.97 million in 2025, is experiencing robust growth, projected to expand significantly by 2033. A Compound Annual Growth Rate (CAGR) of 24.97% indicates a rapidly expanding market driven by several key factors. The increasing demand for reliable high-speed internet access in both residential and commercial sectors fuels this expansion. The proliferation of smart devices and the rise of applications requiring high bandwidth, such as video streaming and online gaming, are significant contributors. Furthermore, the cost-effectiveness and ease of deployment of Fixed LTE solutions compared to traditional wired broadband infrastructure are compelling advantages, particularly in underserved areas and regions with limited existing network infrastructure. The market is segmented by user type (residential and commercial) and solution type (LTE infrastructure and other solutions including indoor and outdoor CPE). Competition is fierce amongst major players including Motorola Solutions, Samsung, ZyXel, and Huawei, leading to continuous innovation and competitive pricing, further boosting market penetration.
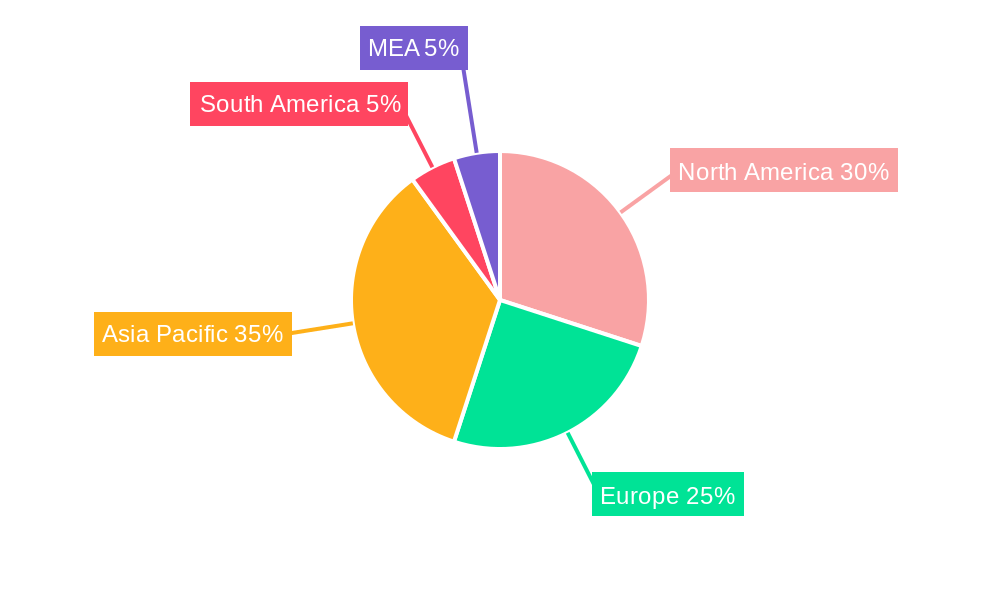
Market growth is expected to be particularly strong in regions with rapidly expanding digital economies and increasing internet penetration. Asia Pacific, with its large and growing population base and significant investments in infrastructure development, is poised for substantial growth. North America, already a mature market, will continue to see growth driven by upgrades to existing infrastructure and the adoption of advanced LTE technologies. However, potential restraints include the emergence of competing technologies like 5G Fixed Wireless Access (FWA) and the varying regulatory landscapes across different regions. The continued expansion of 5G networks could present a challenge, but Fixed LTE will likely maintain relevance in specific niche applications and underserved areas where 5G deployment is slower or economically less viable. The overall outlook for the Fixed LTE market remains positive, with considerable growth potential over the forecast period (2025-2033).
Fixed LTE Industry Market Report: 2019-2033
This comprehensive report provides an in-depth analysis of the Fixed LTE industry, offering invaluable insights for industry professionals, investors, and strategic decision-makers. With a study period spanning 2019-2033, a base year of 2025, and a forecast period of 2025-2033, this report unveils the market's current state and future trajectory. The report analyzes market size (in Millions), CAGR, market share, and key developments, focusing on segments like residential and commercial users, LTE infrastructure, and other solutions (indoor/outdoor CPE). Major players like Motorola Solutions Inc, Samsung Group, and Huawei Technologies Co Ltd are profiled, offering a complete overview of the competitive landscape.
Fixed LTE Industry Market Structure & Innovation Trends
The Fixed LTE market exhibits a moderately concentrated structure, with a few major players holding significant market share. Motorola Solutions Inc., Samsung Group, and Huawei Technologies Co Ltd. collectively account for an estimated xx% of the global market in 2025. Innovation is driven primarily by the need for higher bandwidth, lower latency, and improved network reliability, leading to the development of advanced LTE infrastructure and CPE solutions. Regulatory frameworks vary across regions, impacting market entry and competition. Product substitutes include fixed-line broadband and fiber optics, although Fixed LTE offers advantages in terms of deployment speed and cost-effectiveness in certain scenarios. The end-user demographics are shifting towards a greater proportion of commercial users, driven by increasing adoption in enterprise networks and industrial IoT applications. Mergers and acquisitions (M&A) activity has been moderate, with deal values estimated at xx Million in 2024, primarily focused on strengthening market position and technological capabilities.
- Market Concentration: xx% controlled by top 3 players in 2025 (estimated).
- Innovation Drivers: Higher bandwidth, lower latency, improved reliability.
- Regulatory Landscape: Varies significantly across geographies.
- M&A Activity (2024): Estimated value of xx Million.
Fixed LTE Industry Market Dynamics & Trends
The Fixed LTE market is experiencing robust growth, with a projected CAGR of xx% during the forecast period (2025-2033). This growth is driven by several key factors: increasing demand for high-speed internet access in both residential and commercial sectors, expanding network coverage in underserved areas, and the growing adoption of IoT devices. Technological disruptions, such as the development of 5G and advanced LTE technologies, are further fueling market growth. Consumer preferences are shifting towards more flexible and cost-effective data plans, while competitive dynamics are characterized by intense competition among established players and the emergence of new entrants. Market penetration is expected to reach xx% by 2033 in major economies.
Dominant Regions & Segments in Fixed LTE Industry
The North American region is expected to dominate the Fixed LTE market throughout the forecast period. Strong economic growth, advanced infrastructure, and high internet penetration rates contribute to this dominance. Within segments, the commercial sector exhibits faster growth than the residential sector due to the expanding adoption of Fixed LTE in enterprise networks and industrial IoT applications. Among solution types, LTE infrastructure dominates, although the market for other solutions, particularly outdoor CPE, is growing rapidly.
- Key Drivers for North American Dominance:
- Strong economic growth and high disposable incomes.
- Well-developed telecommunications infrastructure.
- High internet penetration rates.
- Key Drivers for Commercial Sector Growth:
- Rising adoption of IoT devices and enterprise networks.
- Need for reliable, high-speed connectivity for business operations.
- Key Drivers for Outdoor CPE Growth:
- Expanding network coverage in rural and remote areas.
- Increasing demand for reliable connectivity for outdoor applications.
Fixed LTE Industry Product Innovations
Recent innovations in Fixed LTE technology focus on enhancing network capacity, improving spectral efficiency, and reducing latency. This includes the development of advanced antenna technologies, improved modulation schemes, and more efficient power amplifiers. These innovations provide competitive advantages by offering higher data rates, greater coverage, and enhanced network reliability, addressing specific market needs for increased bandwidth and improved connectivity in various applications.
Report Scope & Segmentation Analysis
This report segments the Fixed LTE market by type of user (residential and commercial) and by type of solution (LTE infrastructure and other solution types, including indoor and outdoor CPE). The residential segment is projected to reach a market size of xx Million by 2033, driven by growing demand for high-speed internet access. The commercial segment is expected to grow at a faster CAGR due to increasing adoption in enterprise networks and IoT applications. The LTE infrastructure segment is expected to remain the largest segment, driven by continuous infrastructure development, while other solution types are experiencing growth due to expanding application areas.
Key Drivers of Fixed LTE Industry Growth
Several factors are driving growth in the Fixed LTE industry. Technological advancements, such as improved LTE technologies and the emergence of 5G, are enhancing network performance and capacity. Economic growth in developing countries is fueling demand for increased internet access. Government initiatives to expand broadband coverage are creating favorable market conditions. The increasing adoption of IoT devices and enterprise networks further propels market growth.
Challenges in the Fixed LTE Industry Sector
The Fixed LTE industry faces several challenges. Regulatory hurdles in some regions can restrict market entry and deployment. Supply chain disruptions can impact the availability of components and equipment. Intense competition from established players and new entrants can squeeze profit margins. These factors can affect profitability and hinder market growth, creating an uncertain environment for companies.
Emerging Opportunities in Fixed LTE Industry
Emerging opportunities exist in expanding Fixed LTE services into underserved rural areas, providing reliable connectivity for critical infrastructure, and exploring the integration of Fixed LTE with other technologies, like satellite communication. The growing demand for private LTE networks in industries such as manufacturing and transportation presents significant opportunities. Innovative business models, such as bundling Fixed LTE services with other offerings, can also enhance market reach and create new revenue streams.
Leading Players in the Fixed LTE Industry Market
- Motorola Solutions Inc
- Samsung Group
- ZyXel Communications Corp
- Teltronics (Hytera)
- Cisco Systems Inc
- L-com Global Connectivity
- Netgear Inc
- Sagemcom SAS
- Telenet Systems Pvt Ltd
- Huawei Technologies Co Ltd
- ZTE Corporation
- Aztech Group Ltd
- Arris International PLC
- Telrad Networks Ltd
- Shenzhen Zoolan Technology Co Ltd
- AT&T Inc
- Technicolor SA
- Datang Telecom Technology & Industry Group
- Telefonica SA
Key Developments in Fixed LTE Industry
- December 2022: South African-based Huge group launched Fixed LTE services for SMEs, targeting work-from-home and large organizations, with an existing customer base of 19,000 businesses.
- November 2022: Chile's San Antonio Terminal Internacional (STI) considered implementing Nokia's industrial-grade LTE network for enhanced connectivity across its 31-hectare area, increasing data transmission speed fivefold.
- October 2022: Nxtdigital introduced NXTSkyFi, a broadband-over-satellite (BOS) solution in Twang, Arunachal Pradesh, India, aiming to expand across the subcontinent for improved crop management data access.
Future Outlook for Fixed LTE Industry Market
The Fixed LTE market is poised for continued growth, driven by ongoing technological advancements, increasing demand for high-speed internet access, and the expansion of IoT applications. Strategic opportunities lie in providing innovative solutions, expanding into new markets, and fostering partnerships to enhance market penetration and create new revenue streams. The market's future potential is significant, with substantial growth anticipated in the coming years.
Fixed LTE Industry Segmentation
-
1. Type of User
- 1.1. Residential
- 1.2. Commercial
-
2. Type of Solution
- 2.1. LTE Infrastructure
- 2.2. Other Solution Types (Indoor CPE, Outdoor CPE)
Fixed LTE Industry Segmentation By Geography
-
1. North America
- 1.1. United States
- 1.2. Canada
-
2. Europe
- 2.1. United Kingdom
- 2.2. Germany
- 2.3. France
- 2.4. Rest of the Europe
-
3. Asia Pacific
- 3.1. China
- 3.2. Japan
- 3.3. India
- 3.4. Rest of the Asia Pacific
- 4. Latin America
- 5. Middle East and Africa
Fixed LTE Industry REPORT HIGHLIGHTS
| Aspects | Details |
|---|---|
| Study Period | 2019-2033 |
| Base Year | 2024 |
| Estimated Year | 2025 |
| Forecast Period | 2025-2033 |
| Historical Period | 2019-2024 |
| Growth Rate | CAGR of 24.97% from 2019-2033 |
| Segmentation |
|
Table of Contents
- 1. Introduction
- 1.1. Research Scope
- 1.2. Market Segmentation
- 1.3. Research Methodology
- 1.4. Definitions and Assumptions
- 2. Executive Summary
- 2.1. Introduction
- 3. Market Dynamics
- 3.1. Introduction
- 3.2. Market Drivers
- 3.2.1 Increased Adoption of Public Safety LTE.; Growing Demand For High Speed BroadBand In Rural Areas; Positive Outlook of Fixed LTE Compared to DSL
- 3.2.2 Fiber and Cable
- 3.3. Market Restrains
- 3.3.1. Network Performance Concerns
- 3.4. Market Trends
- 3.4.1. Residential Type of User Expected to Account for Significant Share
- 4. Market Factor Analysis
- 4.1. Porters Five Forces
- 4.2. Supply/Value Chain
- 4.3. PESTEL analysis
- 4.4. Market Entropy
- 4.5. Patent/Trademark Analysis
- 5. Global Fixed LTE Industry Analysis, Insights and Forecast, 2019-2031
- 5.1. Market Analysis, Insights and Forecast - by Type of User
- 5.1.1. Residential
- 5.1.2. Commercial
- 5.2. Market Analysis, Insights and Forecast - by Type of Solution
- 5.2.1. LTE Infrastructure
- 5.2.2. Other Solution Types (Indoor CPE, Outdoor CPE)
- 5.3. Market Analysis, Insights and Forecast - by Region
- 5.3.1. North America
- 5.3.2. Europe
- 5.3.3. Asia Pacific
- 5.3.4. Latin America
- 5.3.5. Middle East and Africa
- 5.1. Market Analysis, Insights and Forecast - by Type of User
- 6. North America Fixed LTE Industry Analysis, Insights and Forecast, 2019-2031
- 6.1. Market Analysis, Insights and Forecast - by Type of User
- 6.1.1. Residential
- 6.1.2. Commercial
- 6.2. Market Analysis, Insights and Forecast - by Type of Solution
- 6.2.1. LTE Infrastructure
- 6.2.2. Other Solution Types (Indoor CPE, Outdoor CPE)
- 6.1. Market Analysis, Insights and Forecast - by Type of User
- 7. Europe Fixed LTE Industry Analysis, Insights and Forecast, 2019-2031
- 7.1. Market Analysis, Insights and Forecast - by Type of User
- 7.1.1. Residential
- 7.1.2. Commercial
- 7.2. Market Analysis, Insights and Forecast - by Type of Solution
- 7.2.1. LTE Infrastructure
- 7.2.2. Other Solution Types (Indoor CPE, Outdoor CPE)
- 7.1. Market Analysis, Insights and Forecast - by Type of User
- 8. Asia Pacific Fixed LTE Industry Analysis, Insights and Forecast, 2019-2031
- 8.1. Market Analysis, Insights and Forecast - by Type of User
- 8.1.1. Residential
- 8.1.2. Commercial
- 8.2. Market Analysis, Insights and Forecast - by Type of Solution
- 8.2.1. LTE Infrastructure
- 8.2.2. Other Solution Types (Indoor CPE, Outdoor CPE)
- 8.1. Market Analysis, Insights and Forecast - by Type of User
- 9. Latin America Fixed LTE Industry Analysis, Insights and Forecast, 2019-2031
- 9.1. Market Analysis, Insights and Forecast - by Type of User
- 9.1.1. Residential
- 9.1.2. Commercial
- 9.2. Market Analysis, Insights and Forecast - by Type of Solution
- 9.2.1. LTE Infrastructure
- 9.2.2. Other Solution Types (Indoor CPE, Outdoor CPE)
- 9.1. Market Analysis, Insights and Forecast - by Type of User
- 10. Middle East and Africa Fixed LTE Industry Analysis, Insights and Forecast, 2019-2031
- 10.1. Market Analysis, Insights and Forecast - by Type of User
- 10.1.1. Residential
- 10.1.2. Commercial
- 10.2. Market Analysis, Insights and Forecast - by Type of Solution
- 10.2.1. LTE Infrastructure
- 10.2.2. Other Solution Types (Indoor CPE, Outdoor CPE)
- 10.1. Market Analysis, Insights and Forecast - by Type of User
- 11. North America Fixed LTE Industry Analysis, Insights and Forecast, 2019-2031
- 11.1. Market Analysis, Insights and Forecast - By Country/Sub-region
- 11.1.1 United States
- 11.1.2 Canada
- 11.1.3 Mexico
- 12. Europe Fixed LTE Industry Analysis, Insights and Forecast, 2019-2031
- 12.1. Market Analysis, Insights and Forecast - By Country/Sub-region
- 12.1.1 Germany
- 12.1.2 United Kingdom
- 12.1.3 France
- 12.1.4 Spain
- 12.1.5 Italy
- 12.1.6 Spain
- 12.1.7 Belgium
- 12.1.8 Netherland
- 12.1.9 Nordics
- 12.1.10 Rest of Europe
- 13. Asia Pacific Fixed LTE Industry Analysis, Insights and Forecast, 2019-2031
- 13.1. Market Analysis, Insights and Forecast - By Country/Sub-region
- 13.1.1 China
- 13.1.2 Japan
- 13.1.3 India
- 13.1.4 South Korea
- 13.1.5 Southeast Asia
- 13.1.6 Australia
- 13.1.7 Indonesia
- 13.1.8 Phillipes
- 13.1.9 Singapore
- 13.1.10 Thailandc
- 13.1.11 Rest of Asia Pacific
- 14. South America Fixed LTE Industry Analysis, Insights and Forecast, 2019-2031
- 14.1. Market Analysis, Insights and Forecast - By Country/Sub-region
- 14.1.1 Brazil
- 14.1.2 Argentina
- 14.1.3 Peru
- 14.1.4 Chile
- 14.1.5 Colombia
- 14.1.6 Ecuador
- 14.1.7 Venezuela
- 14.1.8 Rest of South America
- 15. North America Fixed LTE Industry Analysis, Insights and Forecast, 2019-2031
- 15.1. Market Analysis, Insights and Forecast - By Country/Sub-region
- 15.1.1 United States
- 15.1.2 Canada
- 15.1.3 Mexico
- 16. MEA Fixed LTE Industry Analysis, Insights and Forecast, 2019-2031
- 16.1. Market Analysis, Insights and Forecast - By Country/Sub-region
- 16.1.1 United Arab Emirates
- 16.1.2 Saudi Arabia
- 16.1.3 South Africa
- 16.1.4 Rest of Middle East and Africa
- 17. Competitive Analysis
- 17.1. Global Market Share Analysis 2024
- 17.2. Company Profiles
- 17.2.1 Motorola Solutions Inc
- 17.2.1.1. Overview
- 17.2.1.2. Products
- 17.2.1.3. SWOT Analysis
- 17.2.1.4. Recent Developments
- 17.2.1.5. Financials (Based on Availability)
- 17.2.2 Samsung Group
- 17.2.2.1. Overview
- 17.2.2.2. Products
- 17.2.2.3. SWOT Analysis
- 17.2.2.4. Recent Developments
- 17.2.2.5. Financials (Based on Availability)
- 17.2.3 ZyXel Communications Corp
- 17.2.3.1. Overview
- 17.2.3.2. Products
- 17.2.3.3. SWOT Analysis
- 17.2.3.4. Recent Developments
- 17.2.3.5. Financials (Based on Availability)
- 17.2.4 Teltronics (Hytera)
- 17.2.4.1. Overview
- 17.2.4.2. Products
- 17.2.4.3. SWOT Analysis
- 17.2.4.4. Recent Developments
- 17.2.4.5. Financials (Based on Availability)
- 17.2.5 Cisco Systems Inc
- 17.2.5.1. Overview
- 17.2.5.2. Products
- 17.2.5.3. SWOT Analysis
- 17.2.5.4. Recent Developments
- 17.2.5.5. Financials (Based on Availability)
- 17.2.6 L-com Global Connectivity
- 17.2.6.1. Overview
- 17.2.6.2. Products
- 17.2.6.3. SWOT Analysis
- 17.2.6.4. Recent Developments
- 17.2.6.5. Financials (Based on Availability)
- 17.2.7 Netgear Inc
- 17.2.7.1. Overview
- 17.2.7.2. Products
- 17.2.7.3. SWOT Analysis
- 17.2.7.4. Recent Developments
- 17.2.7.5. Financials (Based on Availability)
- 17.2.8 Sagemcom SAS
- 17.2.8.1. Overview
- 17.2.8.2. Products
- 17.2.8.3. SWOT Analysis
- 17.2.8.4. Recent Developments
- 17.2.8.5. Financials (Based on Availability)
- 17.2.9 Telenet Systems Pvt Ltd
- 17.2.9.1. Overview
- 17.2.9.2. Products
- 17.2.9.3. SWOT Analysis
- 17.2.9.4. Recent Developments
- 17.2.9.5. Financials (Based on Availability)
- 17.2.10 Huawei Technologies Co Ltd
- 17.2.10.1. Overview
- 17.2.10.2. Products
- 17.2.10.3. SWOT Analysis
- 17.2.10.4. Recent Developments
- 17.2.10.5. Financials (Based on Availability)
- 17.2.11 ZTE Corporation
- 17.2.11.1. Overview
- 17.2.11.2. Products
- 17.2.11.3. SWOT Analysis
- 17.2.11.4. Recent Developments
- 17.2.11.5. Financials (Based on Availability)
- 17.2.12 Aztech Group Ltd
- 17.2.12.1. Overview
- 17.2.12.2. Products
- 17.2.12.3. SWOT Analysis
- 17.2.12.4. Recent Developments
- 17.2.12.5. Financials (Based on Availability)
- 17.2.13 Arris International PLC
- 17.2.13.1. Overview
- 17.2.13.2. Products
- 17.2.13.3. SWOT Analysis
- 17.2.13.4. Recent Developments
- 17.2.13.5. Financials (Based on Availability)
- 17.2.14 Telrad Networks Ltd
- 17.2.14.1. Overview
- 17.2.14.2. Products
- 17.2.14.3. SWOT Analysis
- 17.2.14.4. Recent Developments
- 17.2.14.5. Financials (Based on Availability)
- 17.2.15 Shenzhen Zoolan Technology Co Ltd
- 17.2.15.1. Overview
- 17.2.15.2. Products
- 17.2.15.3. SWOT Analysis
- 17.2.15.4. Recent Developments
- 17.2.15.5. Financials (Based on Availability)
- 17.2.16 AT&T Inc
- 17.2.16.1. Overview
- 17.2.16.2. Products
- 17.2.16.3. SWOT Analysis
- 17.2.16.4. Recent Developments
- 17.2.16.5. Financials (Based on Availability)
- 17.2.17 Technicolor SA
- 17.2.17.1. Overview
- 17.2.17.2. Products
- 17.2.17.3. SWOT Analysis
- 17.2.17.4. Recent Developments
- 17.2.17.5. Financials (Based on Availability)
- 17.2.18 Datang Telecom Technology & Industry Group*List Not Exhaustive
- 17.2.18.1. Overview
- 17.2.18.2. Products
- 17.2.18.3. SWOT Analysis
- 17.2.18.4. Recent Developments
- 17.2.18.5. Financials (Based on Availability)
- 17.2.19 Telefonica SA
- 17.2.19.1. Overview
- 17.2.19.2. Products
- 17.2.19.3. SWOT Analysis
- 17.2.19.4. Recent Developments
- 17.2.19.5. Financials (Based on Availability)
- 17.2.1 Motorola Solutions Inc
List of Figures
- Figure 1: Global Fixed LTE Industry Revenue Breakdown (Million, %) by Region 2024 & 2032
- Figure 2: North America Fixed LTE Industry Revenue (Million), by Country 2024 & 2032
- Figure 3: North America Fixed LTE Industry Revenue Share (%), by Country 2024 & 2032
- Figure 4: Europe Fixed LTE Industry Revenue (Million), by Country 2024 & 2032
- Figure 5: Europe Fixed LTE Industry Revenue Share (%), by Country 2024 & 2032
- Figure 6: Asia Pacific Fixed LTE Industry Revenue (Million), by Country 2024 & 2032
- Figure 7: Asia Pacific Fixed LTE Industry Revenue Share (%), by Country 2024 & 2032
- Figure 8: South America Fixed LTE Industry Revenue (Million), by Country 2024 & 2032
- Figure 9: South America Fixed LTE Industry Revenue Share (%), by Country 2024 & 2032
- Figure 10: North America Fixed LTE Industry Revenue (Million), by Country 2024 & 2032
- Figure 11: North America Fixed LTE Industry Revenue Share (%), by Country 2024 & 2032
- Figure 12: MEA Fixed LTE Industry Revenue (Million), by Country 2024 & 2032
- Figure 13: MEA Fixed LTE Industry Revenue Share (%), by Country 2024 & 2032
- Figure 14: North America Fixed LTE Industry Revenue (Million), by Type of User 2024 & 2032
- Figure 15: North America Fixed LTE Industry Revenue Share (%), by Type of User 2024 & 2032
- Figure 16: North America Fixed LTE Industry Revenue (Million), by Type of Solution 2024 & 2032
- Figure 17: North America Fixed LTE Industry Revenue Share (%), by Type of Solution 2024 & 2032
- Figure 18: North America Fixed LTE Industry Revenue (Million), by Country 2024 & 2032
- Figure 19: North America Fixed LTE Industry Revenue Share (%), by Country 2024 & 2032
- Figure 20: Europe Fixed LTE Industry Revenue (Million), by Type of User 2024 & 2032
- Figure 21: Europe Fixed LTE Industry Revenue Share (%), by Type of User 2024 & 2032
- Figure 22: Europe Fixed LTE Industry Revenue (Million), by Type of Solution 2024 & 2032
- Figure 23: Europe Fixed LTE Industry Revenue Share (%), by Type of Solution 2024 & 2032
- Figure 24: Europe Fixed LTE Industry Revenue (Million), by Country 2024 & 2032
- Figure 25: Europe Fixed LTE Industry Revenue Share (%), by Country 2024 & 2032
- Figure 26: Asia Pacific Fixed LTE Industry Revenue (Million), by Type of User 2024 & 2032
- Figure 27: Asia Pacific Fixed LTE Industry Revenue Share (%), by Type of User 2024 & 2032
- Figure 28: Asia Pacific Fixed LTE Industry Revenue (Million), by Type of Solution 2024 & 2032
- Figure 29: Asia Pacific Fixed LTE Industry Revenue Share (%), by Type of Solution 2024 & 2032
- Figure 30: Asia Pacific Fixed LTE Industry Revenue (Million), by Country 2024 & 2032
- Figure 31: Asia Pacific Fixed LTE Industry Revenue Share (%), by Country 2024 & 2032
- Figure 32: Latin America Fixed LTE Industry Revenue (Million), by Type of User 2024 & 2032
- Figure 33: Latin America Fixed LTE Industry Revenue Share (%), by Type of User 2024 & 2032
- Figure 34: Latin America Fixed LTE Industry Revenue (Million), by Type of Solution 2024 & 2032
- Figure 35: Latin America Fixed LTE Industry Revenue Share (%), by Type of Solution 2024 & 2032
- Figure 36: Latin America Fixed LTE Industry Revenue (Million), by Country 2024 & 2032
- Figure 37: Latin America Fixed LTE Industry Revenue Share (%), by Country 2024 & 2032
- Figure 38: Middle East and Africa Fixed LTE Industry Revenue (Million), by Type of User 2024 & 2032
- Figure 39: Middle East and Africa Fixed LTE Industry Revenue Share (%), by Type of User 2024 & 2032
- Figure 40: Middle East and Africa Fixed LTE Industry Revenue (Million), by Type of Solution 2024 & 2032
- Figure 41: Middle East and Africa Fixed LTE Industry Revenue Share (%), by Type of Solution 2024 & 2032
- Figure 42: Middle East and Africa Fixed LTE Industry Revenue (Million), by Country 2024 & 2032
- Figure 43: Middle East and Africa Fixed LTE Industry Revenue Share (%), by Country 2024 & 2032
List of Tables
- Table 1: Global Fixed LTE Industry Revenue Million Forecast, by Region 2019 & 2032
- Table 2: Global Fixed LTE Industry Revenue Million Forecast, by Type of User 2019 & 2032
- Table 3: Global Fixed LTE Industry Revenue Million Forecast, by Type of Solution 2019 & 2032
- Table 4: Global Fixed LTE Industry Revenue Million Forecast, by Region 2019 & 2032
- Table 5: Global Fixed LTE Industry Revenue Million Forecast, by Country 2019 & 2032
- Table 6: United States Fixed LTE Industry Revenue (Million) Forecast, by Application 2019 & 2032
- Table 7: Canada Fixed LTE Industry Revenue (Million) Forecast, by Application 2019 & 2032
- Table 8: Mexico Fixed LTE Industry Revenue (Million) Forecast, by Application 2019 & 2032
- Table 9: Global Fixed LTE Industry Revenue Million Forecast, by Country 2019 & 2032
- Table 10: Germany Fixed LTE Industry Revenue (Million) Forecast, by Application 2019 & 2032
- Table 11: United Kingdom Fixed LTE Industry Revenue (Million) Forecast, by Application 2019 & 2032
- Table 12: France Fixed LTE Industry Revenue (Million) Forecast, by Application 2019 & 2032
- Table 13: Spain Fixed LTE Industry Revenue (Million) Forecast, by Application 2019 & 2032
- Table 14: Italy Fixed LTE Industry Revenue (Million) Forecast, by Application 2019 & 2032
- Table 15: Spain Fixed LTE Industry Revenue (Million) Forecast, by Application 2019 & 2032
- Table 16: Belgium Fixed LTE Industry Revenue (Million) Forecast, by Application 2019 & 2032
- Table 17: Netherland Fixed LTE Industry Revenue (Million) Forecast, by Application 2019 & 2032
- Table 18: Nordics Fixed LTE Industry Revenue (Million) Forecast, by Application 2019 & 2032
- Table 19: Rest of Europe Fixed LTE Industry Revenue (Million) Forecast, by Application 2019 & 2032
- Table 20: Global Fixed LTE Industry Revenue Million Forecast, by Country 2019 & 2032
- Table 21: China Fixed LTE Industry Revenue (Million) Forecast, by Application 2019 & 2032
- Table 22: Japan Fixed LTE Industry Revenue (Million) Forecast, by Application 2019 & 2032
- Table 23: India Fixed LTE Industry Revenue (Million) Forecast, by Application 2019 & 2032
- Table 24: South Korea Fixed LTE Industry Revenue (Million) Forecast, by Application 2019 & 2032
- Table 25: Southeast Asia Fixed LTE Industry Revenue (Million) Forecast, by Application 2019 & 2032
- Table 26: Australia Fixed LTE Industry Revenue (Million) Forecast, by Application 2019 & 2032
- Table 27: Indonesia Fixed LTE Industry Revenue (Million) Forecast, by Application 2019 & 2032
- Table 28: Phillipes Fixed LTE Industry Revenue (Million) Forecast, by Application 2019 & 2032
- Table 29: Singapore Fixed LTE Industry Revenue (Million) Forecast, by Application 2019 & 2032
- Table 30: Thailandc Fixed LTE Industry Revenue (Million) Forecast, by Application 2019 & 2032
- Table 31: Rest of Asia Pacific Fixed LTE Industry Revenue (Million) Forecast, by Application 2019 & 2032
- Table 32: Global Fixed LTE Industry Revenue Million Forecast, by Country 2019 & 2032
- Table 33: Brazil Fixed LTE Industry Revenue (Million) Forecast, by Application 2019 & 2032
- Table 34: Argentina Fixed LTE Industry Revenue (Million) Forecast, by Application 2019 & 2032
- Table 35: Peru Fixed LTE Industry Revenue (Million) Forecast, by Application 2019 & 2032
- Table 36: Chile Fixed LTE Industry Revenue (Million) Forecast, by Application 2019 & 2032
- Table 37: Colombia Fixed LTE Industry Revenue (Million) Forecast, by Application 2019 & 2032
- Table 38: Ecuador Fixed LTE Industry Revenue (Million) Forecast, by Application 2019 & 2032
- Table 39: Venezuela Fixed LTE Industry Revenue (Million) Forecast, by Application 2019 & 2032
- Table 40: Rest of South America Fixed LTE Industry Revenue (Million) Forecast, by Application 2019 & 2032
- Table 41: Global Fixed LTE Industry Revenue Million Forecast, by Country 2019 & 2032
- Table 42: United States Fixed LTE Industry Revenue (Million) Forecast, by Application 2019 & 2032
- Table 43: Canada Fixed LTE Industry Revenue (Million) Forecast, by Application 2019 & 2032
- Table 44: Mexico Fixed LTE Industry Revenue (Million) Forecast, by Application 2019 & 2032
- Table 45: Global Fixed LTE Industry Revenue Million Forecast, by Country 2019 & 2032
- Table 46: United Arab Emirates Fixed LTE Industry Revenue (Million) Forecast, by Application 2019 & 2032
- Table 47: Saudi Arabia Fixed LTE Industry Revenue (Million) Forecast, by Application 2019 & 2032
- Table 48: South Africa Fixed LTE Industry Revenue (Million) Forecast, by Application 2019 & 2032
- Table 49: Rest of Middle East and Africa Fixed LTE Industry Revenue (Million) Forecast, by Application 2019 & 2032
- Table 50: Global Fixed LTE Industry Revenue Million Forecast, by Type of User 2019 & 2032
- Table 51: Global Fixed LTE Industry Revenue Million Forecast, by Type of Solution 2019 & 2032
- Table 52: Global Fixed LTE Industry Revenue Million Forecast, by Country 2019 & 2032
- Table 53: United States Fixed LTE Industry Revenue (Million) Forecast, by Application 2019 & 2032
- Table 54: Canada Fixed LTE Industry Revenue (Million) Forecast, by Application 2019 & 2032
- Table 55: Global Fixed LTE Industry Revenue Million Forecast, by Type of User 2019 & 2032
- Table 56: Global Fixed LTE Industry Revenue Million Forecast, by Type of Solution 2019 & 2032
- Table 57: Global Fixed LTE Industry Revenue Million Forecast, by Country 2019 & 2032
- Table 58: United Kingdom Fixed LTE Industry Revenue (Million) Forecast, by Application 2019 & 2032
- Table 59: Germany Fixed LTE Industry Revenue (Million) Forecast, by Application 2019 & 2032
- Table 60: France Fixed LTE Industry Revenue (Million) Forecast, by Application 2019 & 2032
- Table 61: Rest of the Europe Fixed LTE Industry Revenue (Million) Forecast, by Application 2019 & 2032
- Table 62: Global Fixed LTE Industry Revenue Million Forecast, by Type of User 2019 & 2032
- Table 63: Global Fixed LTE Industry Revenue Million Forecast, by Type of Solution 2019 & 2032
- Table 64: Global Fixed LTE Industry Revenue Million Forecast, by Country 2019 & 2032
- Table 65: China Fixed LTE Industry Revenue (Million) Forecast, by Application 2019 & 2032
- Table 66: Japan Fixed LTE Industry Revenue (Million) Forecast, by Application 2019 & 2032
- Table 67: India Fixed LTE Industry Revenue (Million) Forecast, by Application 2019 & 2032
- Table 68: Rest of the Asia Pacific Fixed LTE Industry Revenue (Million) Forecast, by Application 2019 & 2032
- Table 69: Global Fixed LTE Industry Revenue Million Forecast, by Type of User 2019 & 2032
- Table 70: Global Fixed LTE Industry Revenue Million Forecast, by Type of Solution 2019 & 2032
- Table 71: Global Fixed LTE Industry Revenue Million Forecast, by Country 2019 & 2032
- Table 72: Global Fixed LTE Industry Revenue Million Forecast, by Type of User 2019 & 2032
- Table 73: Global Fixed LTE Industry Revenue Million Forecast, by Type of Solution 2019 & 2032
- Table 74: Global Fixed LTE Industry Revenue Million Forecast, by Country 2019 & 2032
Frequently Asked Questions
1. What is the projected Compound Annual Growth Rate (CAGR) of the Fixed LTE Industry?
The projected CAGR is approximately 24.97%.
2. Which companies are prominent players in the Fixed LTE Industry?
Key companies in the market include Motorola Solutions Inc, Samsung Group, ZyXel Communications Corp, Teltronics (Hytera), Cisco Systems Inc, L-com Global Connectivity, Netgear Inc, Sagemcom SAS, Telenet Systems Pvt Ltd, Huawei Technologies Co Ltd, ZTE Corporation, Aztech Group Ltd, Arris International PLC, Telrad Networks Ltd, Shenzhen Zoolan Technology Co Ltd, AT&T Inc, Technicolor SA, Datang Telecom Technology & Industry Group*List Not Exhaustive, Telefonica SA.
3. What are the main segments of the Fixed LTE Industry?
The market segments include Type of User, Type of Solution.
4. Can you provide details about the market size?
The market size is estimated to be USD 37.97 Million as of 2022.
5. What are some drivers contributing to market growth?
Increased Adoption of Public Safety LTE.; Growing Demand For High Speed BroadBand In Rural Areas; Positive Outlook of Fixed LTE Compared to DSL. Fiber and Cable.
6. What are the notable trends driving market growth?
Residential Type of User Expected to Account for Significant Share.
7. Are there any restraints impacting market growth?
Network Performance Concerns.
8. Can you provide examples of recent developments in the market?
December 2022 - South African-based Huge group formed a new business group to offer Fixed LTE services to SMEs (Small and Small-Medium Enterprises). The company has designed smaller internet packages suitable for work-from-home scenarios and large packages to serve big organizations. The group already has a combined customer base of 19000 19 000 businesses and SMEs and plans to expand this further.
9. What pricing options are available for accessing the report?
Pricing options include single-user, multi-user, and enterprise licenses priced at USD 4750, USD 5250, and USD 8750 respectively.
10. Is the market size provided in terms of value or volume?
The market size is provided in terms of value, measured in Million.
11. Are there any specific market keywords associated with the report?
Yes, the market keyword associated with the report is "Fixed LTE Industry," which aids in identifying and referencing the specific market segment covered.
12. How do I determine which pricing option suits my needs best?
The pricing options vary based on user requirements and access needs. Individual users may opt for single-user licenses, while businesses requiring broader access may choose multi-user or enterprise licenses for cost-effective access to the report.
13. Are there any additional resources or data provided in the Fixed LTE Industry report?
While the report offers comprehensive insights, it's advisable to review the specific contents or supplementary materials provided to ascertain if additional resources or data are available.
14. How can I stay updated on further developments or reports in the Fixed LTE Industry?
To stay informed about further developments, trends, and reports in the Fixed LTE Industry, consider subscribing to industry newsletters, following relevant companies and organizations, or regularly checking reputable industry news sources and publications.
Methodology
Step 1 - Identification of Relevant Samples Size from Population Database


Step 2 - Approaches for Defining Global Market Size (Value, Volume* & Price*)

Note*: In applicable scenarios
Step 3 - Data Sources
Primary Research
- Web Analytics
- Survey Reports
- Research Institute
- Latest Research Reports
- Opinion Leaders
Secondary Research
- Annual Reports
- White Paper
- Latest Press Release
- Industry Association
- Paid Database
- Investor Presentations

Step 4 - Data Triangulation
Involves using different sources of information in order to increase the validity of a study
These sources are likely to be stakeholders in a program - participants, other researchers, program staff, other community members, and so on.
Then we put all data in single framework & apply various statistical tools to find out the dynamic on the market.
During the analysis stage, feedback from the stakeholder groups would be compared to determine areas of agreement as well as areas of divergence


