
Key Insights
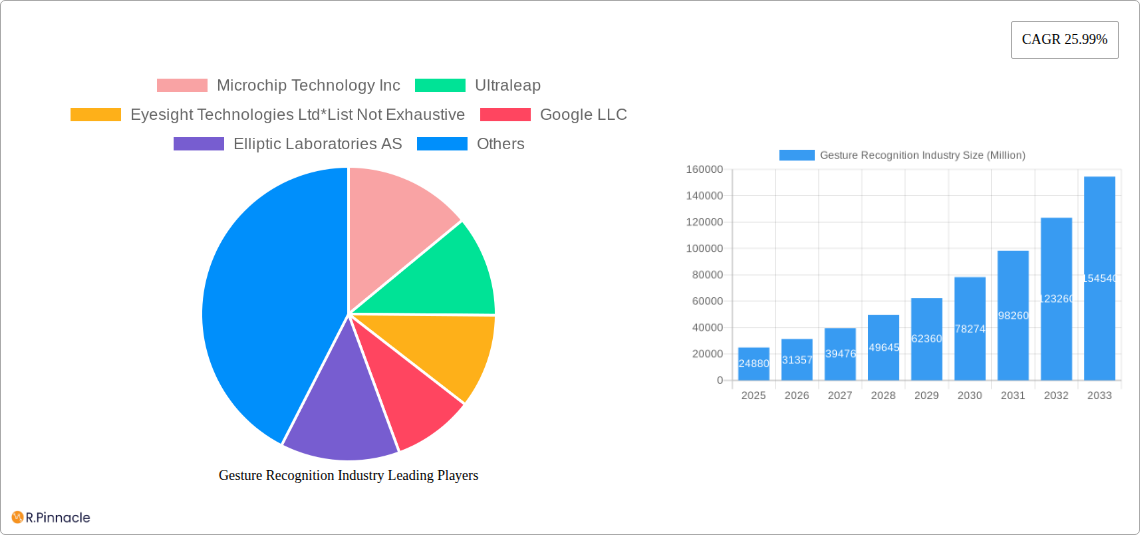
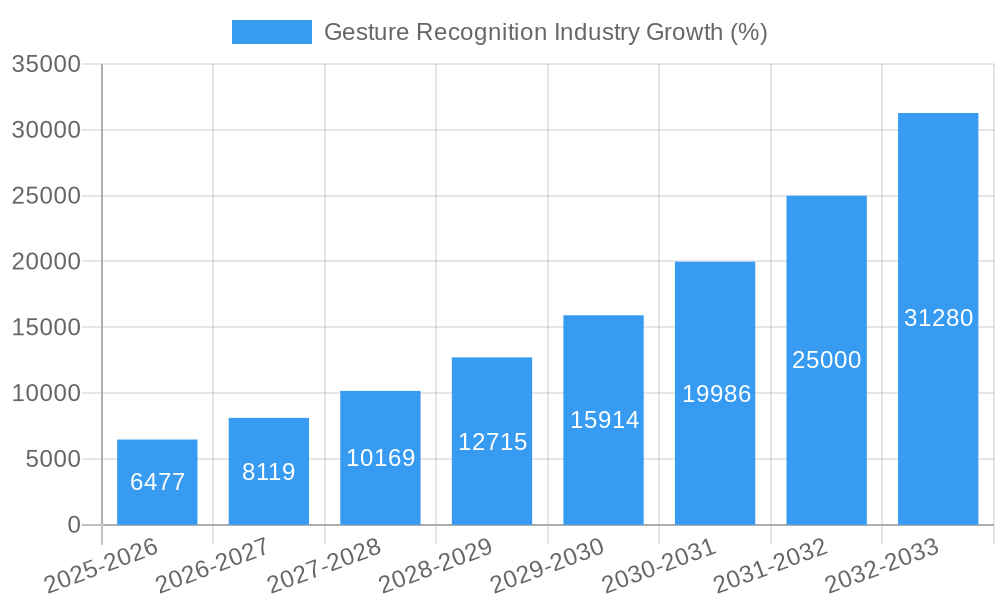
The gesture recognition market is experiencing robust growth, projected to reach $24.88 billion in 2025 and maintain a Compound Annual Growth Rate (CAGR) of 25.99% from 2025 to 2033. This expansion is fueled by several key drivers. The increasing adoption of smartphones and smart devices equipped with advanced gesture recognition capabilities is a significant factor. Furthermore, the rising demand for intuitive and seamless human-computer interaction across diverse sectors, such as automotive, healthcare, and gaming, is propelling market growth. Advancements in technology, particularly in touchless gesture recognition, are enhancing accuracy and responsiveness, leading to wider acceptance in applications requiring hygiene and contactless operation. The integration of artificial intelligence (AI) and machine learning (ML) algorithms further improves the precision and adaptability of gesture recognition systems, enabling more sophisticated functionalities.
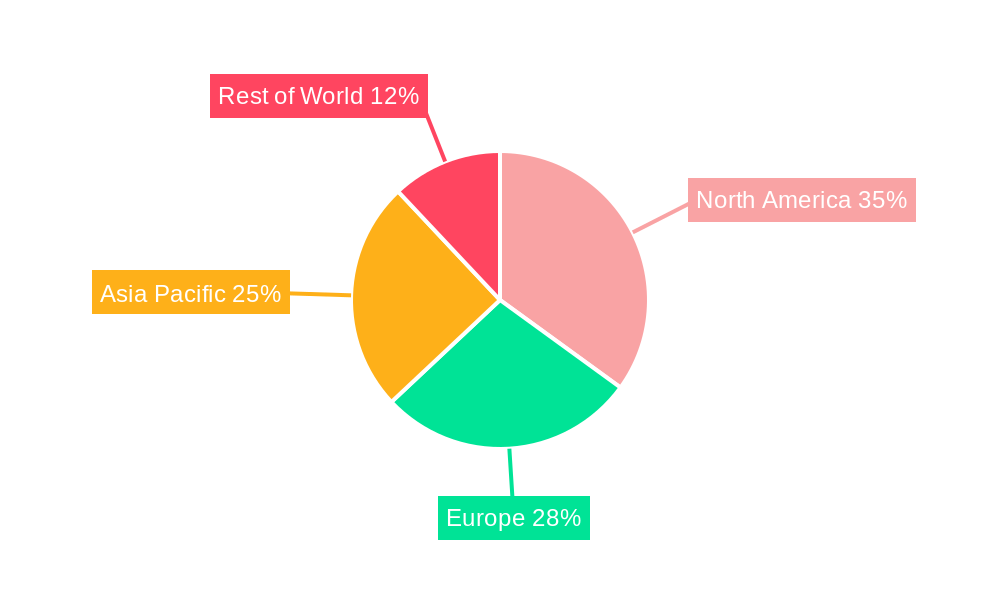
However, the market also faces certain challenges. High initial investment costs for developing and implementing advanced gesture recognition technologies can be a barrier to entry for smaller companies. Concerns regarding data privacy and security associated with the collection and analysis of user gesture data also need to be addressed to foster consumer trust. Despite these restraints, the long-term outlook for the gesture recognition market remains positive, driven by continuous technological innovation and expanding applications across various industries. The market segmentation by technology (touch-based and touchless) and end-user industry (aerospace & defense, automotive, consumer electronics, gaming, healthcare, etc.) reveals diverse opportunities for growth, with touchless technology expected to gain significant traction due to hygiene concerns and user convenience. The geographic distribution shows strong potential in North America and Asia Pacific, driven by technological advancements and increased adoption rates in these regions.
Gesture Recognition Industry Market Report: 2019-2033
This comprehensive report provides a detailed analysis of the Gesture Recognition industry, projecting a market value exceeding $xx Million by 2033. It offers actionable insights for industry professionals, investors, and strategists seeking to navigate this rapidly evolving landscape. The report covers the period from 2019 to 2033, with a base year of 2025 and a forecast period of 2025-2033.
Gesture Recognition Industry Market Structure & Innovation Trends
The Gesture Recognition market is characterized by a moderately concentrated structure with several key players holding significant market share, though fragmentation exists among smaller, specialized firms. Leading companies like Microchip Technology Inc, Ultraleap, Eyesight Technologies Ltd, Google LLC, Elliptic Laboratories AS, Jabil Inc, GestureTek Inc, Fibaro Group SA, Intel Corporation, and Sony Corporation are driving innovation through continuous product development and strategic acquisitions. The estimated market share of the top 5 players in 2025 is xx%.
Innovation is fueled by advancements in AI, machine learning, and sensor technologies, leading to improved accuracy, responsiveness, and user experience. Regulatory frameworks, particularly concerning data privacy and safety, are shaping the industry's trajectory. Product substitutes, such as voice recognition and other human-machine interface technologies, pose a competitive challenge. End-user demographics are evolving, with increased demand from various sectors. M&A activity is prevalent, with deal values exceeding $xx Million in the past five years. Examples include strategic acquisitions to expand product portfolios and technological capabilities.
Gesture Recognition Industry Market Dynamics & Trends
The Gesture Recognition market is experiencing robust growth, driven by the increasing adoption of smart devices, automation in various industries, and a rising demand for intuitive human-machine interfaces. The market is projected to register a Compound Annual Growth Rate (CAGR) of xx% during the forecast period (2025-2033). Technological disruptions, such as the introduction of advanced sensor technologies and AI-powered algorithms, are enhancing the accuracy and reliability of gesture recognition systems. Changing consumer preferences towards seamless and intuitive interactions are fueling the adoption of gesture-based technologies. Competitive dynamics are characterized by intense R&D efforts, strategic partnerships, and a focus on differentiation through unique features and applications. Market penetration is increasing across various end-user industries, particularly in consumer electronics and automotive.
Dominant Regions & Segments in Gesture Recognition Industry
Leading Region: North America holds a dominant position in the Gesture Recognition market, driven by strong technological advancements, high adoption rates, and a robust consumer electronics industry. Key drivers include strong R&D investments, favorable economic policies, and a well-developed infrastructure. Europe and Asia-Pacific are also significant markets, experiencing substantial growth.
Dominant Technology Segment: Touchless Gesture Recognition is the fastest-growing segment, driven by its hygiene benefits and enhanced user experience compared to touch-based systems. Touch-based Gesture Recognition retains a significant share, though its growth is comparatively slower.
Dominant End-User Segment: The Consumer Electronics segment constitutes a major share of the market, followed by the Automotive segment which is rapidly expanding due to the increasing integration of advanced driver-assistance systems (ADAS) and in-vehicle infotainment (IVI) systems. The Healthcare, Aerospace & Defense, and Gaming segments show considerable potential for future growth.
Gesture Recognition Industry Product Innovations
Recent product innovations include advancements in sensor technology, improved algorithms for gesture recognition, and the integration of gesture control into a wider range of devices and applications. Miniaturization of sensors and improved power efficiency enable integration into smaller devices. This leads to greater accuracy and adaptability to various environments, increasing market appeal across diverse applications.
Report Scope & Segmentation Analysis
By Technology: The report segments the market by Touch-based Gesture Recognition and Touchless Gesture Recognition, providing detailed analysis of growth projections, market size, and competitive dynamics for each segment. The Touchless segment shows higher growth potential.
By End-user Industry: The report provides a comprehensive analysis of the market across Aerospace and Defense, Automotive, Consumer Electronics, Gaming, Healthcare, and Other End-user Industries. Each segment's growth trajectory, market size, and competitive landscape are thoroughly evaluated. The Consumer Electronics and Automotive segments show highest potential.
Key Drivers of Gesture Recognition Industry Growth
The Gesture Recognition market is propelled by several key factors: the rising demand for intuitive human-computer interfaces in various sectors; technological advancements in sensor technology, AI, and machine learning; the increasing adoption of smart devices and automation across multiple industries; and government initiatives supporting technological innovation and digitalization.
Challenges in the Gesture Recognition Industry Sector
Key challenges include the high cost of development and implementation of advanced gesture recognition systems; concerns about data privacy and security; the potential for inaccurate recognition in complex environments; and competition from other human-machine interface technologies. These factors can impact market growth.
Emerging Opportunities in Gesture Recognition Industry
Significant opportunities lie in the expansion into new applications and markets, especially in the Internet of Things (IoT), augmented reality (AR), and virtual reality (VR) industries. Advancements in AI and machine learning are also expected to unlock new possibilities, leading to further growth. The integration of gesture recognition into smart homes and wearables represents a significant untapped market.
Leading Players in the Gesture Recognition Industry Market
- Microchip Technology Inc
- Ultraleap
- Eyesight Technologies Ltd
- Google LLC
- Elliptic Laboratories AS
- Jabil Inc
- GestureTek Inc
- Fibaro Group SA
- Intel Corporation
- Sony Corporation
Key Developments in Gesture Recognition Industry
- May 2023: Doublepoint secured EUR 3 million (approx. USD 3.3 million) in funding to integrate its touch-based gesture recognition technology into consumer electronics.
- November 2022: Hyundai Mobis introduced its Quick Menu Selection system using proximity detection for hand gesture interaction in vehicles.
Future Outlook for Gesture Recognition Industry Market
The Gesture Recognition market is poised for significant expansion, driven by continued technological innovation, increasing demand across diverse sectors, and the emergence of new applications. Strategic partnerships and acquisitions will further shape the market landscape, creating opportunities for growth and expansion. The market is expected to reach $xx Million by 2033.
Gesture Recognition Industry Segmentation
-
1. Technology
- 1.1. Touch-based Gesture Recognition
- 1.2. Touchless Gesture Recognition
-
2. End-user Industry
- 2.1. Aerospace and Defense
- 2.2. Automotive
- 2.3. Consumer Electronics
- 2.4. Gaming
- 2.5. Healthcare
- 2.6. Other End-user Industries
Gesture Recognition Industry Segmentation By Geography
-
1. North America
- 1.1. United States
- 1.2. Canada
-
2. Europe
- 2.1. United Kingdom
- 2.2. Germany
- 2.3. France
-
3. Asia
- 3.1. China
- 3.2. Japan
- 3.3. India
- 3.4. Australia and New Zealand
- 4. Latin America
- 5. Middle East and Africa
Gesture Recognition Industry REPORT HIGHLIGHTS
| Aspects | Details |
|---|---|
| Study Period | 2019-2033 |
| Base Year | 2024 |
| Estimated Year | 2025 |
| Forecast Period | 2025-2033 |
| Historical Period | 2019-2024 |
| Growth Rate | CAGR of 25.99% from 2019-2033 |
| Segmentation |
|
Table of Contents
- 1. Introduction
- 1.1. Research Scope
- 1.2. Market Segmentation
- 1.3. Research Methodology
- 1.4. Definitions and Assumptions
- 2. Executive Summary
- 2.1. Introduction
- 3. Market Dynamics
- 3.1. Introduction
- 3.2. Market Drivers
- 3.2.1. Technological Advancements for Efficient HMI and Demand for Cost-effective Features; Evolution of Artificial Intelligence and Machine Learning Technology Augmented with Fall in Sensor Prices; Increasing Use of Devices Supporting Gesture Recognition across End-user Industries
- 3.3. Market Restrains
- 3.3.1 Algorithms
- 3.3.2 Mathematical
- 3.3.3 and Other Complexities Associated with the Use of Gesture Recognition Technology; High Battery Power Consumption by Gesture Sensors
- 3.3.4 due to the ‘Always-on’ User Interface
- 3.4. Market Trends
- 3.4.1. Touch-based Gesture Recognition Segment is Expected to Hold Significant Market Share
- 4. Market Factor Analysis
- 4.1. Porters Five Forces
- 4.2. Supply/Value Chain
- 4.3. PESTEL analysis
- 4.4. Market Entropy
- 4.5. Patent/Trademark Analysis
- 5. Global Gesture Recognition Industry Analysis, Insights and Forecast, 2019-2031
- 5.1. Market Analysis, Insights and Forecast - by Technology
- 5.1.1. Touch-based Gesture Recognition
- 5.1.2. Touchless Gesture Recognition
- 5.2. Market Analysis, Insights and Forecast - by End-user Industry
- 5.2.1. Aerospace and Defense
- 5.2.2. Automotive
- 5.2.3. Consumer Electronics
- 5.2.4. Gaming
- 5.2.5. Healthcare
- 5.2.6. Other End-user Industries
- 5.3. Market Analysis, Insights and Forecast - by Region
- 5.3.1. North America
- 5.3.2. Europe
- 5.3.3. Asia
- 5.3.4. Latin America
- 5.3.5. Middle East and Africa
- 5.1. Market Analysis, Insights and Forecast - by Technology
- 6. North America Gesture Recognition Industry Analysis, Insights and Forecast, 2019-2031
- 6.1. Market Analysis, Insights and Forecast - by Technology
- 6.1.1. Touch-based Gesture Recognition
- 6.1.2. Touchless Gesture Recognition
- 6.2. Market Analysis, Insights and Forecast - by End-user Industry
- 6.2.1. Aerospace and Defense
- 6.2.2. Automotive
- 6.2.3. Consumer Electronics
- 6.2.4. Gaming
- 6.2.5. Healthcare
- 6.2.6. Other End-user Industries
- 6.1. Market Analysis, Insights and Forecast - by Technology
- 7. Europe Gesture Recognition Industry Analysis, Insights and Forecast, 2019-2031
- 7.1. Market Analysis, Insights and Forecast - by Technology
- 7.1.1. Touch-based Gesture Recognition
- 7.1.2. Touchless Gesture Recognition
- 7.2. Market Analysis, Insights and Forecast - by End-user Industry
- 7.2.1. Aerospace and Defense
- 7.2.2. Automotive
- 7.2.3. Consumer Electronics
- 7.2.4. Gaming
- 7.2.5. Healthcare
- 7.2.6. Other End-user Industries
- 7.1. Market Analysis, Insights and Forecast - by Technology
- 8. Asia Gesture Recognition Industry Analysis, Insights and Forecast, 2019-2031
- 8.1. Market Analysis, Insights and Forecast - by Technology
- 8.1.1. Touch-based Gesture Recognition
- 8.1.2. Touchless Gesture Recognition
- 8.2. Market Analysis, Insights and Forecast - by End-user Industry
- 8.2.1. Aerospace and Defense
- 8.2.2. Automotive
- 8.2.3. Consumer Electronics
- 8.2.4. Gaming
- 8.2.5. Healthcare
- 8.2.6. Other End-user Industries
- 8.1. Market Analysis, Insights and Forecast - by Technology
- 9. Latin America Gesture Recognition Industry Analysis, Insights and Forecast, 2019-2031
- 9.1. Market Analysis, Insights and Forecast - by Technology
- 9.1.1. Touch-based Gesture Recognition
- 9.1.2. Touchless Gesture Recognition
- 9.2. Market Analysis, Insights and Forecast - by End-user Industry
- 9.2.1. Aerospace and Defense
- 9.2.2. Automotive
- 9.2.3. Consumer Electronics
- 9.2.4. Gaming
- 9.2.5. Healthcare
- 9.2.6. Other End-user Industries
- 9.1. Market Analysis, Insights and Forecast - by Technology
- 10. Middle East and Africa Gesture Recognition Industry Analysis, Insights and Forecast, 2019-2031
- 10.1. Market Analysis, Insights and Forecast - by Technology
- 10.1.1. Touch-based Gesture Recognition
- 10.1.2. Touchless Gesture Recognition
- 10.2. Market Analysis, Insights and Forecast - by End-user Industry
- 10.2.1. Aerospace and Defense
- 10.2.2. Automotive
- 10.2.3. Consumer Electronics
- 10.2.4. Gaming
- 10.2.5. Healthcare
- 10.2.6. Other End-user Industries
- 10.1. Market Analysis, Insights and Forecast - by Technology
- 11. North America Gesture Recognition Industry Analysis, Insights and Forecast, 2019-2031
- 11.1. Market Analysis, Insights and Forecast - By Country/Sub-region
- 11.1.1 United States
- 11.1.2 Canada
- 12. Europe Gesture Recognition Industry Analysis, Insights and Forecast, 2019-2031
- 12.1. Market Analysis, Insights and Forecast - By Country/Sub-region
- 12.1.1 United Kingdom
- 12.1.2 Germany
- 12.1.3 France
- 12.1.4 Rest of Europe
- 13. Asia Pacific Gesture Recognition Industry Analysis, Insights and Forecast, 2019-2031
- 13.1. Market Analysis, Insights and Forecast - By Country/Sub-region
- 13.1.1 China
- 13.1.2 Japan
- 13.1.3 India
- 13.1.4 Rest of Asia Pacific
- 14. Rest of the World Gesture Recognition Industry Analysis, Insights and Forecast, 2019-2031
- 14.1. Market Analysis, Insights and Forecast - By Country/Sub-region
- 14.1.1 Latin America
- 14.1.2 Middle East
- 15. Competitive Analysis
- 15.1. Global Market Share Analysis 2024
- 15.2. Company Profiles
- 15.2.1 Microchip Technology Inc
- 15.2.1.1. Overview
- 15.2.1.2. Products
- 15.2.1.3. SWOT Analysis
- 15.2.1.4. Recent Developments
- 15.2.1.5. Financials (Based on Availability)
- 15.2.2 Ultraleap
- 15.2.2.1. Overview
- 15.2.2.2. Products
- 15.2.2.3. SWOT Analysis
- 15.2.2.4. Recent Developments
- 15.2.2.5. Financials (Based on Availability)
- 15.2.3 Eyesight Technologies Ltd*List Not Exhaustive
- 15.2.3.1. Overview
- 15.2.3.2. Products
- 15.2.3.3. SWOT Analysis
- 15.2.3.4. Recent Developments
- 15.2.3.5. Financials (Based on Availability)
- 15.2.4 Google LLC
- 15.2.4.1. Overview
- 15.2.4.2. Products
- 15.2.4.3. SWOT Analysis
- 15.2.4.4. Recent Developments
- 15.2.4.5. Financials (Based on Availability)
- 15.2.5 Elliptic Laboratories AS
- 15.2.5.1. Overview
- 15.2.5.2. Products
- 15.2.5.3. SWOT Analysis
- 15.2.5.4. Recent Developments
- 15.2.5.5. Financials (Based on Availability)
- 15.2.6 Jabil Inc
- 15.2.6.1. Overview
- 15.2.6.2. Products
- 15.2.6.3. SWOT Analysis
- 15.2.6.4. Recent Developments
- 15.2.6.5. Financials (Based on Availability)
- 15.2.7 GestureTek Inc
- 15.2.7.1. Overview
- 15.2.7.2. Products
- 15.2.7.3. SWOT Analysis
- 15.2.7.4. Recent Developments
- 15.2.7.5. Financials (Based on Availability)
- 15.2.8 Fibaro Group SA
- 15.2.8.1. Overview
- 15.2.8.2. Products
- 15.2.8.3. SWOT Analysis
- 15.2.8.4. Recent Developments
- 15.2.8.5. Financials (Based on Availability)
- 15.2.9 Intel Corporation
- 15.2.9.1. Overview
- 15.2.9.2. Products
- 15.2.9.3. SWOT Analysis
- 15.2.9.4. Recent Developments
- 15.2.9.5. Financials (Based on Availability)
- 15.2.10 Sony Corporation
- 15.2.10.1. Overview
- 15.2.10.2. Products
- 15.2.10.3. SWOT Analysis
- 15.2.10.4. Recent Developments
- 15.2.10.5. Financials (Based on Availability)
- 15.2.1 Microchip Technology Inc
List of Figures
- Figure 1: Global Gesture Recognition Industry Revenue Breakdown (Million, %) by Region 2024 & 2032
- Figure 2: North America Gesture Recognition Industry Revenue (Million), by Country 2024 & 2032
- Figure 3: North America Gesture Recognition Industry Revenue Share (%), by Country 2024 & 2032
- Figure 4: Europe Gesture Recognition Industry Revenue (Million), by Country 2024 & 2032
- Figure 5: Europe Gesture Recognition Industry Revenue Share (%), by Country 2024 & 2032
- Figure 6: Asia Pacific Gesture Recognition Industry Revenue (Million), by Country 2024 & 2032
- Figure 7: Asia Pacific Gesture Recognition Industry Revenue Share (%), by Country 2024 & 2032
- Figure 8: Rest of the World Gesture Recognition Industry Revenue (Million), by Country 2024 & 2032
- Figure 9: Rest of the World Gesture Recognition Industry Revenue Share (%), by Country 2024 & 2032
- Figure 10: North America Gesture Recognition Industry Revenue (Million), by Technology 2024 & 2032
- Figure 11: North America Gesture Recognition Industry Revenue Share (%), by Technology 2024 & 2032
- Figure 12: North America Gesture Recognition Industry Revenue (Million), by End-user Industry 2024 & 2032
- Figure 13: North America Gesture Recognition Industry Revenue Share (%), by End-user Industry 2024 & 2032
- Figure 14: North America Gesture Recognition Industry Revenue (Million), by Country 2024 & 2032
- Figure 15: North America Gesture Recognition Industry Revenue Share (%), by Country 2024 & 2032
- Figure 16: Europe Gesture Recognition Industry Revenue (Million), by Technology 2024 & 2032
- Figure 17: Europe Gesture Recognition Industry Revenue Share (%), by Technology 2024 & 2032
- Figure 18: Europe Gesture Recognition Industry Revenue (Million), by End-user Industry 2024 & 2032
- Figure 19: Europe Gesture Recognition Industry Revenue Share (%), by End-user Industry 2024 & 2032
- Figure 20: Europe Gesture Recognition Industry Revenue (Million), by Country 2024 & 2032
- Figure 21: Europe Gesture Recognition Industry Revenue Share (%), by Country 2024 & 2032
- Figure 22: Asia Gesture Recognition Industry Revenue (Million), by Technology 2024 & 2032
- Figure 23: Asia Gesture Recognition Industry Revenue Share (%), by Technology 2024 & 2032
- Figure 24: Asia Gesture Recognition Industry Revenue (Million), by End-user Industry 2024 & 2032
- Figure 25: Asia Gesture Recognition Industry Revenue Share (%), by End-user Industry 2024 & 2032
- Figure 26: Asia Gesture Recognition Industry Revenue (Million), by Country 2024 & 2032
- Figure 27: Asia Gesture Recognition Industry Revenue Share (%), by Country 2024 & 2032
- Figure 28: Latin America Gesture Recognition Industry Revenue (Million), by Technology 2024 & 2032
- Figure 29: Latin America Gesture Recognition Industry Revenue Share (%), by Technology 2024 & 2032
- Figure 30: Latin America Gesture Recognition Industry Revenue (Million), by End-user Industry 2024 & 2032
- Figure 31: Latin America Gesture Recognition Industry Revenue Share (%), by End-user Industry 2024 & 2032
- Figure 32: Latin America Gesture Recognition Industry Revenue (Million), by Country 2024 & 2032
- Figure 33: Latin America Gesture Recognition Industry Revenue Share (%), by Country 2024 & 2032
- Figure 34: Middle East and Africa Gesture Recognition Industry Revenue (Million), by Technology 2024 & 2032
- Figure 35: Middle East and Africa Gesture Recognition Industry Revenue Share (%), by Technology 2024 & 2032
- Figure 36: Middle East and Africa Gesture Recognition Industry Revenue (Million), by End-user Industry 2024 & 2032
- Figure 37: Middle East and Africa Gesture Recognition Industry Revenue Share (%), by End-user Industry 2024 & 2032
- Figure 38: Middle East and Africa Gesture Recognition Industry Revenue (Million), by Country 2024 & 2032
- Figure 39: Middle East and Africa Gesture Recognition Industry Revenue Share (%), by Country 2024 & 2032
List of Tables
- Table 1: Global Gesture Recognition Industry Revenue Million Forecast, by Region 2019 & 2032
- Table 2: Global Gesture Recognition Industry Revenue Million Forecast, by Technology 2019 & 2032
- Table 3: Global Gesture Recognition Industry Revenue Million Forecast, by End-user Industry 2019 & 2032
- Table 4: Global Gesture Recognition Industry Revenue Million Forecast, by Region 2019 & 2032
- Table 5: Global Gesture Recognition Industry Revenue Million Forecast, by Country 2019 & 2032
- Table 6: United States Gesture Recognition Industry Revenue (Million) Forecast, by Application 2019 & 2032
- Table 7: Canada Gesture Recognition Industry Revenue (Million) Forecast, by Application 2019 & 2032
- Table 8: Global Gesture Recognition Industry Revenue Million Forecast, by Country 2019 & 2032
- Table 9: United Kingdom Gesture Recognition Industry Revenue (Million) Forecast, by Application 2019 & 2032
- Table 10: Germany Gesture Recognition Industry Revenue (Million) Forecast, by Application 2019 & 2032
- Table 11: France Gesture Recognition Industry Revenue (Million) Forecast, by Application 2019 & 2032
- Table 12: Rest of Europe Gesture Recognition Industry Revenue (Million) Forecast, by Application 2019 & 2032
- Table 13: Global Gesture Recognition Industry Revenue Million Forecast, by Country 2019 & 2032
- Table 14: China Gesture Recognition Industry Revenue (Million) Forecast, by Application 2019 & 2032
- Table 15: Japan Gesture Recognition Industry Revenue (Million) Forecast, by Application 2019 & 2032
- Table 16: India Gesture Recognition Industry Revenue (Million) Forecast, by Application 2019 & 2032
- Table 17: Rest of Asia Pacific Gesture Recognition Industry Revenue (Million) Forecast, by Application 2019 & 2032
- Table 18: Global Gesture Recognition Industry Revenue Million Forecast, by Country 2019 & 2032
- Table 19: Latin America Gesture Recognition Industry Revenue (Million) Forecast, by Application 2019 & 2032
- Table 20: Middle East Gesture Recognition Industry Revenue (Million) Forecast, by Application 2019 & 2032
- Table 21: Global Gesture Recognition Industry Revenue Million Forecast, by Technology 2019 & 2032
- Table 22: Global Gesture Recognition Industry Revenue Million Forecast, by End-user Industry 2019 & 2032
- Table 23: Global Gesture Recognition Industry Revenue Million Forecast, by Country 2019 & 2032
- Table 24: United States Gesture Recognition Industry Revenue (Million) Forecast, by Application 2019 & 2032
- Table 25: Canada Gesture Recognition Industry Revenue (Million) Forecast, by Application 2019 & 2032
- Table 26: Global Gesture Recognition Industry Revenue Million Forecast, by Technology 2019 & 2032
- Table 27: Global Gesture Recognition Industry Revenue Million Forecast, by End-user Industry 2019 & 2032
- Table 28: Global Gesture Recognition Industry Revenue Million Forecast, by Country 2019 & 2032
- Table 29: United Kingdom Gesture Recognition Industry Revenue (Million) Forecast, by Application 2019 & 2032
- Table 30: Germany Gesture Recognition Industry Revenue (Million) Forecast, by Application 2019 & 2032
- Table 31: France Gesture Recognition Industry Revenue (Million) Forecast, by Application 2019 & 2032
- Table 32: Global Gesture Recognition Industry Revenue Million Forecast, by Technology 2019 & 2032
- Table 33: Global Gesture Recognition Industry Revenue Million Forecast, by End-user Industry 2019 & 2032
- Table 34: Global Gesture Recognition Industry Revenue Million Forecast, by Country 2019 & 2032
- Table 35: China Gesture Recognition Industry Revenue (Million) Forecast, by Application 2019 & 2032
- Table 36: Japan Gesture Recognition Industry Revenue (Million) Forecast, by Application 2019 & 2032
- Table 37: India Gesture Recognition Industry Revenue (Million) Forecast, by Application 2019 & 2032
- Table 38: Australia and New Zealand Gesture Recognition Industry Revenue (Million) Forecast, by Application 2019 & 2032
- Table 39: Global Gesture Recognition Industry Revenue Million Forecast, by Technology 2019 & 2032
- Table 40: Global Gesture Recognition Industry Revenue Million Forecast, by End-user Industry 2019 & 2032
- Table 41: Global Gesture Recognition Industry Revenue Million Forecast, by Country 2019 & 2032
- Table 42: Global Gesture Recognition Industry Revenue Million Forecast, by Technology 2019 & 2032
- Table 43: Global Gesture Recognition Industry Revenue Million Forecast, by End-user Industry 2019 & 2032
- Table 44: Global Gesture Recognition Industry Revenue Million Forecast, by Country 2019 & 2032
Frequently Asked Questions
1. What is the projected Compound Annual Growth Rate (CAGR) of the Gesture Recognition Industry?
The projected CAGR is approximately 25.99%.
2. Which companies are prominent players in the Gesture Recognition Industry?
Key companies in the market include Microchip Technology Inc, Ultraleap, Eyesight Technologies Ltd*List Not Exhaustive, Google LLC, Elliptic Laboratories AS, Jabil Inc, GestureTek Inc, Fibaro Group SA, Intel Corporation, Sony Corporation.
3. What are the main segments of the Gesture Recognition Industry?
The market segments include Technology, End-user Industry.
4. Can you provide details about the market size?
The market size is estimated to be USD 24.88 Million as of 2022.
5. What are some drivers contributing to market growth?
Technological Advancements for Efficient HMI and Demand for Cost-effective Features; Evolution of Artificial Intelligence and Machine Learning Technology Augmented with Fall in Sensor Prices; Increasing Use of Devices Supporting Gesture Recognition across End-user Industries.
6. What are the notable trends driving market growth?
Touch-based Gesture Recognition Segment is Expected to Hold Significant Market Share.
7. Are there any restraints impacting market growth?
Algorithms. Mathematical. and Other Complexities Associated with the Use of Gesture Recognition Technology; High Battery Power Consumption by Gesture Sensors. due to the ‘Always-on’ User Interface.
8. Can you provide examples of recent developments in the market?
May 2023: Doublepoint, a Helsinki-based company specializing in touch-based micro gesture and surface interaction technology, successfully secured EUR 3 million (approximately USD 3.3 million) in a recent funding round. Superhero Capital, FOV Ventures, Superangel VC, Business Finland, and a group of angel investors led the investment. With this fresh capital infusion, Doublepoint is poised to integrate its cutting-edge gesture recognition technology into consumer electronics and various hardware solutions.
9. What pricing options are available for accessing the report?
Pricing options include single-user, multi-user, and enterprise licenses priced at USD 4750, USD 5250, and USD 8750 respectively.
10. Is the market size provided in terms of value or volume?
The market size is provided in terms of value, measured in Million.
11. Are there any specific market keywords associated with the report?
Yes, the market keyword associated with the report is "Gesture Recognition Industry," which aids in identifying and referencing the specific market segment covered.
12. How do I determine which pricing option suits my needs best?
The pricing options vary based on user requirements and access needs. Individual users may opt for single-user licenses, while businesses requiring broader access may choose multi-user or enterprise licenses for cost-effective access to the report.
13. Are there any additional resources or data provided in the Gesture Recognition Industry report?
While the report offers comprehensive insights, it's advisable to review the specific contents or supplementary materials provided to ascertain if additional resources or data are available.
14. How can I stay updated on further developments or reports in the Gesture Recognition Industry?
To stay informed about further developments, trends, and reports in the Gesture Recognition Industry, consider subscribing to industry newsletters, following relevant companies and organizations, or regularly checking reputable industry news sources and publications.
Methodology
Step 1 - Identification of Relevant Samples Size from Population Database


Step 2 - Approaches for Defining Global Market Size (Value, Volume* & Price*)

Note*: In applicable scenarios
Step 3 - Data Sources
Primary Research
- Web Analytics
- Survey Reports
- Research Institute
- Latest Research Reports
- Opinion Leaders
Secondary Research
- Annual Reports
- White Paper
- Latest Press Release
- Industry Association
- Paid Database
- Investor Presentations

Step 4 - Data Triangulation
Involves using different sources of information in order to increase the validity of a study
These sources are likely to be stakeholders in a program - participants, other researchers, program staff, other community members, and so on.
Then we put all data in single framework & apply various statistical tools to find out the dynamic on the market.
During the analysis stage, feedback from the stakeholder groups would be compared to determine areas of agreement as well as areas of divergence


