
Key Insights
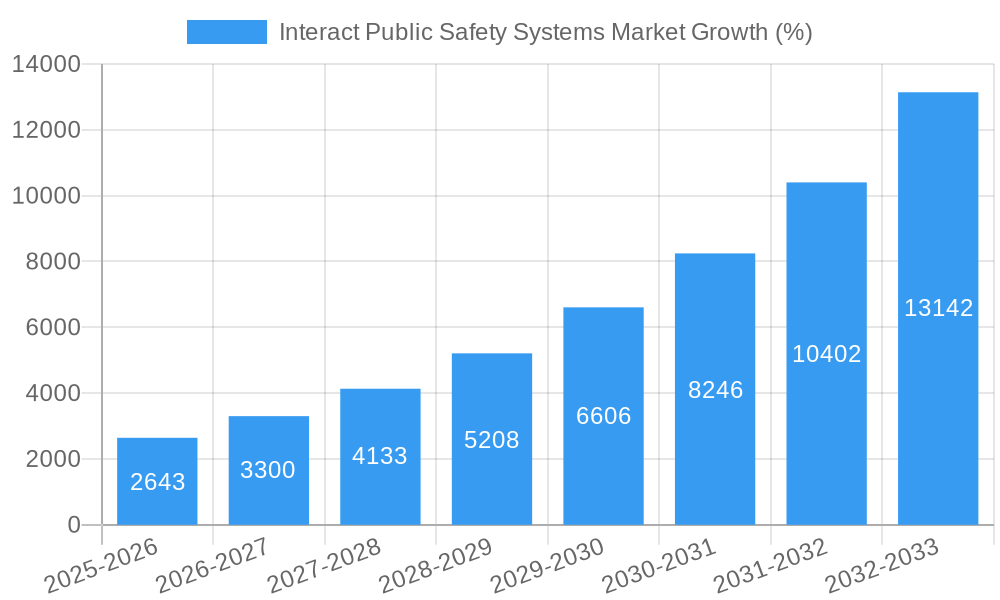
The Interact Public Safety Systems market is experiencing robust growth, projected to reach \$9.82 billion in 2025 and exhibiting a Compound Annual Growth Rate (CAGR) of 26.83% from 2025 to 2033. This expansion is driven by several key factors. Firstly, increasing government investments in advanced public safety technologies, particularly in developed nations like the U.S., the UK, and across the European Union, are fueling demand. Secondly, the rising adoption of cloud-based solutions offers enhanced scalability, accessibility, and cost-effectiveness, contributing significantly to market growth. The integration of Artificial Intelligence (AI) and Internet of Things (IoT) devices into these systems is improving situational awareness and response times, further driving adoption. Finally, the growing need for seamless interoperability between different emergency services (law enforcement, firefighting, medical) is pushing the demand for integrated public safety platforms. The market is segmented by deployment type (on-premise and cloud), end-user (law enforcement, medical, firefighting, transportation, and others), and component (software and services). While on-premise solutions currently dominate, cloud deployment is rapidly gaining traction due to its inherent advantages. The Law Enforcement sector is expected to remain the largest end-user segment throughout the forecast period.
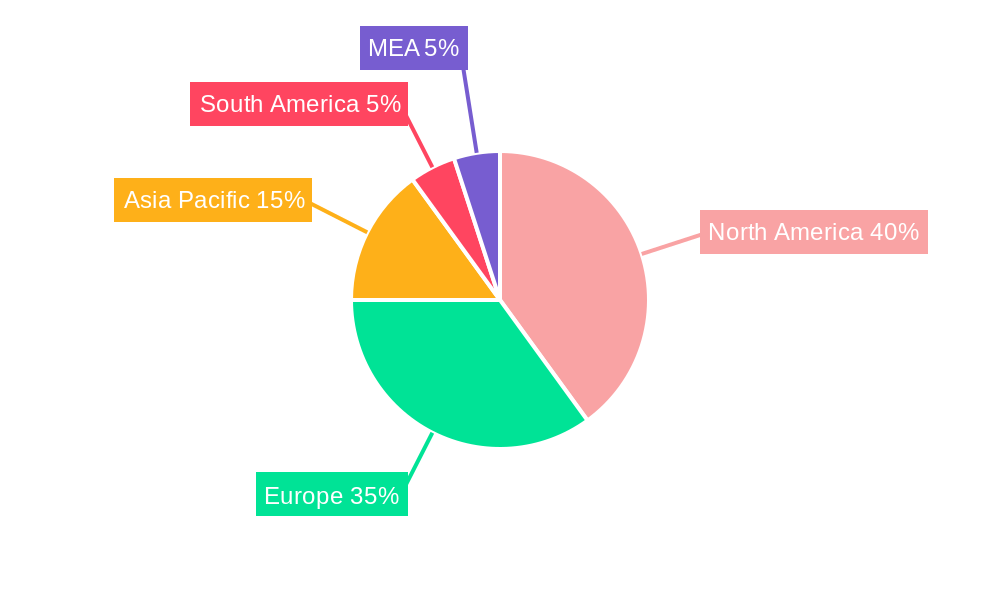
Despite the strong growth trajectory, the market faces some restraints. High initial investment costs for implementing comprehensive systems can be a barrier for smaller agencies, particularly in developing economies. Furthermore, concerns regarding data security and privacy associated with storing and sharing sensitive information are impacting the rate of adoption. The complexity of integrating various legacy systems with new interactive public safety platforms also presents a challenge. However, these restraints are likely to be mitigated by technological advancements that enhance security and interoperability, making these systems more affordable and user-friendly. The competitive landscape features established players like L3Harris Technologies, Motorola Solutions, Hexagon, Airbus, and NICE, continually innovating to improve their product offerings and expand their market share. Geographical growth is expected to be diverse, with North America and Europe maintaining dominant positions, followed by increasing adoption in Asia Pacific and other regions as technological advancements become more accessible and affordable.

Interact Public Safety Systems Market Report: 2019-2033
This comprehensive report provides a detailed analysis of the Interact Public Safety Systems Market, offering invaluable insights for industry professionals, investors, and strategic decision-makers. Covering the period from 2019 to 2033, with a focus on 2025, this report unravels market dynamics, growth drivers, challenges, and future opportunities within this crucial sector. The report leverages extensive market research to provide actionable intelligence, forecasting market trends and highlighting key players shaping the landscape. The report size is approximately 2500 words.
Interact Public Safety Systems Market Market Structure & Innovation Trends
The Interact Public Safety Systems Market is characterized by a moderately concentrated structure, with key players like L3Harris Technologies, Motorola Solutions, Hexagon, Airbus, and NICE holding significant market share. The exact market share distribution varies across segments, with some players dominating specific niches (e.g., software solutions versus services). The market exhibits robust innovation driven by the increasing demand for advanced technologies to enhance situational awareness, improve emergency response times, and bolster public safety. Regulatory frameworks, particularly concerning data privacy and security, heavily influence market dynamics. Product substitutes are limited, but competition intensifies with the emergence of new technologies and service providers. Mergers and acquisitions (M&A) activities play a crucial role in market consolidation and expansion. For example, several M&A deals totaling approximately $xx Million occurred between 2019 and 2024. End-user demographics play a vital role in shaping demand, with law enforcement agencies representing a significant portion of the market.
- Market Concentration: Moderately concentrated, with top 5 players holding approximately xx% market share in 2024.
- Innovation Drivers: Advancements in AI, IoT, big data analytics, and cloud computing.
- Regulatory Frameworks: HIPAA, GDPR, and other data privacy regulations impact product development and deployment.
- M&A Activity: Significant M&A activity observed, with deal values exceeding $xx Million in the historical period.
Interact Public Safety Systems Market Market Dynamics & Trends
The Interact Public Safety Systems Market is experiencing significant growth, driven by increasing government investments in public safety infrastructure, rising crime rates in urban areas, and the growing adoption of advanced technologies. Technological disruptions, particularly the proliferation of cloud-based solutions and AI-powered analytics, are reshaping the market landscape. Consumer preferences are shifting towards integrated, user-friendly systems that provide real-time information and improve collaboration among different emergency response agencies. Competitive dynamics are marked by intense rivalry among established players and the emergence of innovative startups. The market is projected to register a CAGR of xx% during the forecast period (2025-2033), with market penetration steadily increasing across various end-user segments.
Dominant Regions & Segments in Interact Public Safety Systems Market
The North American region, particularly the United States, currently dominates the Interact Public Safety Systems Market, driven by substantial investments in public safety infrastructure, stringent regulatory frameworks, and the high adoption rate of advanced technologies. Within the segment breakdown, the law enforcement sector represents the largest market share, followed by firefighting and medical emergency services. Cloud-based deployment is gaining traction due to its scalability, cost-effectiveness, and improved accessibility.
- Key Drivers in North America:
- High government spending on public safety initiatives.
- Stringent regulations regarding data security and interoperability.
- High technological adoption rate.
- Segment Dominance:
- End-User: Law Enforcement (largest share), followed by Firefighting and Medical.
- Deployment Type: Cloud-based deployment is experiencing faster growth than on-premise.
- Component: Software solutions are the primary revenue driver.
Interact Public Safety Systems Market Product Innovations
Recent product innovations focus on enhanced interoperability, improved data analytics capabilities, and the integration of AI and machine learning to enhance situational awareness and predictive policing. These innovations offer enhanced real-time communication, data-driven decision-making, and improved resource allocation, leading to significant competitive advantages for providers. The market is witnessing a move towards integrated platforms that combine various functionalities, streamlining operations and improving efficiency.
Report Scope & Segmentation Analysis
This report segments the Interact Public Safety Systems Market by deployment type (on-premise and cloud), end-user (law enforcement, medical, firefighting, transportation, and other), and component (software and services). Each segment provides detailed market size estimations, growth projections, and competitive analysis for the forecast period (2025-2033). The cloud-based segment is expected to exhibit the highest growth rate, driven by the advantages of scalability and cost-effectiveness. The law enforcement segment is projected to remain the largest end-user segment, with significant growth potential in emerging markets.
Key Drivers of Interact Public Safety Systems Market Growth
The growth of the Interact Public Safety Systems Market is driven by several factors, including increasing government investments in public safety, the rising adoption of cloud-based solutions, advancements in AI and machine learning, and the growing need for improved interoperability among different emergency response agencies. Government initiatives aimed at modernizing public safety infrastructure are also significantly contributing to market growth.
Challenges in the Interact Public Safety Systems Market Sector
The Interact Public Safety Systems Market faces challenges such as high initial investment costs, the complexities of integrating different systems, data security concerns, and the need for skilled personnel to operate and maintain advanced technologies. Regulatory hurdles and compatibility issues between different systems also present significant barriers to market growth. These factors can potentially reduce market growth by approximately xx% annually.
Emerging Opportunities in Interact Public Safety Systems Market
Emerging opportunities lie in the integration of emerging technologies such as blockchain for secure data management, the adoption of 5G for enhanced connectivity, and the development of AI-powered predictive policing tools. Expanding into new and developing markets, offering customized solutions to meet specific needs, and focusing on improving user experience can also unlock significant growth opportunities for market players.
Leading Players in the Interact Public Safety Systems Market Market
Key Developments in Interact Public Safety Systems Market Industry
- March 2023: Baltimore launched the Public Safety Accountability Dashboard, providing real-time crime statistics and enhancing transparency.
- October 2022: Oracle launched Public Safety Services, offering a comprehensive suite of cloud-based solutions for emergency response.
- November 2022: The SAN LUIS OBISPO (SLO) police department implemented SPIDR, improving communication and public confidence.
Future Outlook for Interact Public Safety Systems Market Market
The Interact Public Safety Systems Market is poised for continued growth, driven by technological advancements, increasing government investments, and a growing focus on enhancing public safety. Strategic partnerships, expansion into new markets, and the development of innovative solutions will be crucial for success in this dynamic market. The market is expected to continue its upward trajectory, with significant opportunities for growth and innovation in the years to come.
Interact Public Safety Systems Market Segmentation
-
1. Component
-
1.1. Software
- 1.1.1. Record Management
- 1.1.2. Investigation Management
- 1.1.3. Location Management
- 1.1.4. Criminal and Crime Intelligence
- 1.2. Services
-
1.1. Software
-
2. Deployment Type
- 2.1. On-premise
- 2.2. Cloud
-
3. End User
- 3.1. Law Enforcement
- 3.2. Medical
- 3.3. Firefighting
- 3.4. Transportation
- 3.5. Other End-Users
Interact Public Safety Systems Market Segmentation By Geography
-
1. North America
- 1.1. United States
- 1.2. Canada
-
2. Europe
- 2.1. Germany
- 2.2. United Kingdom
-
3. Asia
- 3.1. China
- 3.2. India
- 4. Australia and New Zealand
- 5. Latin America
- 6. Middle East and Africa
Interact Public Safety Systems Market REPORT HIGHLIGHTS
| Aspects | Details |
|---|---|
| Study Period | 2019-2033 |
| Base Year | 2024 |
| Estimated Year | 2025 |
| Forecast Period | 2025-2033 |
| Historical Period | 2019-2024 |
| Growth Rate | CAGR of 26.83% from 2019-2033 |
| Segmentation |
|
Table of Contents
- 1. Introduction
- 1.1. Research Scope
- 1.2. Market Segmentation
- 1.3. Research Methodology
- 1.4. Definitions and Assumptions
- 2. Executive Summary
- 2.1. Introduction
- 3. Market Dynamics
- 3.1. Introduction
- 3.2. Market Drivers
- 3.2.1 Growing Number of Global Catastrophic Accidents
- 3.2.2 Crime Rates
- 3.2.3 and Terrorist Activities; Rising Adoption of Advanced Technologies and Growth in Smart Cities
- 3.3. Market Restrains
- 3.3.1 Costs
- 3.3.2 Interoperability
- 3.3.3 and Security Concerns
- 3.4. Market Trends
- 3.4.1. Law Enforcement Expected to Hold a Significant Share
- 4. Market Factor Analysis
- 4.1. Porters Five Forces
- 4.2. Supply/Value Chain
- 4.3. PESTEL analysis
- 4.4. Market Entropy
- 4.5. Patent/Trademark Analysis
- 5. Global Interact Public Safety Systems Market Analysis, Insights and Forecast, 2019-2031
- 5.1. Market Analysis, Insights and Forecast - by Component
- 5.1.1. Software
- 5.1.1.1. Record Management
- 5.1.1.2. Investigation Management
- 5.1.1.3. Location Management
- 5.1.1.4. Criminal and Crime Intelligence
- 5.1.2. Services
- 5.1.1. Software
- 5.2. Market Analysis, Insights and Forecast - by Deployment Type
- 5.2.1. On-premise
- 5.2.2. Cloud
- 5.3. Market Analysis, Insights and Forecast - by End User
- 5.3.1. Law Enforcement
- 5.3.2. Medical
- 5.3.3. Firefighting
- 5.3.4. Transportation
- 5.3.5. Other End-Users
- 5.4. Market Analysis, Insights and Forecast - by Region
- 5.4.1. North America
- 5.4.2. Europe
- 5.4.3. Asia
- 5.4.4. Australia and New Zealand
- 5.4.5. Latin America
- 5.4.6. Middle East and Africa
- 5.1. Market Analysis, Insights and Forecast - by Component
- 6. North America Interact Public Safety Systems Market Analysis, Insights and Forecast, 2019-2031
- 6.1. Market Analysis, Insights and Forecast - by Component
- 6.1.1. Software
- 6.1.1.1. Record Management
- 6.1.1.2. Investigation Management
- 6.1.1.3. Location Management
- 6.1.1.4. Criminal and Crime Intelligence
- 6.1.2. Services
- 6.1.1. Software
- 6.2. Market Analysis, Insights and Forecast - by Deployment Type
- 6.2.1. On-premise
- 6.2.2. Cloud
- 6.3. Market Analysis, Insights and Forecast - by End User
- 6.3.1. Law Enforcement
- 6.3.2. Medical
- 6.3.3. Firefighting
- 6.3.4. Transportation
- 6.3.5. Other End-Users
- 6.1. Market Analysis, Insights and Forecast - by Component
- 7. Europe Interact Public Safety Systems Market Analysis, Insights and Forecast, 2019-2031
- 7.1. Market Analysis, Insights and Forecast - by Component
- 7.1.1. Software
- 7.1.1.1. Record Management
- 7.1.1.2. Investigation Management
- 7.1.1.3. Location Management
- 7.1.1.4. Criminal and Crime Intelligence
- 7.1.2. Services
- 7.1.1. Software
- 7.2. Market Analysis, Insights and Forecast - by Deployment Type
- 7.2.1. On-premise
- 7.2.2. Cloud
- 7.3. Market Analysis, Insights and Forecast - by End User
- 7.3.1. Law Enforcement
- 7.3.2. Medical
- 7.3.3. Firefighting
- 7.3.4. Transportation
- 7.3.5. Other End-Users
- 7.1. Market Analysis, Insights and Forecast - by Component
- 8. Asia Interact Public Safety Systems Market Analysis, Insights and Forecast, 2019-2031
- 8.1. Market Analysis, Insights and Forecast - by Component
- 8.1.1. Software
- 8.1.1.1. Record Management
- 8.1.1.2. Investigation Management
- 8.1.1.3. Location Management
- 8.1.1.4. Criminal and Crime Intelligence
- 8.1.2. Services
- 8.1.1. Software
- 8.2. Market Analysis, Insights and Forecast - by Deployment Type
- 8.2.1. On-premise
- 8.2.2. Cloud
- 8.3. Market Analysis, Insights and Forecast - by End User
- 8.3.1. Law Enforcement
- 8.3.2. Medical
- 8.3.3. Firefighting
- 8.3.4. Transportation
- 8.3.5. Other End-Users
- 8.1. Market Analysis, Insights and Forecast - by Component
- 9. Australia and New Zealand Interact Public Safety Systems Market Analysis, Insights and Forecast, 2019-2031
- 9.1. Market Analysis, Insights and Forecast - by Component
- 9.1.1. Software
- 9.1.1.1. Record Management
- 9.1.1.2. Investigation Management
- 9.1.1.3. Location Management
- 9.1.1.4. Criminal and Crime Intelligence
- 9.1.2. Services
- 9.1.1. Software
- 9.2. Market Analysis, Insights and Forecast - by Deployment Type
- 9.2.1. On-premise
- 9.2.2. Cloud
- 9.3. Market Analysis, Insights and Forecast - by End User
- 9.3.1. Law Enforcement
- 9.3.2. Medical
- 9.3.3. Firefighting
- 9.3.4. Transportation
- 9.3.5. Other End-Users
- 9.1. Market Analysis, Insights and Forecast - by Component
- 10. Latin America Interact Public Safety Systems Market Analysis, Insights and Forecast, 2019-2031
- 10.1. Market Analysis, Insights and Forecast - by Component
- 10.1.1. Software
- 10.1.1.1. Record Management
- 10.1.1.2. Investigation Management
- 10.1.1.3. Location Management
- 10.1.1.4. Criminal and Crime Intelligence
- 10.1.2. Services
- 10.1.1. Software
- 10.2. Market Analysis, Insights and Forecast - by Deployment Type
- 10.2.1. On-premise
- 10.2.2. Cloud
- 10.3. Market Analysis, Insights and Forecast - by End User
- 10.3.1. Law Enforcement
- 10.3.2. Medical
- 10.3.3. Firefighting
- 10.3.4. Transportation
- 10.3.5. Other End-Users
- 10.1. Market Analysis, Insights and Forecast - by Component
- 11. Middle East and Africa Interact Public Safety Systems Market Analysis, Insights and Forecast, 2019-2031
- 11.1. Market Analysis, Insights and Forecast - by Component
- 11.1.1. Software
- 11.1.1.1. Record Management
- 11.1.1.2. Investigation Management
- 11.1.1.3. Location Management
- 11.1.1.4. Criminal and Crime Intelligence
- 11.1.2. Services
- 11.1.1. Software
- 11.2. Market Analysis, Insights and Forecast - by Deployment Type
- 11.2.1. On-premise
- 11.2.2. Cloud
- 11.3. Market Analysis, Insights and Forecast - by End User
- 11.3.1. Law Enforcement
- 11.3.2. Medical
- 11.3.3. Firefighting
- 11.3.4. Transportation
- 11.3.5. Other End-Users
- 11.1. Market Analysis, Insights and Forecast - by Component
- 12. North America Interact Public Safety Systems Market Analysis, Insights and Forecast, 2019-2031
- 12.1. Market Analysis, Insights and Forecast - By Country/Sub-region
- 12.1.1 United States
- 12.1.2 Canada
- 12.1.3 Mexico
- 13. Europe Interact Public Safety Systems Market Analysis, Insights and Forecast, 2019-2031
- 13.1. Market Analysis, Insights and Forecast - By Country/Sub-region
- 13.1.1 Germany
- 13.1.2 United Kingdom
- 13.1.3 France
- 13.1.4 Spain
- 13.1.5 Italy
- 13.1.6 Spain
- 13.1.7 Belgium
- 13.1.8 Netherland
- 13.1.9 Nordics
- 13.1.10 Rest of Europe
- 14. Asia Pacific Interact Public Safety Systems Market Analysis, Insights and Forecast, 2019-2031
- 14.1. Market Analysis, Insights and Forecast - By Country/Sub-region
- 14.1.1 China
- 14.1.2 Japan
- 14.1.3 India
- 14.1.4 South Korea
- 14.1.5 Southeast Asia
- 14.1.6 Australia
- 14.1.7 Indonesia
- 14.1.8 Phillipes
- 14.1.9 Singapore
- 14.1.10 Thailandc
- 14.1.11 Rest of Asia Pacific
- 15. South America Interact Public Safety Systems Market Analysis, Insights and Forecast, 2019-2031
- 15.1. Market Analysis, Insights and Forecast - By Country/Sub-region
- 15.1.1 Brazil
- 15.1.2 Argentina
- 15.1.3 Peru
- 15.1.4 Chile
- 15.1.5 Colombia
- 15.1.6 Ecuador
- 15.1.7 Venezuela
- 15.1.8 Rest of South America
- 16. MEA Interact Public Safety Systems Market Analysis, Insights and Forecast, 2019-2031
- 16.1. Market Analysis, Insights and Forecast - By Country/Sub-region
- 16.1.1 United Arab Emirates
- 16.1.2 Saudi Arabia
- 16.1.3 South Africa
- 16.1.4 Rest of Middle East and Africa
- 17. Competitive Analysis
- 17.1. Global Market Share Analysis 2024
- 17.2. Company Profiles
- 17.2.1 L3Harris Technologies
- 17.2.1.1. Overview
- 17.2.1.2. Products
- 17.2.1.3. SWOT Analysis
- 17.2.1.4. Recent Developments
- 17.2.1.5. Financials (Based on Availability)
- 17.2.2 Motorola Solutions
- 17.2.2.1. Overview
- 17.2.2.2. Products
- 17.2.2.3. SWOT Analysis
- 17.2.2.4. Recent Developments
- 17.2.2.5. Financials (Based on Availability)
- 17.2.3 Hexagon
- 17.2.3.1. Overview
- 17.2.3.2. Products
- 17.2.3.3. SWOT Analysis
- 17.2.3.4. Recent Developments
- 17.2.3.5. Financials (Based on Availability)
- 17.2.4 Airbus
- 17.2.4.1. Overview
- 17.2.4.2. Products
- 17.2.4.3. SWOT Analysis
- 17.2.4.4. Recent Developments
- 17.2.4.5. Financials (Based on Availability)
- 17.2.5 NICE
- 17.2.5.1. Overview
- 17.2.5.2. Products
- 17.2.5.3. SWOT Analysis
- 17.2.5.4. Recent Developments
- 17.2.5.5. Financials (Based on Availability)
- 17.2.1 L3Harris Technologies
List of Figures
- Figure 1: Global Interact Public Safety Systems Market Revenue Breakdown (Million, %) by Region 2024 & 2032
- Figure 2: North America Interact Public Safety Systems Market Revenue (Million), by Country 2024 & 2032
- Figure 3: North America Interact Public Safety Systems Market Revenue Share (%), by Country 2024 & 2032
- Figure 4: Europe Interact Public Safety Systems Market Revenue (Million), by Country 2024 & 2032
- Figure 5: Europe Interact Public Safety Systems Market Revenue Share (%), by Country 2024 & 2032
- Figure 6: Asia Pacific Interact Public Safety Systems Market Revenue (Million), by Country 2024 & 2032
- Figure 7: Asia Pacific Interact Public Safety Systems Market Revenue Share (%), by Country 2024 & 2032
- Figure 8: South America Interact Public Safety Systems Market Revenue (Million), by Country 2024 & 2032
- Figure 9: South America Interact Public Safety Systems Market Revenue Share (%), by Country 2024 & 2032
- Figure 10: MEA Interact Public Safety Systems Market Revenue (Million), by Country 2024 & 2032
- Figure 11: MEA Interact Public Safety Systems Market Revenue Share (%), by Country 2024 & 2032
- Figure 12: North America Interact Public Safety Systems Market Revenue (Million), by Component 2024 & 2032
- Figure 13: North America Interact Public Safety Systems Market Revenue Share (%), by Component 2024 & 2032
- Figure 14: North America Interact Public Safety Systems Market Revenue (Million), by Deployment Type 2024 & 2032
- Figure 15: North America Interact Public Safety Systems Market Revenue Share (%), by Deployment Type 2024 & 2032
- Figure 16: North America Interact Public Safety Systems Market Revenue (Million), by End User 2024 & 2032
- Figure 17: North America Interact Public Safety Systems Market Revenue Share (%), by End User 2024 & 2032
- Figure 18: North America Interact Public Safety Systems Market Revenue (Million), by Country 2024 & 2032
- Figure 19: North America Interact Public Safety Systems Market Revenue Share (%), by Country 2024 & 2032
- Figure 20: Europe Interact Public Safety Systems Market Revenue (Million), by Component 2024 & 2032
- Figure 21: Europe Interact Public Safety Systems Market Revenue Share (%), by Component 2024 & 2032
- Figure 22: Europe Interact Public Safety Systems Market Revenue (Million), by Deployment Type 2024 & 2032
- Figure 23: Europe Interact Public Safety Systems Market Revenue Share (%), by Deployment Type 2024 & 2032
- Figure 24: Europe Interact Public Safety Systems Market Revenue (Million), by End User 2024 & 2032
- Figure 25: Europe Interact Public Safety Systems Market Revenue Share (%), by End User 2024 & 2032
- Figure 26: Europe Interact Public Safety Systems Market Revenue (Million), by Country 2024 & 2032
- Figure 27: Europe Interact Public Safety Systems Market Revenue Share (%), by Country 2024 & 2032
- Figure 28: Asia Interact Public Safety Systems Market Revenue (Million), by Component 2024 & 2032
- Figure 29: Asia Interact Public Safety Systems Market Revenue Share (%), by Component 2024 & 2032
- Figure 30: Asia Interact Public Safety Systems Market Revenue (Million), by Deployment Type 2024 & 2032
- Figure 31: Asia Interact Public Safety Systems Market Revenue Share (%), by Deployment Type 2024 & 2032
- Figure 32: Asia Interact Public Safety Systems Market Revenue (Million), by End User 2024 & 2032
- Figure 33: Asia Interact Public Safety Systems Market Revenue Share (%), by End User 2024 & 2032
- Figure 34: Asia Interact Public Safety Systems Market Revenue (Million), by Country 2024 & 2032
- Figure 35: Asia Interact Public Safety Systems Market Revenue Share (%), by Country 2024 & 2032
- Figure 36: Australia and New Zealand Interact Public Safety Systems Market Revenue (Million), by Component 2024 & 2032
- Figure 37: Australia and New Zealand Interact Public Safety Systems Market Revenue Share (%), by Component 2024 & 2032
- Figure 38: Australia and New Zealand Interact Public Safety Systems Market Revenue (Million), by Deployment Type 2024 & 2032
- Figure 39: Australia and New Zealand Interact Public Safety Systems Market Revenue Share (%), by Deployment Type 2024 & 2032
- Figure 40: Australia and New Zealand Interact Public Safety Systems Market Revenue (Million), by End User 2024 & 2032
- Figure 41: Australia and New Zealand Interact Public Safety Systems Market Revenue Share (%), by End User 2024 & 2032
- Figure 42: Australia and New Zealand Interact Public Safety Systems Market Revenue (Million), by Country 2024 & 2032
- Figure 43: Australia and New Zealand Interact Public Safety Systems Market Revenue Share (%), by Country 2024 & 2032
- Figure 44: Latin America Interact Public Safety Systems Market Revenue (Million), by Component 2024 & 2032
- Figure 45: Latin America Interact Public Safety Systems Market Revenue Share (%), by Component 2024 & 2032
- Figure 46: Latin America Interact Public Safety Systems Market Revenue (Million), by Deployment Type 2024 & 2032
- Figure 47: Latin America Interact Public Safety Systems Market Revenue Share (%), by Deployment Type 2024 & 2032
- Figure 48: Latin America Interact Public Safety Systems Market Revenue (Million), by End User 2024 & 2032
- Figure 49: Latin America Interact Public Safety Systems Market Revenue Share (%), by End User 2024 & 2032
- Figure 50: Latin America Interact Public Safety Systems Market Revenue (Million), by Country 2024 & 2032
- Figure 51: Latin America Interact Public Safety Systems Market Revenue Share (%), by Country 2024 & 2032
- Figure 52: Middle East and Africa Interact Public Safety Systems Market Revenue (Million), by Component 2024 & 2032
- Figure 53: Middle East and Africa Interact Public Safety Systems Market Revenue Share (%), by Component 2024 & 2032
- Figure 54: Middle East and Africa Interact Public Safety Systems Market Revenue (Million), by Deployment Type 2024 & 2032
- Figure 55: Middle East and Africa Interact Public Safety Systems Market Revenue Share (%), by Deployment Type 2024 & 2032
- Figure 56: Middle East and Africa Interact Public Safety Systems Market Revenue (Million), by End User 2024 & 2032
- Figure 57: Middle East and Africa Interact Public Safety Systems Market Revenue Share (%), by End User 2024 & 2032
- Figure 58: Middle East and Africa Interact Public Safety Systems Market Revenue (Million), by Country 2024 & 2032
- Figure 59: Middle East and Africa Interact Public Safety Systems Market Revenue Share (%), by Country 2024 & 2032
List of Tables
- Table 1: Global Interact Public Safety Systems Market Revenue Million Forecast, by Region 2019 & 2032
- Table 2: Global Interact Public Safety Systems Market Revenue Million Forecast, by Component 2019 & 2032
- Table 3: Global Interact Public Safety Systems Market Revenue Million Forecast, by Deployment Type 2019 & 2032
- Table 4: Global Interact Public Safety Systems Market Revenue Million Forecast, by End User 2019 & 2032
- Table 5: Global Interact Public Safety Systems Market Revenue Million Forecast, by Region 2019 & 2032
- Table 6: Global Interact Public Safety Systems Market Revenue Million Forecast, by Country 2019 & 2032
- Table 7: United States Interact Public Safety Systems Market Revenue (Million) Forecast, by Application 2019 & 2032
- Table 8: Canada Interact Public Safety Systems Market Revenue (Million) Forecast, by Application 2019 & 2032
- Table 9: Mexico Interact Public Safety Systems Market Revenue (Million) Forecast, by Application 2019 & 2032
- Table 10: Global Interact Public Safety Systems Market Revenue Million Forecast, by Country 2019 & 2032
- Table 11: Germany Interact Public Safety Systems Market Revenue (Million) Forecast, by Application 2019 & 2032
- Table 12: United Kingdom Interact Public Safety Systems Market Revenue (Million) Forecast, by Application 2019 & 2032
- Table 13: France Interact Public Safety Systems Market Revenue (Million) Forecast, by Application 2019 & 2032
- Table 14: Spain Interact Public Safety Systems Market Revenue (Million) Forecast, by Application 2019 & 2032
- Table 15: Italy Interact Public Safety Systems Market Revenue (Million) Forecast, by Application 2019 & 2032
- Table 16: Spain Interact Public Safety Systems Market Revenue (Million) Forecast, by Application 2019 & 2032
- Table 17: Belgium Interact Public Safety Systems Market Revenue (Million) Forecast, by Application 2019 & 2032
- Table 18: Netherland Interact Public Safety Systems Market Revenue (Million) Forecast, by Application 2019 & 2032
- Table 19: Nordics Interact Public Safety Systems Market Revenue (Million) Forecast, by Application 2019 & 2032
- Table 20: Rest of Europe Interact Public Safety Systems Market Revenue (Million) Forecast, by Application 2019 & 2032
- Table 21: Global Interact Public Safety Systems Market Revenue Million Forecast, by Country 2019 & 2032
- Table 22: China Interact Public Safety Systems Market Revenue (Million) Forecast, by Application 2019 & 2032
- Table 23: Japan Interact Public Safety Systems Market Revenue (Million) Forecast, by Application 2019 & 2032
- Table 24: India Interact Public Safety Systems Market Revenue (Million) Forecast, by Application 2019 & 2032
- Table 25: South Korea Interact Public Safety Systems Market Revenue (Million) Forecast, by Application 2019 & 2032
- Table 26: Southeast Asia Interact Public Safety Systems Market Revenue (Million) Forecast, by Application 2019 & 2032
- Table 27: Australia Interact Public Safety Systems Market Revenue (Million) Forecast, by Application 2019 & 2032
- Table 28: Indonesia Interact Public Safety Systems Market Revenue (Million) Forecast, by Application 2019 & 2032
- Table 29: Phillipes Interact Public Safety Systems Market Revenue (Million) Forecast, by Application 2019 & 2032
- Table 30: Singapore Interact Public Safety Systems Market Revenue (Million) Forecast, by Application 2019 & 2032
- Table 31: Thailandc Interact Public Safety Systems Market Revenue (Million) Forecast, by Application 2019 & 2032
- Table 32: Rest of Asia Pacific Interact Public Safety Systems Market Revenue (Million) Forecast, by Application 2019 & 2032
- Table 33: Global Interact Public Safety Systems Market Revenue Million Forecast, by Country 2019 & 2032
- Table 34: Brazil Interact Public Safety Systems Market Revenue (Million) Forecast, by Application 2019 & 2032
- Table 35: Argentina Interact Public Safety Systems Market Revenue (Million) Forecast, by Application 2019 & 2032
- Table 36: Peru Interact Public Safety Systems Market Revenue (Million) Forecast, by Application 2019 & 2032
- Table 37: Chile Interact Public Safety Systems Market Revenue (Million) Forecast, by Application 2019 & 2032
- Table 38: Colombia Interact Public Safety Systems Market Revenue (Million) Forecast, by Application 2019 & 2032
- Table 39: Ecuador Interact Public Safety Systems Market Revenue (Million) Forecast, by Application 2019 & 2032
- Table 40: Venezuela Interact Public Safety Systems Market Revenue (Million) Forecast, by Application 2019 & 2032
- Table 41: Rest of South America Interact Public Safety Systems Market Revenue (Million) Forecast, by Application 2019 & 2032
- Table 42: Global Interact Public Safety Systems Market Revenue Million Forecast, by Country 2019 & 2032
- Table 43: United Arab Emirates Interact Public Safety Systems Market Revenue (Million) Forecast, by Application 2019 & 2032
- Table 44: Saudi Arabia Interact Public Safety Systems Market Revenue (Million) Forecast, by Application 2019 & 2032
- Table 45: South Africa Interact Public Safety Systems Market Revenue (Million) Forecast, by Application 2019 & 2032
- Table 46: Rest of Middle East and Africa Interact Public Safety Systems Market Revenue (Million) Forecast, by Application 2019 & 2032
- Table 47: Global Interact Public Safety Systems Market Revenue Million Forecast, by Component 2019 & 2032
- Table 48: Global Interact Public Safety Systems Market Revenue Million Forecast, by Deployment Type 2019 & 2032
- Table 49: Global Interact Public Safety Systems Market Revenue Million Forecast, by End User 2019 & 2032
- Table 50: Global Interact Public Safety Systems Market Revenue Million Forecast, by Country 2019 & 2032
- Table 51: United States Interact Public Safety Systems Market Revenue (Million) Forecast, by Application 2019 & 2032
- Table 52: Canada Interact Public Safety Systems Market Revenue (Million) Forecast, by Application 2019 & 2032
- Table 53: Global Interact Public Safety Systems Market Revenue Million Forecast, by Component 2019 & 2032
- Table 54: Global Interact Public Safety Systems Market Revenue Million Forecast, by Deployment Type 2019 & 2032
- Table 55: Global Interact Public Safety Systems Market Revenue Million Forecast, by End User 2019 & 2032
- Table 56: Global Interact Public Safety Systems Market Revenue Million Forecast, by Country 2019 & 2032
- Table 57: Germany Interact Public Safety Systems Market Revenue (Million) Forecast, by Application 2019 & 2032
- Table 58: United Kingdom Interact Public Safety Systems Market Revenue (Million) Forecast, by Application 2019 & 2032
- Table 59: Global Interact Public Safety Systems Market Revenue Million Forecast, by Component 2019 & 2032
- Table 60: Global Interact Public Safety Systems Market Revenue Million Forecast, by Deployment Type 2019 & 2032
- Table 61: Global Interact Public Safety Systems Market Revenue Million Forecast, by End User 2019 & 2032
- Table 62: Global Interact Public Safety Systems Market Revenue Million Forecast, by Country 2019 & 2032
- Table 63: China Interact Public Safety Systems Market Revenue (Million) Forecast, by Application 2019 & 2032
- Table 64: India Interact Public Safety Systems Market Revenue (Million) Forecast, by Application 2019 & 2032
- Table 65: Global Interact Public Safety Systems Market Revenue Million Forecast, by Component 2019 & 2032
- Table 66: Global Interact Public Safety Systems Market Revenue Million Forecast, by Deployment Type 2019 & 2032
- Table 67: Global Interact Public Safety Systems Market Revenue Million Forecast, by End User 2019 & 2032
- Table 68: Global Interact Public Safety Systems Market Revenue Million Forecast, by Country 2019 & 2032
- Table 69: Global Interact Public Safety Systems Market Revenue Million Forecast, by Component 2019 & 2032
- Table 70: Global Interact Public Safety Systems Market Revenue Million Forecast, by Deployment Type 2019 & 2032
- Table 71: Global Interact Public Safety Systems Market Revenue Million Forecast, by End User 2019 & 2032
- Table 72: Global Interact Public Safety Systems Market Revenue Million Forecast, by Country 2019 & 2032
- Table 73: Global Interact Public Safety Systems Market Revenue Million Forecast, by Component 2019 & 2032
- Table 74: Global Interact Public Safety Systems Market Revenue Million Forecast, by Deployment Type 2019 & 2032
- Table 75: Global Interact Public Safety Systems Market Revenue Million Forecast, by End User 2019 & 2032
- Table 76: Global Interact Public Safety Systems Market Revenue Million Forecast, by Country 2019 & 2032
Frequently Asked Questions
1. What is the projected Compound Annual Growth Rate (CAGR) of the Interact Public Safety Systems Market?
The projected CAGR is approximately 26.83%.
2. Which companies are prominent players in the Interact Public Safety Systems Market?
Key companies in the market include L3Harris Technologies , Motorola Solutions , Hexagon, Airbus, NICE.
3. What are the main segments of the Interact Public Safety Systems Market?
The market segments include Component, Deployment Type, End User.
4. Can you provide details about the market size?
The market size is estimated to be USD 9.82 Million as of 2022.
5. What are some drivers contributing to market growth?
Growing Number of Global Catastrophic Accidents. Crime Rates. and Terrorist Activities; Rising Adoption of Advanced Technologies and Growth in Smart Cities.
6. What are the notable trends driving market growth?
Law Enforcement Expected to Hold a Significant Share.
7. Are there any restraints impacting market growth?
Costs. Interoperability. and Security Concerns.
8. Can you provide examples of recent developments in the market?
November 2022 - The police department in California, SAN LUIS OBISPO (SLO), launched the Specialized Police Intelligence and Data Resource (SPIDR), which provides status updates on complaints and reports to public callers. The platform will build public confidence and increase customer satisfaction.
9. What pricing options are available for accessing the report?
Pricing options include single-user, multi-user, and enterprise licenses priced at USD 4750, USD 5250, and USD 8750 respectively.
10. Is the market size provided in terms of value or volume?
The market size is provided in terms of value, measured in Million.
11. Are there any specific market keywords associated with the report?
Yes, the market keyword associated with the report is "Interact Public Safety Systems Market," which aids in identifying and referencing the specific market segment covered.
12. How do I determine which pricing option suits my needs best?
The pricing options vary based on user requirements and access needs. Individual users may opt for single-user licenses, while businesses requiring broader access may choose multi-user or enterprise licenses for cost-effective access to the report.
13. Are there any additional resources or data provided in the Interact Public Safety Systems Market report?
While the report offers comprehensive insights, it's advisable to review the specific contents or supplementary materials provided to ascertain if additional resources or data are available.
14. How can I stay updated on further developments or reports in the Interact Public Safety Systems Market?
To stay informed about further developments, trends, and reports in the Interact Public Safety Systems Market, consider subscribing to industry newsletters, following relevant companies and organizations, or regularly checking reputable industry news sources and publications.
Methodology
Step 1 - Identification of Relevant Samples Size from Population Database


Step 2 - Approaches for Defining Global Market Size (Value, Volume* & Price*)

Note*: In applicable scenarios
Step 3 - Data Sources
Primary Research
- Web Analytics
- Survey Reports
- Research Institute
- Latest Research Reports
- Opinion Leaders
Secondary Research
- Annual Reports
- White Paper
- Latest Press Release
- Industry Association
- Paid Database
- Investor Presentations

Step 4 - Data Triangulation
Involves using different sources of information in order to increase the validity of a study
These sources are likely to be stakeholders in a program - participants, other researchers, program staff, other community members, and so on.
Then we put all data in single framework & apply various statistical tools to find out the dynamic on the market.
During the analysis stage, feedback from the stakeholder groups would be compared to determine areas of agreement as well as areas of divergence


