
Key Insights
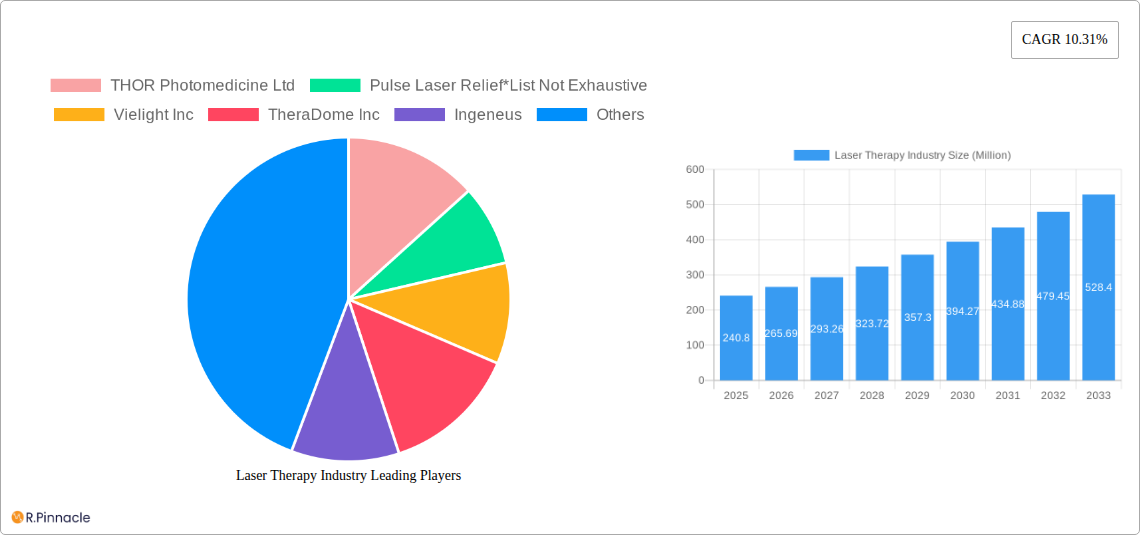
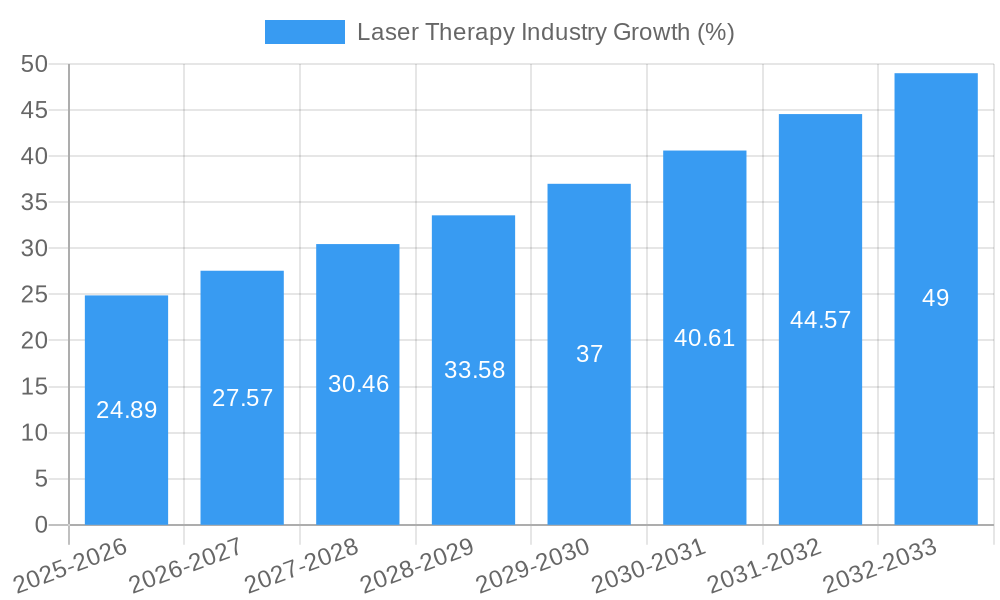
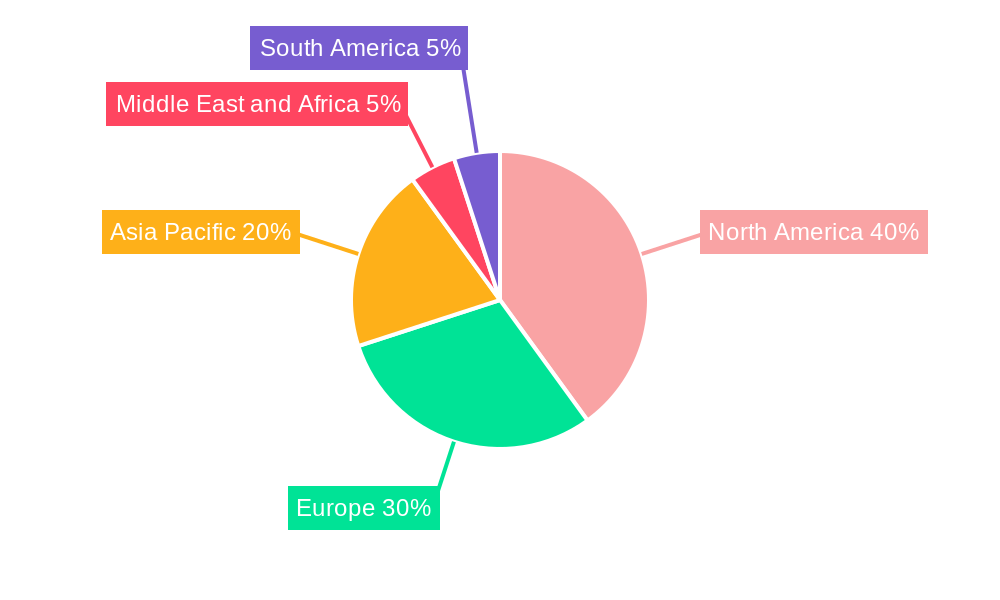
The global laser therapy market, valued at $240.80 million in 2025, is projected to experience robust growth, driven by a Compound Annual Growth Rate (CAGR) of 10.31% from 2025 to 2033. This expansion is fueled by several key factors. The increasing prevalence of chronic conditions like pain and wounds, coupled with the rising adoption of minimally invasive procedures, significantly boosts demand for laser therapy. Technological advancements leading to more efficient and portable devices, combined with growing awareness among healthcare professionals and patients regarding the efficacy and safety of laser treatments, further propel market growth. The diverse applications of laser therapy, spanning wound care, pain management, and cosmetic procedures, contribute to its broad appeal across various healthcare settings. Specific segments like infrared and red light wavelengths are experiencing substantial traction due to their proven therapeutic benefits. North America currently holds a significant market share, attributed to higher healthcare expenditure and technological advancements, but the Asia-Pacific region is expected to demonstrate rapid growth due to rising disposable incomes and increasing healthcare infrastructure. Competition among established players and emerging companies is driving innovation and accessibility of laser therapy solutions.
The market segmentation reveals significant opportunities across different application areas. Wound care, leveraging laser's ability to stimulate tissue regeneration, represents a substantial segment. Similarly, pain management applications, employing laser therapy for its analgesic properties, are witnessing a surge in demand. The cosmetic application segment, encompassing treatments like hair restoration and skin rejuvenation, is also contributing significantly to the overall market growth. The various end-user segments, including specialty clinics and research institutes, showcase the diverse adoption of this technology across healthcare sectors. While the market faces challenges such as high initial investment costs for advanced laser systems and the need for skilled professionals for administering treatments, the overall outlook remains strongly positive, with continued technological advancements and increasing clinical evidence supporting the expansion of this promising therapeutic modality. The forecast period of 2025-2033 will likely see a significant expansion in market value and penetration across various geographical regions.
Laser Therapy Industry Market Report: 2019-2033
This comprehensive report provides a detailed analysis of the global Laser Therapy industry, projecting a market value exceeding $XX Million by 2033. The study covers the period from 2019 to 2033, with 2025 serving as the base and estimated year. This in-depth analysis is essential for industry professionals, investors, and strategic decision-makers seeking actionable insights into this rapidly evolving market.
Laser Therapy Industry Market Structure & Innovation Trends
The global laser therapy market displays a moderately fragmented structure, with several key players competing for market share. While some companies like THOR Photomedicine Ltd, Pulse Laser Relief, Vielight Inc, TheraDome Inc, and Erchonia Corporation hold significant positions, many smaller firms contribute to the overall market dynamics. Market share estimations for 2025 suggest THOR Photomedicine Ltd holds approximately 10%, while Pulse Laser Relief holds approximately 5% of the market. The remaining share is distributed amongst other players. M&A activity in the sector has been relatively modest in recent years, with total deal values estimated at $XX Million between 2019-2024. Innovation is driven by advancements in laser technology, particularly in wavelength specificity and delivery systems. Regulatory frameworks vary across regions, impacting market penetration and adoption rates. Product substitutes, such as traditional therapies, continue to pose a challenge, while the increasing demand for non-invasive treatments fuels the market's growth. The end-user demographic is expanding, including a growing number of specialty clinics and research institutes.
- Market Concentration: Moderately fragmented.
- Innovation Drivers: Advancements in laser technology, increasing demand for non-invasive treatments.
- Regulatory Frameworks: Vary across regions, impacting market penetration.
- Product Substitutes: Traditional therapies.
- End-User Demographics: Expanding to include more specialty clinics and research institutes.
- M&A Activity (2019-2024): Estimated at $XX Million.
Laser Therapy Industry Market Dynamics & Trends
The laser therapy market is experiencing robust growth, projected to achieve a CAGR of XX% during the forecast period (2025-2033). This growth is fueled by several key factors. The increasing prevalence of chronic pain conditions and the rising demand for minimally invasive procedures are significant drivers. Technological advancements, such as the development of more efficient and portable devices, are also contributing to market expansion. Changing consumer preferences, favoring non-pharmaceutical solutions, further fuel market growth. However, competitive dynamics remain intense, with established players and new entrants vying for market share. Market penetration in key regions remains relatively low, indicating significant untapped potential. The high cost of laser therapy devices can also hinder market growth, especially in low and middle-income countries. Furthermore, the stringent regulatory approvals required for these devices pose a challenge for market entry.
Dominant Regions & Segments in Laser Therapy Industry
The North American region currently dominates the laser therapy market, driven by high healthcare expenditure, advanced medical infrastructure, and a relatively high adoption rate of innovative technologies. Within the applications segment, pain management represents the largest segment, accounting for approximately 40% of the total market revenue in 2025. The infrared light wavelength type dominates the market due to its efficacy in various therapeutic applications. Specialty clinics are the leading end-users, owing to their expertise and specialized equipment.
- Leading Region: North America
- Leading Application Segment: Pain Management
- Leading Wavelength Type: Infrared Light
- Leading End-User: Specialty Clinics
Key Drivers for North American Dominance:
- High healthcare expenditure.
- Advanced medical infrastructure.
- High adoption rate of innovative technologies.
- Strong regulatory frameworks supporting the use of laser therapy.
Laser Therapy Industry Product Innovations
Recent product innovations focus on enhancing the portability, efficacy, and ease of use of laser therapy devices. Miniaturized devices with improved wavelength specificity are gaining traction. Companies are also developing integrated systems combining laser therapy with other treatment modalities, such as photobiomodulation, to improve treatment outcomes and create a more comprehensive approach to patient care. These innovations are designed to meet the evolving needs of healthcare providers and patients, making laser therapy more accessible and convenient.
Report Scope & Segmentation Analysis
This report segments the laser therapy market by application (wound care, pain management, cosmetic application, other applications), wavelength type (infrared light, red light, other wavelength types), and end-user (specialty clinics, research institutes, other end-users). The pain management application segment is projected to exhibit the highest growth rate during the forecast period, driven by the increasing prevalence of chronic pain conditions. The infrared light wavelength segment is expected to maintain its market leadership due to its versatility and effectiveness. Specialty clinics are expected to remain the dominant end-user segment, owing to their specialized expertise and established patient bases. Each segment's market size, growth projections, and competitive dynamics are analyzed in detail within the report.
Key Drivers of Laser Therapy Industry Growth
The laser therapy industry's growth is fueled by several key factors:
- Technological advancements: Improved device design, increased efficacy, and portability.
- Rising prevalence of chronic diseases: Increasing demand for effective pain management and wound care solutions.
- Favorable regulatory landscape: Growing acceptance and approval of laser therapy in various healthcare settings.
- Increasing healthcare expenditure: Greater investment in advanced medical technologies.
Challenges in the Laser Therapy Industry Sector
The laser therapy industry faces several challenges:
- High initial investment costs: Can hinder market penetration, especially in resource-constrained settings.
- Stringent regulatory approvals: Can delay market entry and increase development costs.
- Competition from alternative therapies: Traditional treatments continue to compete with laser therapy.
- Lack of widespread awareness: Limited knowledge among patients and healthcare professionals about laser therapy's benefits.
Emerging Opportunities in Laser Therapy Industry
Emerging opportunities for the laser therapy market include:
- Expansion into new geographic markets: Untapped potential exists in developing economies.
- Development of innovative applications: Exploration of laser therapy for new therapeutic areas.
- Integration with telehealth platforms: Enabling remote monitoring and treatment.
- Personalized medicine applications: Tailored laser therapy protocols based on individual patient needs.
Leading Players in the Laser Therapy Industry Market
- THOR Photomedicine Ltd
- Pulse Laser Relief
- Vielight Inc
- TheraDome Inc
- Ingeneus
- BIOFLEX
- HairMax
- LumiWave
- Omega Laser Systems
- iGrow Laser
- Erchonia Corporation
- BioLight Technologies LLC
Key Developments in Laser Therapy Industry
- 2022 Q4: Vielight Inc launched a new portable laser therapy device.
- 2023 Q1: THOR Photomedicine Ltd announced a strategic partnership to expand its market reach.
- 2023 Q3: A major clinical trial demonstrating the effectiveness of laser therapy in pain management was completed. (Further key developments will be listed in the full report)
Future Outlook for Laser Therapy Industry Market
The laser therapy market is poised for significant growth over the next decade, driven by technological innovation, increasing adoption, and favorable regulatory trends. The market will continue to expand into new applications and geographic regions. Strategic partnerships and collaborations will play a crucial role in shaping the industry's future. The development of more affordable and accessible devices will further enhance market penetration and adoption rates. The industry is expected to witness continued consolidation, with larger companies acquiring smaller firms to expand their product portfolios and market reach.
Laser Therapy Industry Segmentation
-
1. Application
- 1.1. Wound Care
- 1.2. Pain Management
- 1.3. Cosmetic Application
- 1.4. Other Applications
-
2. Wavelength Type
- 2.1. Infrared Light
- 2.2. Red Light
- 2.3. Other Wavelength Types
-
3. End-User
- 3.1. Specialty Clinics
- 3.2. Research Institutes
- 3.3. Other End-Users
Laser Therapy Industry Segmentation By Geography
-
1. North America
- 1.1. United States
- 1.2. Canada
- 1.3. Mexico
-
2. Europe
- 2.1. Germany
- 2.2. United Kingdom
- 2.3. France
- 2.4. Italy
- 2.5. Spain
- 2.6. Rest of Europe
-
3. Asia Pacific
- 3.1. China
- 3.2. Japan
- 3.3. India
- 3.4. Australia
- 3.5. South Korea
- 3.6. Rest of Asia Pacific
-
4. Middle East and Africa
- 4.1. GCC
- 4.2. South Africa
- 4.3. Rest of Middle East and Africa
-
5. South America
- 5.1. Brazil
- 5.2. Argentina
- 5.3. Rest of South America
Laser Therapy Industry REPORT HIGHLIGHTS
| Aspects | Details |
|---|---|
| Study Period | 2019-2033 |
| Base Year | 2024 |
| Estimated Year | 2025 |
| Forecast Period | 2025-2033 |
| Historical Period | 2019-2024 |
| Growth Rate | CAGR of 10.31% from 2019-2033 |
| Segmentation |
|
Table of Contents
- 1. Introduction
- 1.1. Research Scope
- 1.2. Market Segmentation
- 1.3. Research Methodology
- 1.4. Definitions and Assumptions
- 2. Executive Summary
- 2.1. Introduction
- 3. Market Dynamics
- 3.1. Introduction
- 3.2. Market Drivers
- 3.2.1. Rising Incidence of Osteoporosis and Arthritis; Rising Demand for Non-Invasive Treatments
- 3.3. Market Restrains
- 3.3.1. Availability of Alternative Treatments
- 3.4. Market Trends
- 3.4.1. Pain Management is Expected to Hold the Major Market Share in the Market Over the Forecast Period
- 4. Market Factor Analysis
- 4.1. Porters Five Forces
- 4.2. Supply/Value Chain
- 4.3. PESTEL analysis
- 4.4. Market Entropy
- 4.5. Patent/Trademark Analysis
- 5. Global Laser Therapy Industry Analysis, Insights and Forecast, 2019-2031
- 5.1. Market Analysis, Insights and Forecast - by Application
- 5.1.1. Wound Care
- 5.1.2. Pain Management
- 5.1.3. Cosmetic Application
- 5.1.4. Other Applications
- 5.2. Market Analysis, Insights and Forecast - by Wavelength Type
- 5.2.1. Infrared Light
- 5.2.2. Red Light
- 5.2.3. Other Wavelength Types
- 5.3. Market Analysis, Insights and Forecast - by End-User
- 5.3.1. Specialty Clinics
- 5.3.2. Research Institutes
- 5.3.3. Other End-Users
- 5.4. Market Analysis, Insights and Forecast - by Region
- 5.4.1. North America
- 5.4.2. Europe
- 5.4.3. Asia Pacific
- 5.4.4. Middle East and Africa
- 5.4.5. South America
- 5.1. Market Analysis, Insights and Forecast - by Application
- 6. North America Laser Therapy Industry Analysis, Insights and Forecast, 2019-2031
- 6.1. Market Analysis, Insights and Forecast - by Application
- 6.1.1. Wound Care
- 6.1.2. Pain Management
- 6.1.3. Cosmetic Application
- 6.1.4. Other Applications
- 6.2. Market Analysis, Insights and Forecast - by Wavelength Type
- 6.2.1. Infrared Light
- 6.2.2. Red Light
- 6.2.3. Other Wavelength Types
- 6.3. Market Analysis, Insights and Forecast - by End-User
- 6.3.1. Specialty Clinics
- 6.3.2. Research Institutes
- 6.3.3. Other End-Users
- 6.1. Market Analysis, Insights and Forecast - by Application
- 7. Europe Laser Therapy Industry Analysis, Insights and Forecast, 2019-2031
- 7.1. Market Analysis, Insights and Forecast - by Application
- 7.1.1. Wound Care
- 7.1.2. Pain Management
- 7.1.3. Cosmetic Application
- 7.1.4. Other Applications
- 7.2. Market Analysis, Insights and Forecast - by Wavelength Type
- 7.2.1. Infrared Light
- 7.2.2. Red Light
- 7.2.3. Other Wavelength Types
- 7.3. Market Analysis, Insights and Forecast - by End-User
- 7.3.1. Specialty Clinics
- 7.3.2. Research Institutes
- 7.3.3. Other End-Users
- 7.1. Market Analysis, Insights and Forecast - by Application
- 8. Asia Pacific Laser Therapy Industry Analysis, Insights and Forecast, 2019-2031
- 8.1. Market Analysis, Insights and Forecast - by Application
- 8.1.1. Wound Care
- 8.1.2. Pain Management
- 8.1.3. Cosmetic Application
- 8.1.4. Other Applications
- 8.2. Market Analysis, Insights and Forecast - by Wavelength Type
- 8.2.1. Infrared Light
- 8.2.2. Red Light
- 8.2.3. Other Wavelength Types
- 8.3. Market Analysis, Insights and Forecast - by End-User
- 8.3.1. Specialty Clinics
- 8.3.2. Research Institutes
- 8.3.3. Other End-Users
- 8.1. Market Analysis, Insights and Forecast - by Application
- 9. Middle East and Africa Laser Therapy Industry Analysis, Insights and Forecast, 2019-2031
- 9.1. Market Analysis, Insights and Forecast - by Application
- 9.1.1. Wound Care
- 9.1.2. Pain Management
- 9.1.3. Cosmetic Application
- 9.1.4. Other Applications
- 9.2. Market Analysis, Insights and Forecast - by Wavelength Type
- 9.2.1. Infrared Light
- 9.2.2. Red Light
- 9.2.3. Other Wavelength Types
- 9.3. Market Analysis, Insights and Forecast - by End-User
- 9.3.1. Specialty Clinics
- 9.3.2. Research Institutes
- 9.3.3. Other End-Users
- 9.1. Market Analysis, Insights and Forecast - by Application
- 10. South America Laser Therapy Industry Analysis, Insights and Forecast, 2019-2031
- 10.1. Market Analysis, Insights and Forecast - by Application
- 10.1.1. Wound Care
- 10.1.2. Pain Management
- 10.1.3. Cosmetic Application
- 10.1.4. Other Applications
- 10.2. Market Analysis, Insights and Forecast - by Wavelength Type
- 10.2.1. Infrared Light
- 10.2.2. Red Light
- 10.2.3. Other Wavelength Types
- 10.3. Market Analysis, Insights and Forecast - by End-User
- 10.3.1. Specialty Clinics
- 10.3.2. Research Institutes
- 10.3.3. Other End-Users
- 10.1. Market Analysis, Insights and Forecast - by Application
- 11. North America Laser Therapy Industry Analysis, Insights and Forecast, 2019-2031
- 11.1. Market Analysis, Insights and Forecast - By Country/Sub-region
- 11.1.1 United States
- 11.1.2 Canada
- 11.1.3 Mexico
- 12. Europe Laser Therapy Industry Analysis, Insights and Forecast, 2019-2031
- 12.1. Market Analysis, Insights and Forecast - By Country/Sub-region
- 12.1.1 Germany
- 12.1.2 United Kingdom
- 12.1.3 France
- 12.1.4 Italy
- 12.1.5 Spain
- 12.1.6 Rest of Europe
- 13. Asia Pacific Laser Therapy Industry Analysis, Insights and Forecast, 2019-2031
- 13.1. Market Analysis, Insights and Forecast - By Country/Sub-region
- 13.1.1 China
- 13.1.2 Japan
- 13.1.3 India
- 13.1.4 Australia
- 13.1.5 South Korea
- 13.1.6 Rest of Asia Pacific
- 14. Middle East and Africa Laser Therapy Industry Analysis, Insights and Forecast, 2019-2031
- 14.1. Market Analysis, Insights and Forecast - By Country/Sub-region
- 14.1.1 GCC
- 14.1.2 South Africa
- 14.1.3 Rest of Middle East and Africa
- 15. South America Laser Therapy Industry Analysis, Insights and Forecast, 2019-2031
- 15.1. Market Analysis, Insights and Forecast - By Country/Sub-region
- 15.1.1 Brazil
- 15.1.2 Argentina
- 15.1.3 Rest of South America
- 16. Competitive Analysis
- 16.1. Global Market Share Analysis 2024
- 16.2. Company Profiles
- 16.2.1 THOR Photomedicine Ltd
- 16.2.1.1. Overview
- 16.2.1.2. Products
- 16.2.1.3. SWOT Analysis
- 16.2.1.4. Recent Developments
- 16.2.1.5. Financials (Based on Availability)
- 16.2.2 Pulse Laser Relief*List Not Exhaustive
- 16.2.2.1. Overview
- 16.2.2.2. Products
- 16.2.2.3. SWOT Analysis
- 16.2.2.4. Recent Developments
- 16.2.2.5. Financials (Based on Availability)
- 16.2.3 Vielight Inc
- 16.2.3.1. Overview
- 16.2.3.2. Products
- 16.2.3.3. SWOT Analysis
- 16.2.3.4. Recent Developments
- 16.2.3.5. Financials (Based on Availability)
- 16.2.4 TheraDome Inc
- 16.2.4.1. Overview
- 16.2.4.2. Products
- 16.2.4.3. SWOT Analysis
- 16.2.4.4. Recent Developments
- 16.2.4.5. Financials (Based on Availability)
- 16.2.5 Ingeneus
- 16.2.5.1. Overview
- 16.2.5.2. Products
- 16.2.5.3. SWOT Analysis
- 16.2.5.4. Recent Developments
- 16.2.5.5. Financials (Based on Availability)
- 16.2.6 BIOFLEX
- 16.2.6.1. Overview
- 16.2.6.2. Products
- 16.2.6.3. SWOT Analysis
- 16.2.6.4. Recent Developments
- 16.2.6.5. Financials (Based on Availability)
- 16.2.7 HairMax
- 16.2.7.1. Overview
- 16.2.7.2. Products
- 16.2.7.3. SWOT Analysis
- 16.2.7.4. Recent Developments
- 16.2.7.5. Financials (Based on Availability)
- 16.2.8 LumiWave
- 16.2.8.1. Overview
- 16.2.8.2. Products
- 16.2.8.3. SWOT Analysis
- 16.2.8.4. Recent Developments
- 16.2.8.5. Financials (Based on Availability)
- 16.2.9 Omega Laser Systems
- 16.2.9.1. Overview
- 16.2.9.2. Products
- 16.2.9.3. SWOT Analysis
- 16.2.9.4. Recent Developments
- 16.2.9.5. Financials (Based on Availability)
- 16.2.10 iGrow Laser
- 16.2.10.1. Overview
- 16.2.10.2. Products
- 16.2.10.3. SWOT Analysis
- 16.2.10.4. Recent Developments
- 16.2.10.5. Financials (Based on Availability)
- 16.2.11 Erchonia Corporation
- 16.2.11.1. Overview
- 16.2.11.2. Products
- 16.2.11.3. SWOT Analysis
- 16.2.11.4. Recent Developments
- 16.2.11.5. Financials (Based on Availability)
- 16.2.12 BioLight Technologies LLC
- 16.2.12.1. Overview
- 16.2.12.2. Products
- 16.2.12.3. SWOT Analysis
- 16.2.12.4. Recent Developments
- 16.2.12.5. Financials (Based on Availability)
- 16.2.1 THOR Photomedicine Ltd
List of Figures
- Figure 1: Global Laser Therapy Industry Revenue Breakdown (Million, %) by Region 2024 & 2032
- Figure 2: North America Laser Therapy Industry Revenue (Million), by Country 2024 & 2032
- Figure 3: North America Laser Therapy Industry Revenue Share (%), by Country 2024 & 2032
- Figure 4: Europe Laser Therapy Industry Revenue (Million), by Country 2024 & 2032
- Figure 5: Europe Laser Therapy Industry Revenue Share (%), by Country 2024 & 2032
- Figure 6: Asia Pacific Laser Therapy Industry Revenue (Million), by Country 2024 & 2032
- Figure 7: Asia Pacific Laser Therapy Industry Revenue Share (%), by Country 2024 & 2032
- Figure 8: Middle East and Africa Laser Therapy Industry Revenue (Million), by Country 2024 & 2032
- Figure 9: Middle East and Africa Laser Therapy Industry Revenue Share (%), by Country 2024 & 2032
- Figure 10: South America Laser Therapy Industry Revenue (Million), by Country 2024 & 2032
- Figure 11: South America Laser Therapy Industry Revenue Share (%), by Country 2024 & 2032
- Figure 12: North America Laser Therapy Industry Revenue (Million), by Application 2024 & 2032
- Figure 13: North America Laser Therapy Industry Revenue Share (%), by Application 2024 & 2032
- Figure 14: North America Laser Therapy Industry Revenue (Million), by Wavelength Type 2024 & 2032
- Figure 15: North America Laser Therapy Industry Revenue Share (%), by Wavelength Type 2024 & 2032
- Figure 16: North America Laser Therapy Industry Revenue (Million), by End-User 2024 & 2032
- Figure 17: North America Laser Therapy Industry Revenue Share (%), by End-User 2024 & 2032
- Figure 18: North America Laser Therapy Industry Revenue (Million), by Country 2024 & 2032
- Figure 19: North America Laser Therapy Industry Revenue Share (%), by Country 2024 & 2032
- Figure 20: Europe Laser Therapy Industry Revenue (Million), by Application 2024 & 2032
- Figure 21: Europe Laser Therapy Industry Revenue Share (%), by Application 2024 & 2032
- Figure 22: Europe Laser Therapy Industry Revenue (Million), by Wavelength Type 2024 & 2032
- Figure 23: Europe Laser Therapy Industry Revenue Share (%), by Wavelength Type 2024 & 2032
- Figure 24: Europe Laser Therapy Industry Revenue (Million), by End-User 2024 & 2032
- Figure 25: Europe Laser Therapy Industry Revenue Share (%), by End-User 2024 & 2032
- Figure 26: Europe Laser Therapy Industry Revenue (Million), by Country 2024 & 2032
- Figure 27: Europe Laser Therapy Industry Revenue Share (%), by Country 2024 & 2032
- Figure 28: Asia Pacific Laser Therapy Industry Revenue (Million), by Application 2024 & 2032
- Figure 29: Asia Pacific Laser Therapy Industry Revenue Share (%), by Application 2024 & 2032
- Figure 30: Asia Pacific Laser Therapy Industry Revenue (Million), by Wavelength Type 2024 & 2032
- Figure 31: Asia Pacific Laser Therapy Industry Revenue Share (%), by Wavelength Type 2024 & 2032
- Figure 32: Asia Pacific Laser Therapy Industry Revenue (Million), by End-User 2024 & 2032
- Figure 33: Asia Pacific Laser Therapy Industry Revenue Share (%), by End-User 2024 & 2032
- Figure 34: Asia Pacific Laser Therapy Industry Revenue (Million), by Country 2024 & 2032
- Figure 35: Asia Pacific Laser Therapy Industry Revenue Share (%), by Country 2024 & 2032
- Figure 36: Middle East and Africa Laser Therapy Industry Revenue (Million), by Application 2024 & 2032
- Figure 37: Middle East and Africa Laser Therapy Industry Revenue Share (%), by Application 2024 & 2032
- Figure 38: Middle East and Africa Laser Therapy Industry Revenue (Million), by Wavelength Type 2024 & 2032
- Figure 39: Middle East and Africa Laser Therapy Industry Revenue Share (%), by Wavelength Type 2024 & 2032
- Figure 40: Middle East and Africa Laser Therapy Industry Revenue (Million), by End-User 2024 & 2032
- Figure 41: Middle East and Africa Laser Therapy Industry Revenue Share (%), by End-User 2024 & 2032
- Figure 42: Middle East and Africa Laser Therapy Industry Revenue (Million), by Country 2024 & 2032
- Figure 43: Middle East and Africa Laser Therapy Industry Revenue Share (%), by Country 2024 & 2032
- Figure 44: South America Laser Therapy Industry Revenue (Million), by Application 2024 & 2032
- Figure 45: South America Laser Therapy Industry Revenue Share (%), by Application 2024 & 2032
- Figure 46: South America Laser Therapy Industry Revenue (Million), by Wavelength Type 2024 & 2032
- Figure 47: South America Laser Therapy Industry Revenue Share (%), by Wavelength Type 2024 & 2032
- Figure 48: South America Laser Therapy Industry Revenue (Million), by End-User 2024 & 2032
- Figure 49: South America Laser Therapy Industry Revenue Share (%), by End-User 2024 & 2032
- Figure 50: South America Laser Therapy Industry Revenue (Million), by Country 2024 & 2032
- Figure 51: South America Laser Therapy Industry Revenue Share (%), by Country 2024 & 2032
List of Tables
- Table 1: Global Laser Therapy Industry Revenue Million Forecast, by Region 2019 & 2032
- Table 2: Global Laser Therapy Industry Revenue Million Forecast, by Application 2019 & 2032
- Table 3: Global Laser Therapy Industry Revenue Million Forecast, by Wavelength Type 2019 & 2032
- Table 4: Global Laser Therapy Industry Revenue Million Forecast, by End-User 2019 & 2032
- Table 5: Global Laser Therapy Industry Revenue Million Forecast, by Region 2019 & 2032
- Table 6: Global Laser Therapy Industry Revenue Million Forecast, by Country 2019 & 2032
- Table 7: United States Laser Therapy Industry Revenue (Million) Forecast, by Application 2019 & 2032
- Table 8: Canada Laser Therapy Industry Revenue (Million) Forecast, by Application 2019 & 2032
- Table 9: Mexico Laser Therapy Industry Revenue (Million) Forecast, by Application 2019 & 2032
- Table 10: Global Laser Therapy Industry Revenue Million Forecast, by Country 2019 & 2032
- Table 11: Germany Laser Therapy Industry Revenue (Million) Forecast, by Application 2019 & 2032
- Table 12: United Kingdom Laser Therapy Industry Revenue (Million) Forecast, by Application 2019 & 2032
- Table 13: France Laser Therapy Industry Revenue (Million) Forecast, by Application 2019 & 2032
- Table 14: Italy Laser Therapy Industry Revenue (Million) Forecast, by Application 2019 & 2032
- Table 15: Spain Laser Therapy Industry Revenue (Million) Forecast, by Application 2019 & 2032
- Table 16: Rest of Europe Laser Therapy Industry Revenue (Million) Forecast, by Application 2019 & 2032
- Table 17: Global Laser Therapy Industry Revenue Million Forecast, by Country 2019 & 2032
- Table 18: China Laser Therapy Industry Revenue (Million) Forecast, by Application 2019 & 2032
- Table 19: Japan Laser Therapy Industry Revenue (Million) Forecast, by Application 2019 & 2032
- Table 20: India Laser Therapy Industry Revenue (Million) Forecast, by Application 2019 & 2032
- Table 21: Australia Laser Therapy Industry Revenue (Million) Forecast, by Application 2019 & 2032
- Table 22: South Korea Laser Therapy Industry Revenue (Million) Forecast, by Application 2019 & 2032
- Table 23: Rest of Asia Pacific Laser Therapy Industry Revenue (Million) Forecast, by Application 2019 & 2032
- Table 24: Global Laser Therapy Industry Revenue Million Forecast, by Country 2019 & 2032
- Table 25: GCC Laser Therapy Industry Revenue (Million) Forecast, by Application 2019 & 2032
- Table 26: South Africa Laser Therapy Industry Revenue (Million) Forecast, by Application 2019 & 2032
- Table 27: Rest of Middle East and Africa Laser Therapy Industry Revenue (Million) Forecast, by Application 2019 & 2032
- Table 28: Global Laser Therapy Industry Revenue Million Forecast, by Country 2019 & 2032
- Table 29: Brazil Laser Therapy Industry Revenue (Million) Forecast, by Application 2019 & 2032
- Table 30: Argentina Laser Therapy Industry Revenue (Million) Forecast, by Application 2019 & 2032
- Table 31: Rest of South America Laser Therapy Industry Revenue (Million) Forecast, by Application 2019 & 2032
- Table 32: Global Laser Therapy Industry Revenue Million Forecast, by Application 2019 & 2032
- Table 33: Global Laser Therapy Industry Revenue Million Forecast, by Wavelength Type 2019 & 2032
- Table 34: Global Laser Therapy Industry Revenue Million Forecast, by End-User 2019 & 2032
- Table 35: Global Laser Therapy Industry Revenue Million Forecast, by Country 2019 & 2032
- Table 36: United States Laser Therapy Industry Revenue (Million) Forecast, by Application 2019 & 2032
- Table 37: Canada Laser Therapy Industry Revenue (Million) Forecast, by Application 2019 & 2032
- Table 38: Mexico Laser Therapy Industry Revenue (Million) Forecast, by Application 2019 & 2032
- Table 39: Global Laser Therapy Industry Revenue Million Forecast, by Application 2019 & 2032
- Table 40: Global Laser Therapy Industry Revenue Million Forecast, by Wavelength Type 2019 & 2032
- Table 41: Global Laser Therapy Industry Revenue Million Forecast, by End-User 2019 & 2032
- Table 42: Global Laser Therapy Industry Revenue Million Forecast, by Country 2019 & 2032
- Table 43: Germany Laser Therapy Industry Revenue (Million) Forecast, by Application 2019 & 2032
- Table 44: United Kingdom Laser Therapy Industry Revenue (Million) Forecast, by Application 2019 & 2032
- Table 45: France Laser Therapy Industry Revenue (Million) Forecast, by Application 2019 & 2032
- Table 46: Italy Laser Therapy Industry Revenue (Million) Forecast, by Application 2019 & 2032
- Table 47: Spain Laser Therapy Industry Revenue (Million) Forecast, by Application 2019 & 2032
- Table 48: Rest of Europe Laser Therapy Industry Revenue (Million) Forecast, by Application 2019 & 2032
- Table 49: Global Laser Therapy Industry Revenue Million Forecast, by Application 2019 & 2032
- Table 50: Global Laser Therapy Industry Revenue Million Forecast, by Wavelength Type 2019 & 2032
- Table 51: Global Laser Therapy Industry Revenue Million Forecast, by End-User 2019 & 2032
- Table 52: Global Laser Therapy Industry Revenue Million Forecast, by Country 2019 & 2032
- Table 53: China Laser Therapy Industry Revenue (Million) Forecast, by Application 2019 & 2032
- Table 54: Japan Laser Therapy Industry Revenue (Million) Forecast, by Application 2019 & 2032
- Table 55: India Laser Therapy Industry Revenue (Million) Forecast, by Application 2019 & 2032
- Table 56: Australia Laser Therapy Industry Revenue (Million) Forecast, by Application 2019 & 2032
- Table 57: South Korea Laser Therapy Industry Revenue (Million) Forecast, by Application 2019 & 2032
- Table 58: Rest of Asia Pacific Laser Therapy Industry Revenue (Million) Forecast, by Application 2019 & 2032
- Table 59: Global Laser Therapy Industry Revenue Million Forecast, by Application 2019 & 2032
- Table 60: Global Laser Therapy Industry Revenue Million Forecast, by Wavelength Type 2019 & 2032
- Table 61: Global Laser Therapy Industry Revenue Million Forecast, by End-User 2019 & 2032
- Table 62: Global Laser Therapy Industry Revenue Million Forecast, by Country 2019 & 2032
- Table 63: GCC Laser Therapy Industry Revenue (Million) Forecast, by Application 2019 & 2032
- Table 64: South Africa Laser Therapy Industry Revenue (Million) Forecast, by Application 2019 & 2032
- Table 65: Rest of Middle East and Africa Laser Therapy Industry Revenue (Million) Forecast, by Application 2019 & 2032
- Table 66: Global Laser Therapy Industry Revenue Million Forecast, by Application 2019 & 2032
- Table 67: Global Laser Therapy Industry Revenue Million Forecast, by Wavelength Type 2019 & 2032
- Table 68: Global Laser Therapy Industry Revenue Million Forecast, by End-User 2019 & 2032
- Table 69: Global Laser Therapy Industry Revenue Million Forecast, by Country 2019 & 2032
- Table 70: Brazil Laser Therapy Industry Revenue (Million) Forecast, by Application 2019 & 2032
- Table 71: Argentina Laser Therapy Industry Revenue (Million) Forecast, by Application 2019 & 2032
- Table 72: Rest of South America Laser Therapy Industry Revenue (Million) Forecast, by Application 2019 & 2032
Frequently Asked Questions
1. What is the projected Compound Annual Growth Rate (CAGR) of the Laser Therapy Industry?
The projected CAGR is approximately 10.31%.
2. Which companies are prominent players in the Laser Therapy Industry?
Key companies in the market include THOR Photomedicine Ltd, Pulse Laser Relief*List Not Exhaustive, Vielight Inc, TheraDome Inc, Ingeneus, BIOFLEX, HairMax, LumiWave, Omega Laser Systems, iGrow Laser, Erchonia Corporation, BioLight Technologies LLC.
3. What are the main segments of the Laser Therapy Industry?
The market segments include Application, Wavelength Type, End-User.
4. Can you provide details about the market size?
The market size is estimated to be USD 240.80 Million as of 2022.
5. What are some drivers contributing to market growth?
Rising Incidence of Osteoporosis and Arthritis; Rising Demand for Non-Invasive Treatments.
6. What are the notable trends driving market growth?
Pain Management is Expected to Hold the Major Market Share in the Market Over the Forecast Period.
7. Are there any restraints impacting market growth?
Availability of Alternative Treatments.
8. Can you provide examples of recent developments in the market?
N/A
9. What pricing options are available for accessing the report?
Pricing options include single-user, multi-user, and enterprise licenses priced at USD 4750, USD 5250, and USD 8750 respectively.
10. Is the market size provided in terms of value or volume?
The market size is provided in terms of value, measured in Million.
11. Are there any specific market keywords associated with the report?
Yes, the market keyword associated with the report is "Laser Therapy Industry," which aids in identifying and referencing the specific market segment covered.
12. How do I determine which pricing option suits my needs best?
The pricing options vary based on user requirements and access needs. Individual users may opt for single-user licenses, while businesses requiring broader access may choose multi-user or enterprise licenses for cost-effective access to the report.
13. Are there any additional resources or data provided in the Laser Therapy Industry report?
While the report offers comprehensive insights, it's advisable to review the specific contents or supplementary materials provided to ascertain if additional resources or data are available.
14. How can I stay updated on further developments or reports in the Laser Therapy Industry?
To stay informed about further developments, trends, and reports in the Laser Therapy Industry, consider subscribing to industry newsletters, following relevant companies and organizations, or regularly checking reputable industry news sources and publications.
Methodology
Step 1 - Identification of Relevant Samples Size from Population Database


Step 2 - Approaches for Defining Global Market Size (Value, Volume* & Price*)

Note*: In applicable scenarios
Step 3 - Data Sources
Primary Research
- Web Analytics
- Survey Reports
- Research Institute
- Latest Research Reports
- Opinion Leaders
Secondary Research
- Annual Reports
- White Paper
- Latest Press Release
- Industry Association
- Paid Database
- Investor Presentations

Step 4 - Data Triangulation
Involves using different sources of information in order to increase the validity of a study
These sources are likely to be stakeholders in a program - participants, other researchers, program staff, other community members, and so on.
Then we put all data in single framework & apply various statistical tools to find out the dynamic on the market.
During the analysis stage, feedback from the stakeholder groups would be compared to determine areas of agreement as well as areas of divergence


