
Key Insights
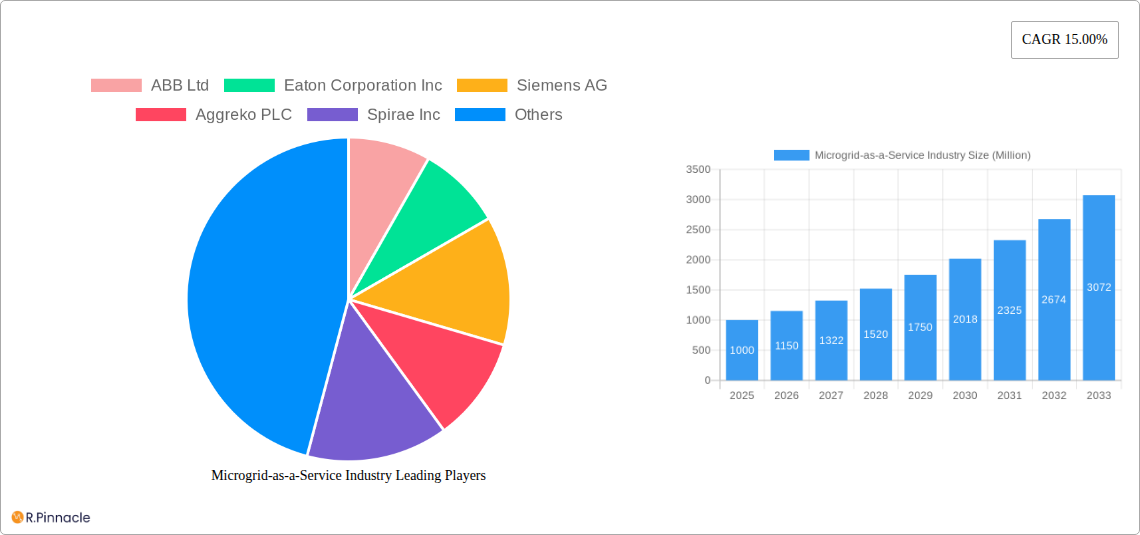
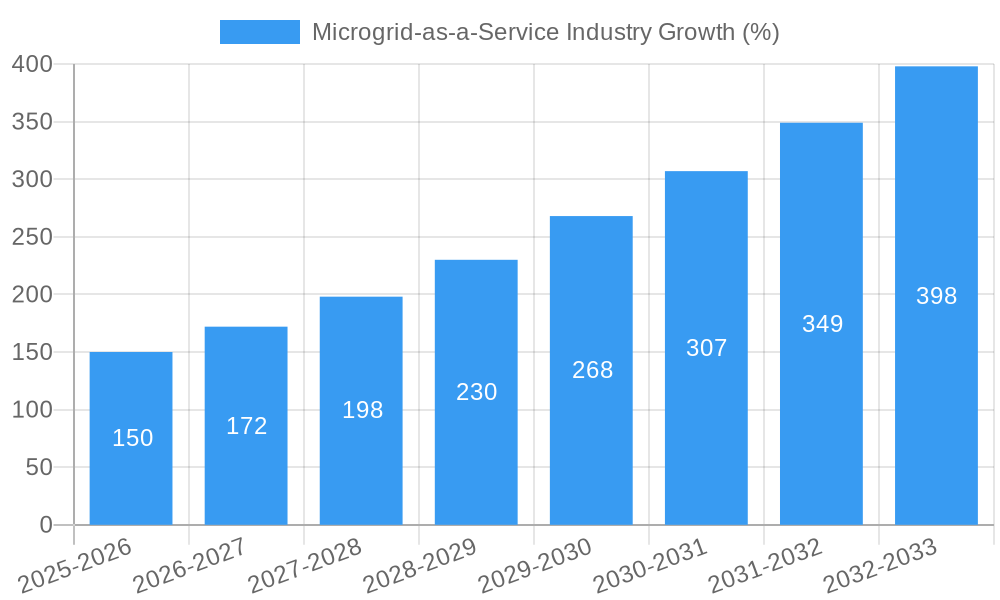
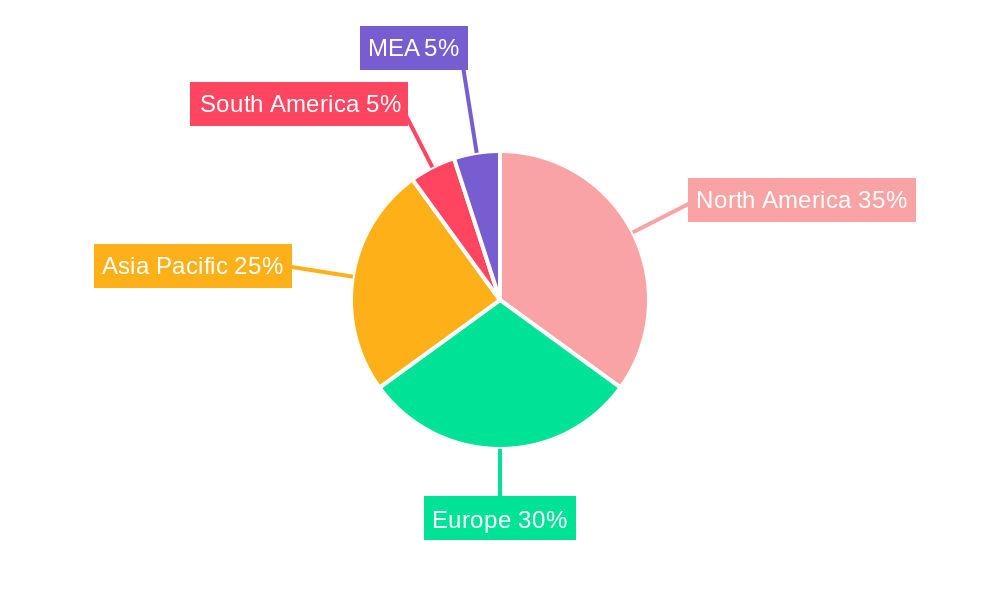
The Microgrid-as-a-Service (MaaS) market is experiencing robust growth, driven by increasing demand for reliable and resilient energy solutions, particularly in remote areas and regions with unstable grids. The market's 15% CAGR indicates significant expansion, projected to reach substantial value by 2033. Key drivers include the rising adoption of renewable energy sources, coupled with the need for efficient energy management and reduced carbon footprint. Government initiatives promoting energy independence and sustainability further fuel market expansion. The market is segmented by service type (Engineering and Design, SaaS, Monitoring & Control, Operation & Maintenance) and end-user vertical (Government, Residential & Commercial, Industrial). The diverse service offerings cater to a broad spectrum of needs, from initial design and implementation to ongoing maintenance and optimization. North America and Europe currently dominate the market, leveraging their advanced infrastructure and strong regulatory support, but the Asia-Pacific region is poised for significant growth due to its rapidly developing economies and increasing energy demands. Challenges include high initial investment costs and the need for skilled workforce development to effectively manage and maintain these complex systems.
The competitive landscape is characterized by a mix of established energy players like ABB, Siemens, and Eaton, alongside specialized MaaS providers like Spirae and Pareto Energy. These companies are constantly innovating to offer enhanced services, integrating advanced technologies such as artificial intelligence and machine learning for optimized performance and predictive maintenance. Future growth will be influenced by technological advancements, evolving regulatory frameworks, and the increasing adoption of smart grid technologies. The integration of storage solutions, particularly battery storage, will play a crucial role in enhancing the resilience and reliability of MaaS offerings. The market's expansion will likely be fueled by a greater emphasis on microgrid deployments in both urban and rural settings, addressing the needs of diverse customer segments and promoting a more decentralized and sustainable energy future.
Microgrid-as-a-Service (MaaS) Industry Market Report: 2019-2033
This comprehensive report provides an in-depth analysis of the Microgrid-as-a-Service (MaaS) industry, offering actionable insights for industry professionals, investors, and strategic planners. The report covers the period 2019-2033, with a focus on the estimated year 2025 and a forecast period of 2025-2033. The market is valued at $XX Million in 2025 and is projected to reach $XX Million by 2033, exhibiting a CAGR of XX%.
Microgrid-as-a-Service Industry Market Structure & Innovation Trends
This section analyzes the competitive landscape, innovation drivers, and regulatory influences shaping the MaaS market. The industry exhibits moderate concentration, with key players such as ABB Ltd, Eaton Corporation Inc, Siemens AG, and General Electric Company holding significant market share (combined XX%). However, smaller, specialized providers like Spirae Inc and Pareto Energy are also gaining traction through niche offerings.
- Market Concentration: The Herfindahl-Hirschman Index (HHI) is estimated at XX, indicating a moderately concentrated market.
- Innovation Drivers: The increasing adoption of renewable energy sources, coupled with advancements in energy storage technologies and smart grid infrastructure, are key drivers of innovation.
- Regulatory Frameworks: Government incentives and policies promoting distributed generation and energy efficiency are significantly influencing market growth.
- M&A Activity: The past five years have witnessed several mergers and acquisitions, with deal values totaling approximately $XX Million. These activities reflect the consolidation trend within the industry and the strategic importance of MaaS.
- Product Substitutes: Traditional centralized power generation remains a primary substitute; however, MaaS's advantages in reliability, resilience, and cost-effectiveness are increasingly attracting customers.
- End-User Demographics: The industrial sector currently dominates the market, followed by the government and commercial sectors. Residential adoption is expected to increase gradually.
Microgrid-as-a-Service Industry Market Dynamics & Trends
The MaaS market is characterized by robust growth driven by several factors. The increasing demand for reliable and resilient power supplies, particularly in remote or underserved areas, fuels market expansion. Technological advancements in areas such as energy storage, smart grid technologies, and advanced analytics are further enhancing the attractiveness of MaaS solutions. The rising adoption of renewable energy sources such as solar and wind power is creating significant opportunities for MaaS providers.
Furthermore, evolving consumer preferences toward sustainable and environmentally friendly energy solutions are driving market demand. Competitive dynamics are shaped by both established players and emerging technology firms. The market experiences intense competition based on service quality, pricing strategies, and technological advancements. The market penetration of MaaS is currently at approximately XX% and is projected to reach XX% by 2033.
Dominant Regions & Segments in Microgrid-as-a-Service Industry
North America currently holds the largest market share in the MaaS industry, driven by robust government support, substantial investments in renewable energy infrastructure, and a high concentration of industrial and commercial end-users. Within service types, Operation and Maintenance Services currently dominates, reflecting the ongoing need for reliable and efficient management of microgrids. In terms of end-user verticals, the industrial sector accounts for the largest market share, emphasizing the critical role of reliable power in industrial operations.
- Key Drivers for North America:
- Strong government policies promoting renewable energy and grid modernization.
- Significant investments in smart grid infrastructure.
- High concentration of industrial and commercial end-users.
- Key Drivers for Industrial Sector:
- Need for reliable and resilient power supply to ensure operational continuity.
- Cost savings through optimized energy management.
- Opportunities for enhanced energy efficiency and sustainability.
Microgrid-as-a-Service Industry Product Innovations
Recent product innovations focus on integrating advanced technologies such as AI and machine learning for predictive maintenance, optimizing energy management, and improving grid stability. The integration of IoT devices enhances data collection and analysis, enabling more efficient operation and maintenance. These advancements contribute to the overall cost-effectiveness and reliability of MaaS solutions, attracting more customers across diverse industry sectors.
Report Scope & Segmentation Analysis
This report segments the MaaS market by service type (Engineering and Design Services, Software as a Service, Monitoring and Control Services, Operation and Maintenance Services) and end-user vertical (Government, Residential and Commercial, Industrial). Each segment is analyzed in detail, providing insights into market size, growth projections, and competitive dynamics. For example, the Software as a Service segment is witnessing rapid growth due to the increasing adoption of cloud-based solutions for microgrid management.
Key Drivers of Microgrid-as-a-Service Industry Growth
The MaaS market is driven by several factors, including the increasing demand for reliable power, the growing adoption of renewable energy, and supportive government regulations. Technological advancements in energy storage and smart grid technologies are also major contributors to market growth. Furthermore, cost savings achieved through optimized energy management are attracting a wider range of customers.
Challenges in the Microgrid-as-a-Service Industry Sector
The MaaS industry faces challenges such as high upfront investment costs, complex regulatory frameworks, and the need for skilled workforce. Supply chain disruptions and the integration of various technologies also pose challenges. Addressing these issues will be crucial for sustained market growth.
Emerging Opportunities in Microgrid-as-a-Service Industry
Emerging opportunities lie in expanding into new geographical regions, particularly in developing countries with limited access to reliable electricity. The integration of advanced technologies like blockchain for secure energy transactions and the development of microgrids tailored for specific industries offer significant potential.
Leading Players in the Microgrid-as-a-Service Industry Market
- ABB Ltd
- Eaton Corporation Inc
- Siemens AG
- Aggreko PLC
- Spirae Inc
- Schneider Electric SE
- Pareto Energy
- Metco Engineering
- Green Energy Corp
- General Electric Company
Key Developments in Microgrid-as-a-Service Industry Industry
- 2022-Q4: ABB Ltd launched a new advanced energy storage system for microgrids.
- 2023-Q1: Siemens AG and Eaton Corporation Inc announced a joint venture to develop next-generation microgrid solutions.
- 2023-Q3: Several large-scale microgrid projects were commissioned in North America and Europe. (Further specific details would be included in the full report).
Future Outlook for Microgrid-as-a-Service Industry Market
The future of the MaaS market looks promising, driven by continued technological advancements, supportive government policies, and increasing awareness of the benefits of distributed generation. The market is poised for significant growth, offering substantial opportunities for existing and new players. Strategic partnerships and investments in research and development will be key to success in this dynamic market.
Microgrid-as-a-Service Industry Segmentation
-
1. Service Type
- 1.1. Engineering and Design Service
- 1.2. Software as a Service
- 1.3. Monitoring and Control Services
- 1.4. Operation and Maintenance Services
-
2. End-user Vertical
- 2.1. Government
- 2.2. Residential and Commercial
- 2.3. Industrial
Microgrid-as-a-Service Industry Segmentation By Geography
- 1. North America
- 2. Europe
- 3. Asia Pacific
- 4. Rest of the World
Microgrid-as-a-Service Industry REPORT HIGHLIGHTS
| Aspects | Details |
|---|---|
| Study Period | 2019-2033 |
| Base Year | 2024 |
| Estimated Year | 2025 |
| Forecast Period | 2025-2033 |
| Historical Period | 2019-2024 |
| Growth Rate | CAGR of 15.00% from 2019-2033 |
| Segmentation |
|
Table of Contents
- 1. Introduction
- 1.1. Research Scope
- 1.2. Market Segmentation
- 1.3. Research Methodology
- 1.4. Definitions and Assumptions
- 2. Executive Summary
- 2.1. Introduction
- 3. Market Dynamics
- 3.1. Introduction
- 3.2. Market Drivers
- 3.2.1. Increasing Demand From Hospitals and Remote Areas; High Investments from Governments
- 3.3. Market Restrains
- 3.3.1. Complexities in Managing Large-sized Microgrids
- 3.4. Market Trends
- 3.4.1. Residential and Commercial Segment to Witness Significant Growth
- 4. Market Factor Analysis
- 4.1. Porters Five Forces
- 4.2. Supply/Value Chain
- 4.3. PESTEL analysis
- 4.4. Market Entropy
- 4.5. Patent/Trademark Analysis
- 5. Global Microgrid-as-a-Service Industry Analysis, Insights and Forecast, 2019-2031
- 5.1. Market Analysis, Insights and Forecast - by Service Type
- 5.1.1. Engineering and Design Service
- 5.1.2. Software as a Service
- 5.1.3. Monitoring and Control Services
- 5.1.4. Operation and Maintenance Services
- 5.2. Market Analysis, Insights and Forecast - by End-user Vertical
- 5.2.1. Government
- 5.2.2. Residential and Commercial
- 5.2.3. Industrial
- 5.3. Market Analysis, Insights and Forecast - by Region
- 5.3.1. North America
- 5.3.2. Europe
- 5.3.3. Asia Pacific
- 5.3.4. Rest of the World
- 5.1. Market Analysis, Insights and Forecast - by Service Type
- 6. North America Microgrid-as-a-Service Industry Analysis, Insights and Forecast, 2019-2031
- 6.1. Market Analysis, Insights and Forecast - by Service Type
- 6.1.1. Engineering and Design Service
- 6.1.2. Software as a Service
- 6.1.3. Monitoring and Control Services
- 6.1.4. Operation and Maintenance Services
- 6.2. Market Analysis, Insights and Forecast - by End-user Vertical
- 6.2.1. Government
- 6.2.2. Residential and Commercial
- 6.2.3. Industrial
- 6.1. Market Analysis, Insights and Forecast - by Service Type
- 7. Europe Microgrid-as-a-Service Industry Analysis, Insights and Forecast, 2019-2031
- 7.1. Market Analysis, Insights and Forecast - by Service Type
- 7.1.1. Engineering and Design Service
- 7.1.2. Software as a Service
- 7.1.3. Monitoring and Control Services
- 7.1.4. Operation and Maintenance Services
- 7.2. Market Analysis, Insights and Forecast - by End-user Vertical
- 7.2.1. Government
- 7.2.2. Residential and Commercial
- 7.2.3. Industrial
- 7.1. Market Analysis, Insights and Forecast - by Service Type
- 8. Asia Pacific Microgrid-as-a-Service Industry Analysis, Insights and Forecast, 2019-2031
- 8.1. Market Analysis, Insights and Forecast - by Service Type
- 8.1.1. Engineering and Design Service
- 8.1.2. Software as a Service
- 8.1.3. Monitoring and Control Services
- 8.1.4. Operation and Maintenance Services
- 8.2. Market Analysis, Insights and Forecast - by End-user Vertical
- 8.2.1. Government
- 8.2.2. Residential and Commercial
- 8.2.3. Industrial
- 8.1. Market Analysis, Insights and Forecast - by Service Type
- 9. Rest of the World Microgrid-as-a-Service Industry Analysis, Insights and Forecast, 2019-2031
- 9.1. Market Analysis, Insights and Forecast - by Service Type
- 9.1.1. Engineering and Design Service
- 9.1.2. Software as a Service
- 9.1.3. Monitoring and Control Services
- 9.1.4. Operation and Maintenance Services
- 9.2. Market Analysis, Insights and Forecast - by End-user Vertical
- 9.2.1. Government
- 9.2.2. Residential and Commercial
- 9.2.3. Industrial
- 9.1. Market Analysis, Insights and Forecast - by Service Type
- 10. North America Microgrid-as-a-Service Industry Analysis, Insights and Forecast, 2019-2031
- 10.1. Market Analysis, Insights and Forecast - By Country/Sub-region
- 10.1.1 United States
- 10.1.2 Canada
- 10.1.3 Mexico
- 11. Europe Microgrid-as-a-Service Industry Analysis, Insights and Forecast, 2019-2031
- 11.1. Market Analysis, Insights and Forecast - By Country/Sub-region
- 11.1.1 Germany
- 11.1.2 United Kingdom
- 11.1.3 France
- 11.1.4 Spain
- 11.1.5 Italy
- 11.1.6 Spain
- 11.1.7 Belgium
- 11.1.8 Netherland
- 11.1.9 Nordics
- 11.1.10 Rest of Europe
- 12. Asia Pacific Microgrid-as-a-Service Industry Analysis, Insights and Forecast, 2019-2031
- 12.1. Market Analysis, Insights and Forecast - By Country/Sub-region
- 12.1.1 China
- 12.1.2 Japan
- 12.1.3 India
- 12.1.4 South Korea
- 12.1.5 Southeast Asia
- 12.1.6 Australia
- 12.1.7 Indonesia
- 12.1.8 Phillipes
- 12.1.9 Singapore
- 12.1.10 Thailandc
- 12.1.11 Rest of Asia Pacific
- 13. South America Microgrid-as-a-Service Industry Analysis, Insights and Forecast, 2019-2031
- 13.1. Market Analysis, Insights and Forecast - By Country/Sub-region
- 13.1.1 Brazil
- 13.1.2 Argentina
- 13.1.3 Peru
- 13.1.4 Chile
- 13.1.5 Colombia
- 13.1.6 Ecuador
- 13.1.7 Venezuela
- 13.1.8 Rest of South America
- 14. MEA Microgrid-as-a-Service Industry Analysis, Insights and Forecast, 2019-2031
- 14.1. Market Analysis, Insights and Forecast - By Country/Sub-region
- 14.1.1 United Arab Emirates
- 14.1.2 Saudi Arabia
- 14.1.3 South Africa
- 14.1.4 Rest of Middle East and Africa
- 15. Competitive Analysis
- 15.1. Global Market Share Analysis 2024
- 15.2. Company Profiles
- 15.2.1 ABB Ltd
- 15.2.1.1. Overview
- 15.2.1.2. Products
- 15.2.1.3. SWOT Analysis
- 15.2.1.4. Recent Developments
- 15.2.1.5. Financials (Based on Availability)
- 15.2.2 Eaton Corporation Inc
- 15.2.2.1. Overview
- 15.2.2.2. Products
- 15.2.2.3. SWOT Analysis
- 15.2.2.4. Recent Developments
- 15.2.2.5. Financials (Based on Availability)
- 15.2.3 Siemens AG
- 15.2.3.1. Overview
- 15.2.3.2. Products
- 15.2.3.3. SWOT Analysis
- 15.2.3.4. Recent Developments
- 15.2.3.5. Financials (Based on Availability)
- 15.2.4 Aggreko PLC
- 15.2.4.1. Overview
- 15.2.4.2. Products
- 15.2.4.3. SWOT Analysis
- 15.2.4.4. Recent Developments
- 15.2.4.5. Financials (Based on Availability)
- 15.2.5 Spirae Inc
- 15.2.5.1. Overview
- 15.2.5.2. Products
- 15.2.5.3. SWOT Analysis
- 15.2.5.4. Recent Developments
- 15.2.5.5. Financials (Based on Availability)
- 15.2.6 Schneider Electric SE
- 15.2.6.1. Overview
- 15.2.6.2. Products
- 15.2.6.3. SWOT Analysis
- 15.2.6.4. Recent Developments
- 15.2.6.5. Financials (Based on Availability)
- 15.2.7 Pareto Energy
- 15.2.7.1. Overview
- 15.2.7.2. Products
- 15.2.7.3. SWOT Analysis
- 15.2.7.4. Recent Developments
- 15.2.7.5. Financials (Based on Availability)
- 15.2.8 Metco Engineering
- 15.2.8.1. Overview
- 15.2.8.2. Products
- 15.2.8.3. SWOT Analysis
- 15.2.8.4. Recent Developments
- 15.2.8.5. Financials (Based on Availability)
- 15.2.9 Green Energy Corp
- 15.2.9.1. Overview
- 15.2.9.2. Products
- 15.2.9.3. SWOT Analysis
- 15.2.9.4. Recent Developments
- 15.2.9.5. Financials (Based on Availability)
- 15.2.10 General Electric Company
- 15.2.10.1. Overview
- 15.2.10.2. Products
- 15.2.10.3. SWOT Analysis
- 15.2.10.4. Recent Developments
- 15.2.10.5. Financials (Based on Availability)
- 15.2.1 ABB Ltd
List of Figures
- Figure 1: Global Microgrid-as-a-Service Industry Revenue Breakdown (Million, %) by Region 2024 & 2032
- Figure 2: North America Microgrid-as-a-Service Industry Revenue (Million), by Country 2024 & 2032
- Figure 3: North America Microgrid-as-a-Service Industry Revenue Share (%), by Country 2024 & 2032
- Figure 4: Europe Microgrid-as-a-Service Industry Revenue (Million), by Country 2024 & 2032
- Figure 5: Europe Microgrid-as-a-Service Industry Revenue Share (%), by Country 2024 & 2032
- Figure 6: Asia Pacific Microgrid-as-a-Service Industry Revenue (Million), by Country 2024 & 2032
- Figure 7: Asia Pacific Microgrid-as-a-Service Industry Revenue Share (%), by Country 2024 & 2032
- Figure 8: South America Microgrid-as-a-Service Industry Revenue (Million), by Country 2024 & 2032
- Figure 9: South America Microgrid-as-a-Service Industry Revenue Share (%), by Country 2024 & 2032
- Figure 10: MEA Microgrid-as-a-Service Industry Revenue (Million), by Country 2024 & 2032
- Figure 11: MEA Microgrid-as-a-Service Industry Revenue Share (%), by Country 2024 & 2032
- Figure 12: North America Microgrid-as-a-Service Industry Revenue (Million), by Service Type 2024 & 2032
- Figure 13: North America Microgrid-as-a-Service Industry Revenue Share (%), by Service Type 2024 & 2032
- Figure 14: North America Microgrid-as-a-Service Industry Revenue (Million), by End-user Vertical 2024 & 2032
- Figure 15: North America Microgrid-as-a-Service Industry Revenue Share (%), by End-user Vertical 2024 & 2032
- Figure 16: North America Microgrid-as-a-Service Industry Revenue (Million), by Country 2024 & 2032
- Figure 17: North America Microgrid-as-a-Service Industry Revenue Share (%), by Country 2024 & 2032
- Figure 18: Europe Microgrid-as-a-Service Industry Revenue (Million), by Service Type 2024 & 2032
- Figure 19: Europe Microgrid-as-a-Service Industry Revenue Share (%), by Service Type 2024 & 2032
- Figure 20: Europe Microgrid-as-a-Service Industry Revenue (Million), by End-user Vertical 2024 & 2032
- Figure 21: Europe Microgrid-as-a-Service Industry Revenue Share (%), by End-user Vertical 2024 & 2032
- Figure 22: Europe Microgrid-as-a-Service Industry Revenue (Million), by Country 2024 & 2032
- Figure 23: Europe Microgrid-as-a-Service Industry Revenue Share (%), by Country 2024 & 2032
- Figure 24: Asia Pacific Microgrid-as-a-Service Industry Revenue (Million), by Service Type 2024 & 2032
- Figure 25: Asia Pacific Microgrid-as-a-Service Industry Revenue Share (%), by Service Type 2024 & 2032
- Figure 26: Asia Pacific Microgrid-as-a-Service Industry Revenue (Million), by End-user Vertical 2024 & 2032
- Figure 27: Asia Pacific Microgrid-as-a-Service Industry Revenue Share (%), by End-user Vertical 2024 & 2032
- Figure 28: Asia Pacific Microgrid-as-a-Service Industry Revenue (Million), by Country 2024 & 2032
- Figure 29: Asia Pacific Microgrid-as-a-Service Industry Revenue Share (%), by Country 2024 & 2032
- Figure 30: Rest of the World Microgrid-as-a-Service Industry Revenue (Million), by Service Type 2024 & 2032
- Figure 31: Rest of the World Microgrid-as-a-Service Industry Revenue Share (%), by Service Type 2024 & 2032
- Figure 32: Rest of the World Microgrid-as-a-Service Industry Revenue (Million), by End-user Vertical 2024 & 2032
- Figure 33: Rest of the World Microgrid-as-a-Service Industry Revenue Share (%), by End-user Vertical 2024 & 2032
- Figure 34: Rest of the World Microgrid-as-a-Service Industry Revenue (Million), by Country 2024 & 2032
- Figure 35: Rest of the World Microgrid-as-a-Service Industry Revenue Share (%), by Country 2024 & 2032
List of Tables
- Table 1: Global Microgrid-as-a-Service Industry Revenue Million Forecast, by Region 2019 & 2032
- Table 2: Global Microgrid-as-a-Service Industry Revenue Million Forecast, by Service Type 2019 & 2032
- Table 3: Global Microgrid-as-a-Service Industry Revenue Million Forecast, by End-user Vertical 2019 & 2032
- Table 4: Global Microgrid-as-a-Service Industry Revenue Million Forecast, by Region 2019 & 2032
- Table 5: Global Microgrid-as-a-Service Industry Revenue Million Forecast, by Country 2019 & 2032
- Table 6: United States Microgrid-as-a-Service Industry Revenue (Million) Forecast, by Application 2019 & 2032
- Table 7: Canada Microgrid-as-a-Service Industry Revenue (Million) Forecast, by Application 2019 & 2032
- Table 8: Mexico Microgrid-as-a-Service Industry Revenue (Million) Forecast, by Application 2019 & 2032
- Table 9: Global Microgrid-as-a-Service Industry Revenue Million Forecast, by Country 2019 & 2032
- Table 10: Germany Microgrid-as-a-Service Industry Revenue (Million) Forecast, by Application 2019 & 2032
- Table 11: United Kingdom Microgrid-as-a-Service Industry Revenue (Million) Forecast, by Application 2019 & 2032
- Table 12: France Microgrid-as-a-Service Industry Revenue (Million) Forecast, by Application 2019 & 2032
- Table 13: Spain Microgrid-as-a-Service Industry Revenue (Million) Forecast, by Application 2019 & 2032
- Table 14: Italy Microgrid-as-a-Service Industry Revenue (Million) Forecast, by Application 2019 & 2032
- Table 15: Spain Microgrid-as-a-Service Industry Revenue (Million) Forecast, by Application 2019 & 2032
- Table 16: Belgium Microgrid-as-a-Service Industry Revenue (Million) Forecast, by Application 2019 & 2032
- Table 17: Netherland Microgrid-as-a-Service Industry Revenue (Million) Forecast, by Application 2019 & 2032
- Table 18: Nordics Microgrid-as-a-Service Industry Revenue (Million) Forecast, by Application 2019 & 2032
- Table 19: Rest of Europe Microgrid-as-a-Service Industry Revenue (Million) Forecast, by Application 2019 & 2032
- Table 20: Global Microgrid-as-a-Service Industry Revenue Million Forecast, by Country 2019 & 2032
- Table 21: China Microgrid-as-a-Service Industry Revenue (Million) Forecast, by Application 2019 & 2032
- Table 22: Japan Microgrid-as-a-Service Industry Revenue (Million) Forecast, by Application 2019 & 2032
- Table 23: India Microgrid-as-a-Service Industry Revenue (Million) Forecast, by Application 2019 & 2032
- Table 24: South Korea Microgrid-as-a-Service Industry Revenue (Million) Forecast, by Application 2019 & 2032
- Table 25: Southeast Asia Microgrid-as-a-Service Industry Revenue (Million) Forecast, by Application 2019 & 2032
- Table 26: Australia Microgrid-as-a-Service Industry Revenue (Million) Forecast, by Application 2019 & 2032
- Table 27: Indonesia Microgrid-as-a-Service Industry Revenue (Million) Forecast, by Application 2019 & 2032
- Table 28: Phillipes Microgrid-as-a-Service Industry Revenue (Million) Forecast, by Application 2019 & 2032
- Table 29: Singapore Microgrid-as-a-Service Industry Revenue (Million) Forecast, by Application 2019 & 2032
- Table 30: Thailandc Microgrid-as-a-Service Industry Revenue (Million) Forecast, by Application 2019 & 2032
- Table 31: Rest of Asia Pacific Microgrid-as-a-Service Industry Revenue (Million) Forecast, by Application 2019 & 2032
- Table 32: Global Microgrid-as-a-Service Industry Revenue Million Forecast, by Country 2019 & 2032
- Table 33: Brazil Microgrid-as-a-Service Industry Revenue (Million) Forecast, by Application 2019 & 2032
- Table 34: Argentina Microgrid-as-a-Service Industry Revenue (Million) Forecast, by Application 2019 & 2032
- Table 35: Peru Microgrid-as-a-Service Industry Revenue (Million) Forecast, by Application 2019 & 2032
- Table 36: Chile Microgrid-as-a-Service Industry Revenue (Million) Forecast, by Application 2019 & 2032
- Table 37: Colombia Microgrid-as-a-Service Industry Revenue (Million) Forecast, by Application 2019 & 2032
- Table 38: Ecuador Microgrid-as-a-Service Industry Revenue (Million) Forecast, by Application 2019 & 2032
- Table 39: Venezuela Microgrid-as-a-Service Industry Revenue (Million) Forecast, by Application 2019 & 2032
- Table 40: Rest of South America Microgrid-as-a-Service Industry Revenue (Million) Forecast, by Application 2019 & 2032
- Table 41: Global Microgrid-as-a-Service Industry Revenue Million Forecast, by Country 2019 & 2032
- Table 42: United Arab Emirates Microgrid-as-a-Service Industry Revenue (Million) Forecast, by Application 2019 & 2032
- Table 43: Saudi Arabia Microgrid-as-a-Service Industry Revenue (Million) Forecast, by Application 2019 & 2032
- Table 44: South Africa Microgrid-as-a-Service Industry Revenue (Million) Forecast, by Application 2019 & 2032
- Table 45: Rest of Middle East and Africa Microgrid-as-a-Service Industry Revenue (Million) Forecast, by Application 2019 & 2032
- Table 46: Global Microgrid-as-a-Service Industry Revenue Million Forecast, by Service Type 2019 & 2032
- Table 47: Global Microgrid-as-a-Service Industry Revenue Million Forecast, by End-user Vertical 2019 & 2032
- Table 48: Global Microgrid-as-a-Service Industry Revenue Million Forecast, by Country 2019 & 2032
- Table 49: Global Microgrid-as-a-Service Industry Revenue Million Forecast, by Service Type 2019 & 2032
- Table 50: Global Microgrid-as-a-Service Industry Revenue Million Forecast, by End-user Vertical 2019 & 2032
- Table 51: Global Microgrid-as-a-Service Industry Revenue Million Forecast, by Country 2019 & 2032
- Table 52: Global Microgrid-as-a-Service Industry Revenue Million Forecast, by Service Type 2019 & 2032
- Table 53: Global Microgrid-as-a-Service Industry Revenue Million Forecast, by End-user Vertical 2019 & 2032
- Table 54: Global Microgrid-as-a-Service Industry Revenue Million Forecast, by Country 2019 & 2032
- Table 55: Global Microgrid-as-a-Service Industry Revenue Million Forecast, by Service Type 2019 & 2032
- Table 56: Global Microgrid-as-a-Service Industry Revenue Million Forecast, by End-user Vertical 2019 & 2032
- Table 57: Global Microgrid-as-a-Service Industry Revenue Million Forecast, by Country 2019 & 2032
Frequently Asked Questions
1. What is the projected Compound Annual Growth Rate (CAGR) of the Microgrid-as-a-Service Industry?
The projected CAGR is approximately 15.00%.
2. Which companies are prominent players in the Microgrid-as-a-Service Industry?
Key companies in the market include ABB Ltd, Eaton Corporation Inc, Siemens AG, Aggreko PLC, Spirae Inc, Schneider Electric SE, Pareto Energy, Metco Engineering, Green Energy Corp, General Electric Company.
3. What are the main segments of the Microgrid-as-a-Service Industry?
The market segments include Service Type, End-user Vertical.
4. Can you provide details about the market size?
The market size is estimated to be USD XX Million as of 2022.
5. What are some drivers contributing to market growth?
Increasing Demand From Hospitals and Remote Areas; High Investments from Governments.
6. What are the notable trends driving market growth?
Residential and Commercial Segment to Witness Significant Growth.
7. Are there any restraints impacting market growth?
Complexities in Managing Large-sized Microgrids.
8. Can you provide examples of recent developments in the market?
N/A
9. What pricing options are available for accessing the report?
Pricing options include single-user, multi-user, and enterprise licenses priced at USD 4750, USD 5250, and USD 8750 respectively.
10. Is the market size provided in terms of value or volume?
The market size is provided in terms of value, measured in Million.
11. Are there any specific market keywords associated with the report?
Yes, the market keyword associated with the report is "Microgrid-as-a-Service Industry," which aids in identifying and referencing the specific market segment covered.
12. How do I determine which pricing option suits my needs best?
The pricing options vary based on user requirements and access needs. Individual users may opt for single-user licenses, while businesses requiring broader access may choose multi-user or enterprise licenses for cost-effective access to the report.
13. Are there any additional resources or data provided in the Microgrid-as-a-Service Industry report?
While the report offers comprehensive insights, it's advisable to review the specific contents or supplementary materials provided to ascertain if additional resources or data are available.
14. How can I stay updated on further developments or reports in the Microgrid-as-a-Service Industry?
To stay informed about further developments, trends, and reports in the Microgrid-as-a-Service Industry, consider subscribing to industry newsletters, following relevant companies and organizations, or regularly checking reputable industry news sources and publications.
Methodology
Step 1 - Identification of Relevant Samples Size from Population Database


Step 2 - Approaches for Defining Global Market Size (Value, Volume* & Price*)

Note*: In applicable scenarios
Step 3 - Data Sources
Primary Research
- Web Analytics
- Survey Reports
- Research Institute
- Latest Research Reports
- Opinion Leaders
Secondary Research
- Annual Reports
- White Paper
- Latest Press Release
- Industry Association
- Paid Database
- Investor Presentations

Step 4 - Data Triangulation
Involves using different sources of information in order to increase the validity of a study
These sources are likely to be stakeholders in a program - participants, other researchers, program staff, other community members, and so on.
Then we put all data in single framework & apply various statistical tools to find out the dynamic on the market.
During the analysis stage, feedback from the stakeholder groups would be compared to determine areas of agreement as well as areas of divergence


