
Key Insights
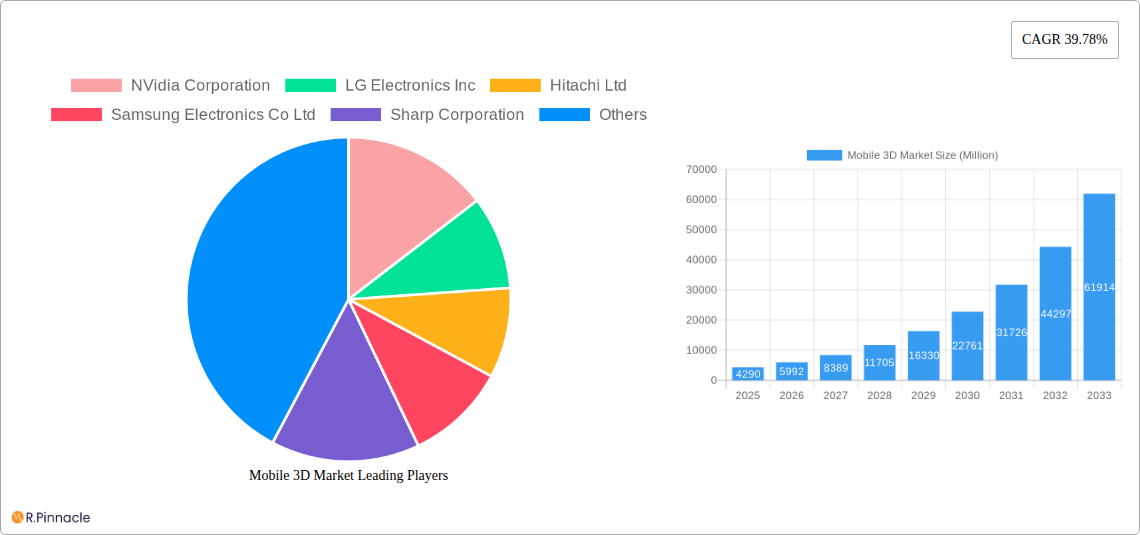
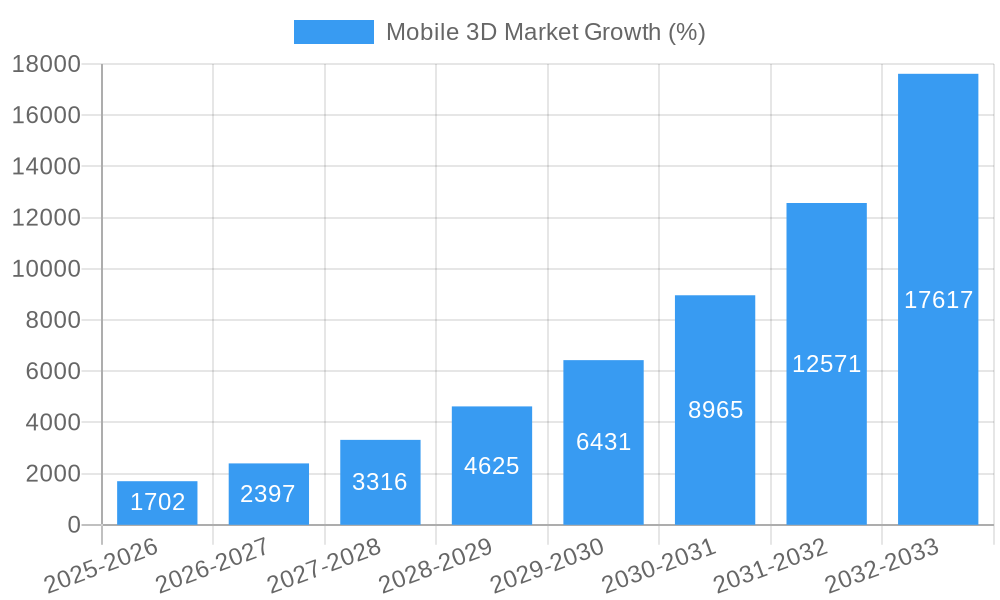
The mobile 3D market is experiencing explosive growth, projected to reach a substantial size with a remarkable Compound Annual Growth Rate (CAGR) of 39.78% between 2019 and 2033. This expansion is fueled by several key factors. The increasing sophistication of mobile device hardware, including advancements in image sensors and 3D display technologies, is a primary driver. Consumers are demanding more immersive and interactive mobile experiences, creating significant opportunities for 3D applications across various sectors. The integration of 3D technology into mobile gaming, augmented reality (AR) applications, and interactive advertising is pushing adoption rates higher. Furthermore, improvements in processing power and battery technology are making 3D capabilities more accessible and energy-efficient, removing previous technological barriers. Geographical expansion, particularly in rapidly developing Asian markets, is also contributing to this significant market growth. While challenges remain—such as the need for more standardized 3D content creation and distribution, and ensuring affordability for wider adoption—the overall outlook for the mobile 3D market is exceptionally promising.
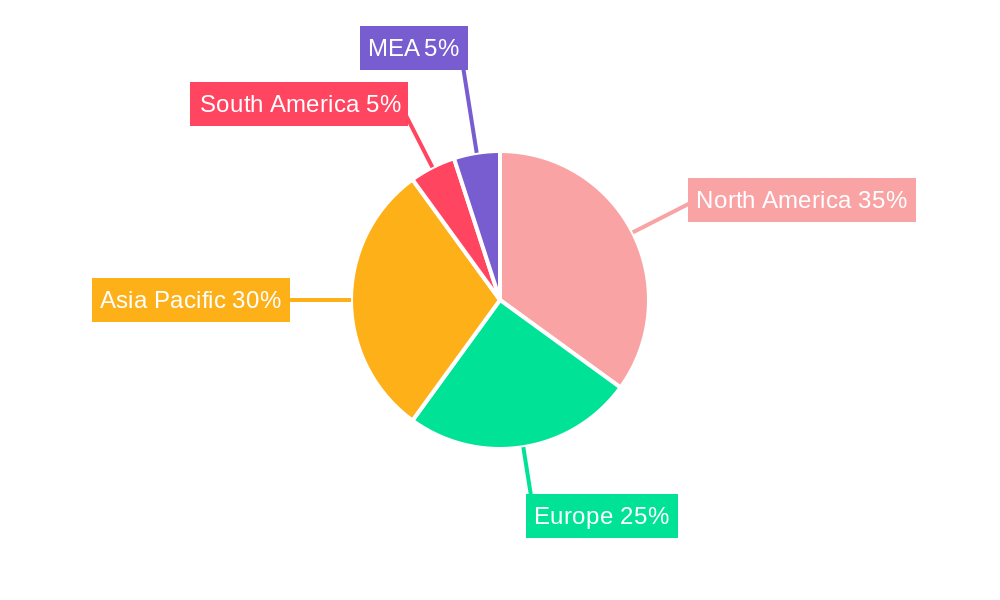
The market segmentation reveals key areas of focus. Smartphones are currently leading the 3D enabled mobile device segment, followed by tablets and notebooks. However, the rapid development of 3D eyewear and other emerging devices suggests a potential shift in market share in the coming years. Within device components, image sensors and 3D displays are vital, and their advancement directly correlates with overall market growth. The applications segment highlights gaming, animations, and maps/navigation as significant revenue generators, while mobile advertising is an emerging sector with immense potential. Major players like Nvidia, LG Electronics, Samsung, Apple, and Qualcomm are actively competing in this space, driving innovation and ensuring a dynamic market landscape. The North American and Asia-Pacific regions represent the largest market segments, but strong growth is expected across Europe and other regions as 3D mobile technology becomes increasingly affordable and accessible. The substantial growth trajectory of the mobile 3D market suggests significant investment opportunities for stakeholders across the value chain.
Mobile 3D Market Report: 2019-2033 Forecast
This comprehensive report provides an in-depth analysis of the Mobile 3D Market, offering invaluable insights for industry professionals, investors, and strategists. With a detailed examination of market dynamics, leading players, and future trends, this report is essential for navigating the rapidly evolving landscape of 3D mobile technology. The report covers the period 2019-2033, with a focus on the forecast period 2025-2033 and a base year of 2025. Expected market value is in Millions.
Mobile 3D Market Market Structure & Innovation Trends
The Mobile 3D Market exhibits a moderately concentrated structure, with key players like NVidia Corporation, LG Electronics Inc, Hitachi Ltd, Samsung Electronics Co Ltd, Sharp Corporation, Apple Inc, The 3M Company, Qualcomm Inc, Intel Corporation, and HTC Corporation vying for market share. Market share distribution varies significantly across segments. Innovation is driven by advancements in display technology (e.g., glass-free 3D), image sensors, and processing power, fueled by increasing demand for immersive user experiences. Regulatory frameworks related to data privacy and device safety impact market growth. Product substitutes, such as high-resolution 2D displays, pose a competitive challenge. End-user demographics are expanding beyond early adopters to a broader consumer base. M&A activity in the sector has seen xx Million in deals over the past five years, primarily focused on strengthening technological capabilities and expanding market reach.
- Market Concentration: Moderately concentrated, with a few dominant players controlling a significant portion of the market share.
- Innovation Drivers: Advancements in display technology, image sensors, and processing power.
- Regulatory Frameworks: Data privacy and device safety regulations.
- Product Substitutes: High-resolution 2D displays.
- End-User Demographics: Expanding to a broader consumer base.
- M&A Activities: xx Million in deal value over the last five years.
Mobile 3D Market Market Dynamics & Trends
The Mobile 3D Market is experiencing robust growth, driven by increasing consumer demand for immersive experiences, technological advancements in display and processing technologies, and the rising adoption of 3D applications in various sectors. The Compound Annual Growth Rate (CAGR) is projected at xx% during the forecast period (2025-2033). This growth is further fueled by the expanding availability of high-quality 3D content, the decreasing cost of 3D technology, and the integration of 3D features into mainstream mobile devices. Market penetration is expected to reach xx% by 2033. Competitive dynamics are shaping the market with companies focusing on differentiation through unique features, partnerships, and innovative applications.
Dominant Regions & Segments in Mobile 3D Market
The Asia-Pacific region currently holds the largest market share, driven by high smartphone penetration, increasing disposable income, and a strong manufacturing base. North America and Europe follow closely, fueled by robust demand for advanced mobile technologies.
By 3D Enabled Mobile Devices:
- Smartphones: Leading segment due to high market penetration and growing consumer preference for immersive content.
- Tablets: Significant growth potential driven by the increasing use of tablets for gaming and entertainment.
- Notebooks: Moderate growth, with 3D capabilities integrated into higher-end models.
- Eyewear: Emerging segment with significant potential but facing challenges in terms of cost and user acceptance.
- Other 3D Enabled Devices: Includes specialized devices such as 3D mobile projectors, expected to show moderate growth.
By Device Components:
- 3D Displays: Dominant component segment, driving innovation in glass-free 3D and higher resolutions.
- Image Sensors: Crucial for accurate depth perception, witnessing technological advancements and cost reductions.
By 3D Applications:
- Mobile Gaming: Largest application segment, fueled by the growing popularity of mobile games.
- Animations: Significant market with potential for increased adoption.
- Maps and Navigation: Growing segment, improving user experience and offering enhanced situational awareness.
- Mobile Advertisements: Emerging segment with potential for highly engaging and targeted advertising campaigns.
- Other Applications: Includes medical visualization, industrial design, and education.
Key drivers for regional dominance include favorable economic policies, robust infrastructure, and strong consumer adoption rates.
Mobile 3D Market Product Innovations
Recent innovations include glass-free 3D displays, enabling comfortable viewing without specialized glasses, and advancements in time-of-flight (ToF) technology for improved depth sensing in 3D cameras. These innovations enhance user experience and expand the application of 3D technology across various mobile devices. The market fit for these products is high, given the increasing consumer demand for immersive experiences and the integration of these features into premium mobile devices.
Report Scope & Segmentation Analysis
This report segments the Mobile 3D Market by 3D Enabled Mobile Devices (Smartphones, Notebooks, Tablets, Eyewear, Other 3D Enabled Devices), Device Components (Image Sensors, 3D Displays), and 3D Applications (Animations, Maps and Navigation, Mobile Gaming, Mobile Advertisements, Other Applications). Each segment is analyzed based on market size, growth projections, and competitive dynamics. Growth projections vary significantly across segments, with mobile gaming and 3D displays expected to show the highest growth rates. Competitive dynamics within each segment are influenced by technological advancements, pricing strategies, and brand reputation.
Key Drivers of Mobile 3D Market Growth
The Mobile 3D Market is propelled by several key factors:
- Technological Advancements: Improvements in display technology, image sensors, and processing power enable higher-quality 3D experiences.
- Growing Demand for Immersive Experiences: Consumers increasingly seek engaging and immersive content across various platforms.
- Decreasing Costs: The cost of 3D technology is declining, making it more accessible to a wider range of consumers.
- Expansion of 3D Content: The availability of high-quality 3D content is expanding across various platforms and applications.
Challenges in the Mobile 3D Market Sector
Several challenges hinder the growth of the Mobile 3D Market:
- High Production Costs: The production of 3D mobile devices and components remains relatively expensive, limiting market penetration.
- Power Consumption: 3D features can increase power consumption, leading to shorter battery life.
- Eye Strain: Prolonged use of 3D displays can cause eye strain in some users.
- Limited Content Availability: While growing, high-quality 3D content remains limited compared to 2D content.
Emerging Opportunities in Mobile 3D Market
The Mobile 3D Market presents significant emerging opportunities:
- Augmented Reality (AR) and Virtual Reality (VR) Integration: Combining 3D technology with AR/VR opens up new possibilities for immersive gaming, entertainment, and educational applications.
- Expansion into New Markets: Emerging markets with growing smartphone penetration offer significant growth potential.
- Development of New Applications: Exploring new applications of 3D technology across various sectors can drive market expansion.
Leading Players in the Mobile 3D Market Market
- NVidia Corporation
- LG Electronics Inc
- Hitachi Ltd
- Samsung Electronics Co Ltd
- Sharp Corporation
- Apple Inc
- The 3M Company
- Qualcomm Inc
- Intel Corporation
- HTC Corporation
Key Developments in Mobile 3D Market Industry
- January 2023: Microsoft and Orbbec launched Femto Mega, a 3D camera utilizing time-of-flight technology.
- January 2023: Asus introduced glass-free 3D OLED technology supporting Spatial Vision, allowing two users simultaneously.
- March 2023: ZTE launched the nubia pad 3D, offering glass-less 3D visuals in collaboration with Leia Inc.
Future Outlook for Mobile 3D Market Market
The Mobile 3D Market is poised for substantial growth, driven by continued technological advancements, increasing consumer demand for immersive experiences, and the expansion of 3D applications across diverse sectors. Strategic partnerships, innovative product development, and targeted marketing efforts will be crucial for success in this rapidly evolving market. The market is expected to experience significant expansion in the coming years, driven by the factors outlined above and the increasing accessibility of high-quality 3D technology.
Mobile 3D Market Segmentation
-
1. 3D Enabled Mobile Devices
- 1.1. Smartphones
- 1.2. Notebooks
- 1.3. Tablets
- 1.4. Eyewear
- 1.5. Other 3D Enabled Devices
-
2. Device Components
- 2.1. Image Sensors
- 2.2. 3D Displays
-
3. 3D Applications
- 3.1. Animations
- 3.2. Maps and Navigation
- 3.3. Mobile Gaming
- 3.4. Mobile Advertisements
- 3.5. Other Applications
Mobile 3D Market Segmentation By Geography
-
1. North America
- 1.1. United States
- 1.2. Canada
-
2. Europe
- 2.1. United Kingdom
- 2.2. Germany
- 2.3. France
- 2.4. Rest of the Europe
-
3. Asia Pacific
- 3.1. China
- 3.2. Japan
- 3.3. India
- 3.4. Rest of the Asia Pacific
- 4. Middle East
- 5. LatinAmerica
Mobile 3D Market REPORT HIGHLIGHTS
| Aspects | Details |
|---|---|
| Study Period | 2019-2033 |
| Base Year | 2024 |
| Estimated Year | 2025 |
| Forecast Period | 2025-2033 |
| Historical Period | 2019-2024 |
| Growth Rate | CAGR of 39.78% from 2019-2033 |
| Segmentation |
|
Table of Contents
- 1. Introduction
- 1.1. Research Scope
- 1.2. Market Segmentation
- 1.3. Research Methodology
- 1.4. Definitions and Assumptions
- 2. Executive Summary
- 2.1. Introduction
- 3. Market Dynamics
- 3.1. Introduction
- 3.2. Market Drivers
- 3.2.1. Rise in Smartphone Usage
- 3.3. Market Restrains
- 3.3.1. High Cost of 3D Devices and Content
- 3.4. Market Trends
- 3.4.1. Gaming Applications are Expected to Account for the Largest Share
- 4. Market Factor Analysis
- 4.1. Porters Five Forces
- 4.2. Supply/Value Chain
- 4.3. PESTEL analysis
- 4.4. Market Entropy
- 4.5. Patent/Trademark Analysis
- 5. Global Mobile 3D Market Analysis, Insights and Forecast, 2019-2031
- 5.1. Market Analysis, Insights and Forecast - by 3D Enabled Mobile Devices
- 5.1.1. Smartphones
- 5.1.2. Notebooks
- 5.1.3. Tablets
- 5.1.4. Eyewear
- 5.1.5. Other 3D Enabled Devices
- 5.2. Market Analysis, Insights and Forecast - by Device Components
- 5.2.1. Image Sensors
- 5.2.2. 3D Displays
- 5.3. Market Analysis, Insights and Forecast - by 3D Applications
- 5.3.1. Animations
- 5.3.2. Maps and Navigation
- 5.3.3. Mobile Gaming
- 5.3.4. Mobile Advertisements
- 5.3.5. Other Applications
- 5.4. Market Analysis, Insights and Forecast - by Region
- 5.4.1. North America
- 5.4.2. Europe
- 5.4.3. Asia Pacific
- 5.4.4. Middle East
- 5.4.5. LatinAmerica
- 5.1. Market Analysis, Insights and Forecast - by 3D Enabled Mobile Devices
- 6. North America Mobile 3D Market Analysis, Insights and Forecast, 2019-2031
- 6.1. Market Analysis, Insights and Forecast - by 3D Enabled Mobile Devices
- 6.1.1. Smartphones
- 6.1.2. Notebooks
- 6.1.3. Tablets
- 6.1.4. Eyewear
- 6.1.5. Other 3D Enabled Devices
- 6.2. Market Analysis, Insights and Forecast - by Device Components
- 6.2.1. Image Sensors
- 6.2.2. 3D Displays
- 6.3. Market Analysis, Insights and Forecast - by 3D Applications
- 6.3.1. Animations
- 6.3.2. Maps and Navigation
- 6.3.3. Mobile Gaming
- 6.3.4. Mobile Advertisements
- 6.3.5. Other Applications
- 6.1. Market Analysis, Insights and Forecast - by 3D Enabled Mobile Devices
- 7. Europe Mobile 3D Market Analysis, Insights and Forecast, 2019-2031
- 7.1. Market Analysis, Insights and Forecast - by 3D Enabled Mobile Devices
- 7.1.1. Smartphones
- 7.1.2. Notebooks
- 7.1.3. Tablets
- 7.1.4. Eyewear
- 7.1.5. Other 3D Enabled Devices
- 7.2. Market Analysis, Insights and Forecast - by Device Components
- 7.2.1. Image Sensors
- 7.2.2. 3D Displays
- 7.3. Market Analysis, Insights and Forecast - by 3D Applications
- 7.3.1. Animations
- 7.3.2. Maps and Navigation
- 7.3.3. Mobile Gaming
- 7.3.4. Mobile Advertisements
- 7.3.5. Other Applications
- 7.1. Market Analysis, Insights and Forecast - by 3D Enabled Mobile Devices
- 8. Asia Pacific Mobile 3D Market Analysis, Insights and Forecast, 2019-2031
- 8.1. Market Analysis, Insights and Forecast - by 3D Enabled Mobile Devices
- 8.1.1. Smartphones
- 8.1.2. Notebooks
- 8.1.3. Tablets
- 8.1.4. Eyewear
- 8.1.5. Other 3D Enabled Devices
- 8.2. Market Analysis, Insights and Forecast - by Device Components
- 8.2.1. Image Sensors
- 8.2.2. 3D Displays
- 8.3. Market Analysis, Insights and Forecast - by 3D Applications
- 8.3.1. Animations
- 8.3.2. Maps and Navigation
- 8.3.3. Mobile Gaming
- 8.3.4. Mobile Advertisements
- 8.3.5. Other Applications
- 8.1. Market Analysis, Insights and Forecast - by 3D Enabled Mobile Devices
- 9. Middle East Mobile 3D Market Analysis, Insights and Forecast, 2019-2031
- 9.1. Market Analysis, Insights and Forecast - by 3D Enabled Mobile Devices
- 9.1.1. Smartphones
- 9.1.2. Notebooks
- 9.1.3. Tablets
- 9.1.4. Eyewear
- 9.1.5. Other 3D Enabled Devices
- 9.2. Market Analysis, Insights and Forecast - by Device Components
- 9.2.1. Image Sensors
- 9.2.2. 3D Displays
- 9.3. Market Analysis, Insights and Forecast - by 3D Applications
- 9.3.1. Animations
- 9.3.2. Maps and Navigation
- 9.3.3. Mobile Gaming
- 9.3.4. Mobile Advertisements
- 9.3.5. Other Applications
- 9.1. Market Analysis, Insights and Forecast - by 3D Enabled Mobile Devices
- 10. LatinAmerica Mobile 3D Market Analysis, Insights and Forecast, 2019-2031
- 10.1. Market Analysis, Insights and Forecast - by 3D Enabled Mobile Devices
- 10.1.1. Smartphones
- 10.1.2. Notebooks
- 10.1.3. Tablets
- 10.1.4. Eyewear
- 10.1.5. Other 3D Enabled Devices
- 10.2. Market Analysis, Insights and Forecast - by Device Components
- 10.2.1. Image Sensors
- 10.2.2. 3D Displays
- 10.3. Market Analysis, Insights and Forecast - by 3D Applications
- 10.3.1. Animations
- 10.3.2. Maps and Navigation
- 10.3.3. Mobile Gaming
- 10.3.4. Mobile Advertisements
- 10.3.5. Other Applications
- 10.1. Market Analysis, Insights and Forecast - by 3D Enabled Mobile Devices
- 11. North America Mobile 3D Market Analysis, Insights and Forecast, 2019-2031
- 11.1. Market Analysis, Insights and Forecast - By Country/Sub-region
- 11.1.1 United States
- 11.1.2 Canada
- 11.1.3 Mexico
- 12. Europe Mobile 3D Market Analysis, Insights and Forecast, 2019-2031
- 12.1. Market Analysis, Insights and Forecast - By Country/Sub-region
- 12.1.1 Germany
- 12.1.2 United Kingdom
- 12.1.3 France
- 12.1.4 Spain
- 12.1.5 Italy
- 12.1.6 Spain
- 12.1.7 Belgium
- 12.1.8 Netherland
- 12.1.9 Nordics
- 12.1.10 Rest of Europe
- 13. Asia Pacific Mobile 3D Market Analysis, Insights and Forecast, 2019-2031
- 13.1. Market Analysis, Insights and Forecast - By Country/Sub-region
- 13.1.1 China
- 13.1.2 Japan
- 13.1.3 India
- 13.1.4 South Korea
- 13.1.5 Southeast Asia
- 13.1.6 Australia
- 13.1.7 Indonesia
- 13.1.8 Phillipes
- 13.1.9 Singapore
- 13.1.10 Thailandc
- 13.1.11 Rest of Asia Pacific
- 14. South America Mobile 3D Market Analysis, Insights and Forecast, 2019-2031
- 14.1. Market Analysis, Insights and Forecast - By Country/Sub-region
- 14.1.1 Brazil
- 14.1.2 Argentina
- 14.1.3 Peru
- 14.1.4 Chile
- 14.1.5 Colombia
- 14.1.6 Ecuador
- 14.1.7 Venezuela
- 14.1.8 Rest of South America
- 15. North America Mobile 3D Market Analysis, Insights and Forecast, 2019-2031
- 15.1. Market Analysis, Insights and Forecast - By Country/Sub-region
- 15.1.1 United States
- 15.1.2 Canada
- 15.1.3 Mexico
- 16. MEA Mobile 3D Market Analysis, Insights and Forecast, 2019-2031
- 16.1. Market Analysis, Insights and Forecast - By Country/Sub-region
- 16.1.1 United Arab Emirates
- 16.1.2 Saudi Arabia
- 16.1.3 South Africa
- 16.1.4 Rest of Middle East and Africa
- 17. Competitive Analysis
- 17.1. Global Market Share Analysis 2024
- 17.2. Company Profiles
- 17.2.1 NVidia Corporation
- 17.2.1.1. Overview
- 17.2.1.2. Products
- 17.2.1.3. SWOT Analysis
- 17.2.1.4. Recent Developments
- 17.2.1.5. Financials (Based on Availability)
- 17.2.2 LG Electronics Inc
- 17.2.2.1. Overview
- 17.2.2.2. Products
- 17.2.2.3. SWOT Analysis
- 17.2.2.4. Recent Developments
- 17.2.2.5. Financials (Based on Availability)
- 17.2.3 Hitachi Ltd
- 17.2.3.1. Overview
- 17.2.3.2. Products
- 17.2.3.3. SWOT Analysis
- 17.2.3.4. Recent Developments
- 17.2.3.5. Financials (Based on Availability)
- 17.2.4 Samsung Electronics Co Ltd
- 17.2.4.1. Overview
- 17.2.4.2. Products
- 17.2.4.3. SWOT Analysis
- 17.2.4.4. Recent Developments
- 17.2.4.5. Financials (Based on Availability)
- 17.2.5 Sharp Corporation
- 17.2.5.1. Overview
- 17.2.5.2. Products
- 17.2.5.3. SWOT Analysis
- 17.2.5.4. Recent Developments
- 17.2.5.5. Financials (Based on Availability)
- 17.2.6 Apple Inc
- 17.2.6.1. Overview
- 17.2.6.2. Products
- 17.2.6.3. SWOT Analysis
- 17.2.6.4. Recent Developments
- 17.2.6.5. Financials (Based on Availability)
- 17.2.7 The 3M Company
- 17.2.7.1. Overview
- 17.2.7.2. Products
- 17.2.7.3. SWOT Analysis
- 17.2.7.4. Recent Developments
- 17.2.7.5. Financials (Based on Availability)
- 17.2.8 Qualcomm Inc *List Not Exhaustive
- 17.2.8.1. Overview
- 17.2.8.2. Products
- 17.2.8.3. SWOT Analysis
- 17.2.8.4. Recent Developments
- 17.2.8.5. Financials (Based on Availability)
- 17.2.9 Intel Corporation
- 17.2.9.1. Overview
- 17.2.9.2. Products
- 17.2.9.3. SWOT Analysis
- 17.2.9.4. Recent Developments
- 17.2.9.5. Financials (Based on Availability)
- 17.2.10 HTC Corporation
- 17.2.10.1. Overview
- 17.2.10.2. Products
- 17.2.10.3. SWOT Analysis
- 17.2.10.4. Recent Developments
- 17.2.10.5. Financials (Based on Availability)
- 17.2.1 NVidia Corporation
List of Figures
- Figure 1: Global Mobile 3D Market Revenue Breakdown (Million, %) by Region 2024 & 2032
- Figure 2: North America Mobile 3D Market Revenue (Million), by Country 2024 & 2032
- Figure 3: North America Mobile 3D Market Revenue Share (%), by Country 2024 & 2032
- Figure 4: Europe Mobile 3D Market Revenue (Million), by Country 2024 & 2032
- Figure 5: Europe Mobile 3D Market Revenue Share (%), by Country 2024 & 2032
- Figure 6: Asia Pacific Mobile 3D Market Revenue (Million), by Country 2024 & 2032
- Figure 7: Asia Pacific Mobile 3D Market Revenue Share (%), by Country 2024 & 2032
- Figure 8: South America Mobile 3D Market Revenue (Million), by Country 2024 & 2032
- Figure 9: South America Mobile 3D Market Revenue Share (%), by Country 2024 & 2032
- Figure 10: North America Mobile 3D Market Revenue (Million), by Country 2024 & 2032
- Figure 11: North America Mobile 3D Market Revenue Share (%), by Country 2024 & 2032
- Figure 12: MEA Mobile 3D Market Revenue (Million), by Country 2024 & 2032
- Figure 13: MEA Mobile 3D Market Revenue Share (%), by Country 2024 & 2032
- Figure 14: North America Mobile 3D Market Revenue (Million), by 3D Enabled Mobile Devices 2024 & 2032
- Figure 15: North America Mobile 3D Market Revenue Share (%), by 3D Enabled Mobile Devices 2024 & 2032
- Figure 16: North America Mobile 3D Market Revenue (Million), by Device Components 2024 & 2032
- Figure 17: North America Mobile 3D Market Revenue Share (%), by Device Components 2024 & 2032
- Figure 18: North America Mobile 3D Market Revenue (Million), by 3D Applications 2024 & 2032
- Figure 19: North America Mobile 3D Market Revenue Share (%), by 3D Applications 2024 & 2032
- Figure 20: North America Mobile 3D Market Revenue (Million), by Country 2024 & 2032
- Figure 21: North America Mobile 3D Market Revenue Share (%), by Country 2024 & 2032
- Figure 22: Europe Mobile 3D Market Revenue (Million), by 3D Enabled Mobile Devices 2024 & 2032
- Figure 23: Europe Mobile 3D Market Revenue Share (%), by 3D Enabled Mobile Devices 2024 & 2032
- Figure 24: Europe Mobile 3D Market Revenue (Million), by Device Components 2024 & 2032
- Figure 25: Europe Mobile 3D Market Revenue Share (%), by Device Components 2024 & 2032
- Figure 26: Europe Mobile 3D Market Revenue (Million), by 3D Applications 2024 & 2032
- Figure 27: Europe Mobile 3D Market Revenue Share (%), by 3D Applications 2024 & 2032
- Figure 28: Europe Mobile 3D Market Revenue (Million), by Country 2024 & 2032
- Figure 29: Europe Mobile 3D Market Revenue Share (%), by Country 2024 & 2032
- Figure 30: Asia Pacific Mobile 3D Market Revenue (Million), by 3D Enabled Mobile Devices 2024 & 2032
- Figure 31: Asia Pacific Mobile 3D Market Revenue Share (%), by 3D Enabled Mobile Devices 2024 & 2032
- Figure 32: Asia Pacific Mobile 3D Market Revenue (Million), by Device Components 2024 & 2032
- Figure 33: Asia Pacific Mobile 3D Market Revenue Share (%), by Device Components 2024 & 2032
- Figure 34: Asia Pacific Mobile 3D Market Revenue (Million), by 3D Applications 2024 & 2032
- Figure 35: Asia Pacific Mobile 3D Market Revenue Share (%), by 3D Applications 2024 & 2032
- Figure 36: Asia Pacific Mobile 3D Market Revenue (Million), by Country 2024 & 2032
- Figure 37: Asia Pacific Mobile 3D Market Revenue Share (%), by Country 2024 & 2032
- Figure 38: Middle East Mobile 3D Market Revenue (Million), by 3D Enabled Mobile Devices 2024 & 2032
- Figure 39: Middle East Mobile 3D Market Revenue Share (%), by 3D Enabled Mobile Devices 2024 & 2032
- Figure 40: Middle East Mobile 3D Market Revenue (Million), by Device Components 2024 & 2032
- Figure 41: Middle East Mobile 3D Market Revenue Share (%), by Device Components 2024 & 2032
- Figure 42: Middle East Mobile 3D Market Revenue (Million), by 3D Applications 2024 & 2032
- Figure 43: Middle East Mobile 3D Market Revenue Share (%), by 3D Applications 2024 & 2032
- Figure 44: Middle East Mobile 3D Market Revenue (Million), by Country 2024 & 2032
- Figure 45: Middle East Mobile 3D Market Revenue Share (%), by Country 2024 & 2032
- Figure 46: LatinAmerica Mobile 3D Market Revenue (Million), by 3D Enabled Mobile Devices 2024 & 2032
- Figure 47: LatinAmerica Mobile 3D Market Revenue Share (%), by 3D Enabled Mobile Devices 2024 & 2032
- Figure 48: LatinAmerica Mobile 3D Market Revenue (Million), by Device Components 2024 & 2032
- Figure 49: LatinAmerica Mobile 3D Market Revenue Share (%), by Device Components 2024 & 2032
- Figure 50: LatinAmerica Mobile 3D Market Revenue (Million), by 3D Applications 2024 & 2032
- Figure 51: LatinAmerica Mobile 3D Market Revenue Share (%), by 3D Applications 2024 & 2032
- Figure 52: LatinAmerica Mobile 3D Market Revenue (Million), by Country 2024 & 2032
- Figure 53: LatinAmerica Mobile 3D Market Revenue Share (%), by Country 2024 & 2032
List of Tables
- Table 1: Global Mobile 3D Market Revenue Million Forecast, by Region 2019 & 2032
- Table 2: Global Mobile 3D Market Revenue Million Forecast, by 3D Enabled Mobile Devices 2019 & 2032
- Table 3: Global Mobile 3D Market Revenue Million Forecast, by Device Components 2019 & 2032
- Table 4: Global Mobile 3D Market Revenue Million Forecast, by 3D Applications 2019 & 2032
- Table 5: Global Mobile 3D Market Revenue Million Forecast, by Region 2019 & 2032
- Table 6: Global Mobile 3D Market Revenue Million Forecast, by Country 2019 & 2032
- Table 7: United States Mobile 3D Market Revenue (Million) Forecast, by Application 2019 & 2032
- Table 8: Canada Mobile 3D Market Revenue (Million) Forecast, by Application 2019 & 2032
- Table 9: Mexico Mobile 3D Market Revenue (Million) Forecast, by Application 2019 & 2032
- Table 10: Global Mobile 3D Market Revenue Million Forecast, by Country 2019 & 2032
- Table 11: Germany Mobile 3D Market Revenue (Million) Forecast, by Application 2019 & 2032
- Table 12: United Kingdom Mobile 3D Market Revenue (Million) Forecast, by Application 2019 & 2032
- Table 13: France Mobile 3D Market Revenue (Million) Forecast, by Application 2019 & 2032
- Table 14: Spain Mobile 3D Market Revenue (Million) Forecast, by Application 2019 & 2032
- Table 15: Italy Mobile 3D Market Revenue (Million) Forecast, by Application 2019 & 2032
- Table 16: Spain Mobile 3D Market Revenue (Million) Forecast, by Application 2019 & 2032
- Table 17: Belgium Mobile 3D Market Revenue (Million) Forecast, by Application 2019 & 2032
- Table 18: Netherland Mobile 3D Market Revenue (Million) Forecast, by Application 2019 & 2032
- Table 19: Nordics Mobile 3D Market Revenue (Million) Forecast, by Application 2019 & 2032
- Table 20: Rest of Europe Mobile 3D Market Revenue (Million) Forecast, by Application 2019 & 2032
- Table 21: Global Mobile 3D Market Revenue Million Forecast, by Country 2019 & 2032
- Table 22: China Mobile 3D Market Revenue (Million) Forecast, by Application 2019 & 2032
- Table 23: Japan Mobile 3D Market Revenue (Million) Forecast, by Application 2019 & 2032
- Table 24: India Mobile 3D Market Revenue (Million) Forecast, by Application 2019 & 2032
- Table 25: South Korea Mobile 3D Market Revenue (Million) Forecast, by Application 2019 & 2032
- Table 26: Southeast Asia Mobile 3D Market Revenue (Million) Forecast, by Application 2019 & 2032
- Table 27: Australia Mobile 3D Market Revenue (Million) Forecast, by Application 2019 & 2032
- Table 28: Indonesia Mobile 3D Market Revenue (Million) Forecast, by Application 2019 & 2032
- Table 29: Phillipes Mobile 3D Market Revenue (Million) Forecast, by Application 2019 & 2032
- Table 30: Singapore Mobile 3D Market Revenue (Million) Forecast, by Application 2019 & 2032
- Table 31: Thailandc Mobile 3D Market Revenue (Million) Forecast, by Application 2019 & 2032
- Table 32: Rest of Asia Pacific Mobile 3D Market Revenue (Million) Forecast, by Application 2019 & 2032
- Table 33: Global Mobile 3D Market Revenue Million Forecast, by Country 2019 & 2032
- Table 34: Brazil Mobile 3D Market Revenue (Million) Forecast, by Application 2019 & 2032
- Table 35: Argentina Mobile 3D Market Revenue (Million) Forecast, by Application 2019 & 2032
- Table 36: Peru Mobile 3D Market Revenue (Million) Forecast, by Application 2019 & 2032
- Table 37: Chile Mobile 3D Market Revenue (Million) Forecast, by Application 2019 & 2032
- Table 38: Colombia Mobile 3D Market Revenue (Million) Forecast, by Application 2019 & 2032
- Table 39: Ecuador Mobile 3D Market Revenue (Million) Forecast, by Application 2019 & 2032
- Table 40: Venezuela Mobile 3D Market Revenue (Million) Forecast, by Application 2019 & 2032
- Table 41: Rest of South America Mobile 3D Market Revenue (Million) Forecast, by Application 2019 & 2032
- Table 42: Global Mobile 3D Market Revenue Million Forecast, by Country 2019 & 2032
- Table 43: United States Mobile 3D Market Revenue (Million) Forecast, by Application 2019 & 2032
- Table 44: Canada Mobile 3D Market Revenue (Million) Forecast, by Application 2019 & 2032
- Table 45: Mexico Mobile 3D Market Revenue (Million) Forecast, by Application 2019 & 2032
- Table 46: Global Mobile 3D Market Revenue Million Forecast, by Country 2019 & 2032
- Table 47: United Arab Emirates Mobile 3D Market Revenue (Million) Forecast, by Application 2019 & 2032
- Table 48: Saudi Arabia Mobile 3D Market Revenue (Million) Forecast, by Application 2019 & 2032
- Table 49: South Africa Mobile 3D Market Revenue (Million) Forecast, by Application 2019 & 2032
- Table 50: Rest of Middle East and Africa Mobile 3D Market Revenue (Million) Forecast, by Application 2019 & 2032
- Table 51: Global Mobile 3D Market Revenue Million Forecast, by 3D Enabled Mobile Devices 2019 & 2032
- Table 52: Global Mobile 3D Market Revenue Million Forecast, by Device Components 2019 & 2032
- Table 53: Global Mobile 3D Market Revenue Million Forecast, by 3D Applications 2019 & 2032
- Table 54: Global Mobile 3D Market Revenue Million Forecast, by Country 2019 & 2032
- Table 55: United States Mobile 3D Market Revenue (Million) Forecast, by Application 2019 & 2032
- Table 56: Canada Mobile 3D Market Revenue (Million) Forecast, by Application 2019 & 2032
- Table 57: Global Mobile 3D Market Revenue Million Forecast, by 3D Enabled Mobile Devices 2019 & 2032
- Table 58: Global Mobile 3D Market Revenue Million Forecast, by Device Components 2019 & 2032
- Table 59: Global Mobile 3D Market Revenue Million Forecast, by 3D Applications 2019 & 2032
- Table 60: Global Mobile 3D Market Revenue Million Forecast, by Country 2019 & 2032
- Table 61: United Kingdom Mobile 3D Market Revenue (Million) Forecast, by Application 2019 & 2032
- Table 62: Germany Mobile 3D Market Revenue (Million) Forecast, by Application 2019 & 2032
- Table 63: France Mobile 3D Market Revenue (Million) Forecast, by Application 2019 & 2032
- Table 64: Rest of the Europe Mobile 3D Market Revenue (Million) Forecast, by Application 2019 & 2032
- Table 65: Global Mobile 3D Market Revenue Million Forecast, by 3D Enabled Mobile Devices 2019 & 2032
- Table 66: Global Mobile 3D Market Revenue Million Forecast, by Device Components 2019 & 2032
- Table 67: Global Mobile 3D Market Revenue Million Forecast, by 3D Applications 2019 & 2032
- Table 68: Global Mobile 3D Market Revenue Million Forecast, by Country 2019 & 2032
- Table 69: China Mobile 3D Market Revenue (Million) Forecast, by Application 2019 & 2032
- Table 70: Japan Mobile 3D Market Revenue (Million) Forecast, by Application 2019 & 2032
- Table 71: India Mobile 3D Market Revenue (Million) Forecast, by Application 2019 & 2032
- Table 72: Rest of the Asia Pacific Mobile 3D Market Revenue (Million) Forecast, by Application 2019 & 2032
- Table 73: Global Mobile 3D Market Revenue Million Forecast, by 3D Enabled Mobile Devices 2019 & 2032
- Table 74: Global Mobile 3D Market Revenue Million Forecast, by Device Components 2019 & 2032
- Table 75: Global Mobile 3D Market Revenue Million Forecast, by 3D Applications 2019 & 2032
- Table 76: Global Mobile 3D Market Revenue Million Forecast, by Country 2019 & 2032
- Table 77: Global Mobile 3D Market Revenue Million Forecast, by 3D Enabled Mobile Devices 2019 & 2032
- Table 78: Global Mobile 3D Market Revenue Million Forecast, by Device Components 2019 & 2032
- Table 79: Global Mobile 3D Market Revenue Million Forecast, by 3D Applications 2019 & 2032
- Table 80: Global Mobile 3D Market Revenue Million Forecast, by Country 2019 & 2032
Frequently Asked Questions
1. What is the projected Compound Annual Growth Rate (CAGR) of the Mobile 3D Market?
The projected CAGR is approximately 39.78%.
2. Which companies are prominent players in the Mobile 3D Market?
Key companies in the market include NVidia Corporation, LG Electronics Inc, Hitachi Ltd, Samsung Electronics Co Ltd, Sharp Corporation, Apple Inc, The 3M Company, Qualcomm Inc *List Not Exhaustive, Intel Corporation, HTC Corporation.
3. What are the main segments of the Mobile 3D Market?
The market segments include 3D Enabled Mobile Devices, Device Components, 3D Applications.
4. Can you provide details about the market size?
The market size is estimated to be USD 42.90 Million as of 2022.
5. What are some drivers contributing to market growth?
Rise in Smartphone Usage.
6. What are the notable trends driving market growth?
Gaming Applications are Expected to Account for the Largest Share.
7. Are there any restraints impacting market growth?
High Cost of 3D Devices and Content.
8. Can you provide examples of recent developments in the market?
March 2023 - ZTE launched nubia pad 3D, which offers glass-less 3D visuals. The product is the combined effort of Leia Inc and ZTE. The tablet can display native 3D content and convert 2D content into 3D in real-time. Leia will also provide pre-installed 3D games and educational apps. The tablet runs on Andriod 13 OS, and Snapdragon 888 SoC is used for faster processing.
9. What pricing options are available for accessing the report?
Pricing options include single-user, multi-user, and enterprise licenses priced at USD 4750, USD 5250, and USD 8750 respectively.
10. Is the market size provided in terms of value or volume?
The market size is provided in terms of value, measured in Million.
11. Are there any specific market keywords associated with the report?
Yes, the market keyword associated with the report is "Mobile 3D Market," which aids in identifying and referencing the specific market segment covered.
12. How do I determine which pricing option suits my needs best?
The pricing options vary based on user requirements and access needs. Individual users may opt for single-user licenses, while businesses requiring broader access may choose multi-user or enterprise licenses for cost-effective access to the report.
13. Are there any additional resources or data provided in the Mobile 3D Market report?
While the report offers comprehensive insights, it's advisable to review the specific contents or supplementary materials provided to ascertain if additional resources or data are available.
14. How can I stay updated on further developments or reports in the Mobile 3D Market?
To stay informed about further developments, trends, and reports in the Mobile 3D Market, consider subscribing to industry newsletters, following relevant companies and organizations, or regularly checking reputable industry news sources and publications.
Methodology
Step 1 - Identification of Relevant Samples Size from Population Database


Step 2 - Approaches for Defining Global Market Size (Value, Volume* & Price*)

Note*: In applicable scenarios
Step 3 - Data Sources
Primary Research
- Web Analytics
- Survey Reports
- Research Institute
- Latest Research Reports
- Opinion Leaders
Secondary Research
- Annual Reports
- White Paper
- Latest Press Release
- Industry Association
- Paid Database
- Investor Presentations

Step 4 - Data Triangulation
Involves using different sources of information in order to increase the validity of a study
These sources are likely to be stakeholders in a program - participants, other researchers, program staff, other community members, and so on.
Then we put all data in single framework & apply various statistical tools to find out the dynamic on the market.
During the analysis stage, feedback from the stakeholder groups would be compared to determine areas of agreement as well as areas of divergence


