
Key Insights
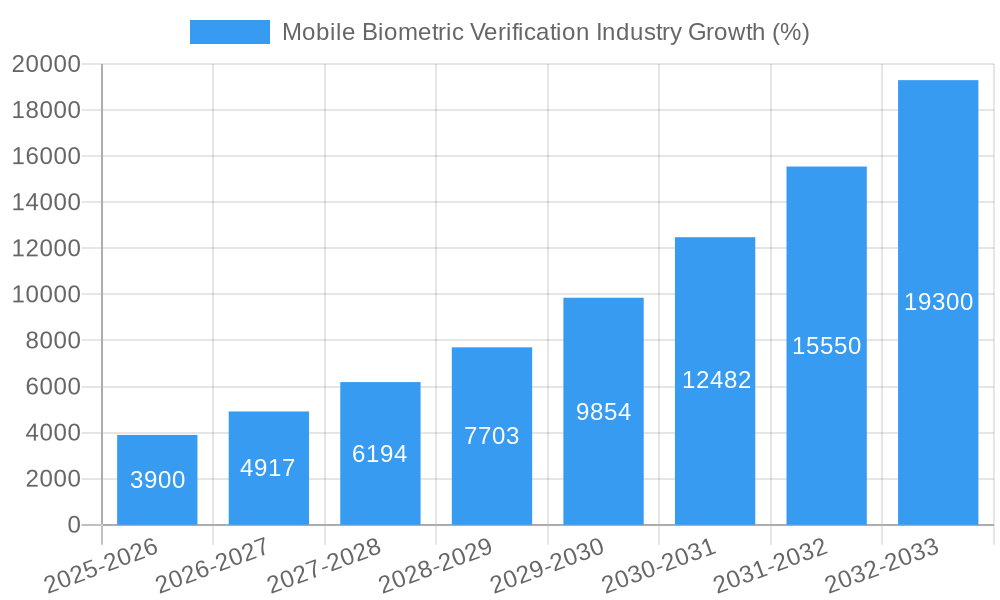
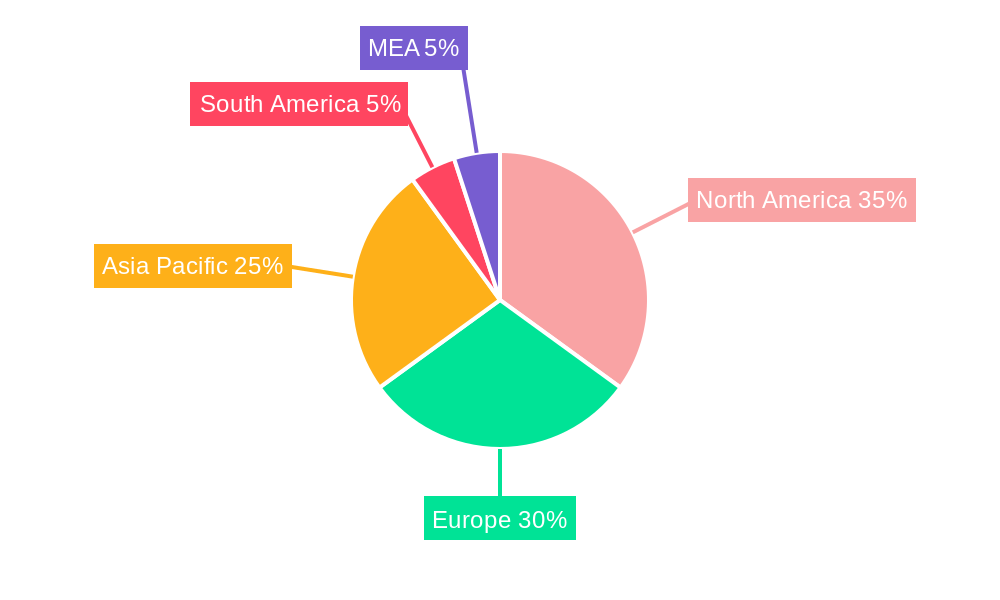
The mobile biometric verification market is experiencing robust growth, driven by the increasing adoption of smartphones and the rising demand for secure authentication solutions across various sectors. The market's Compound Annual Growth Rate (CAGR) of 26% from 2019 to 2024 indicates a significant upward trajectory, projected to continue through 2033. This growth is fueled by several key factors. The rising concerns over data breaches and the need for enhanced security measures in financial transactions, access control systems, and mobile banking applications are major catalysts. Furthermore, advancements in biometric technologies, such as improved fingerprint and facial recognition accuracy, along with the integration of voice and behavioral biometrics, are expanding the market's potential. The convenience and user-friendliness of mobile biometric solutions compared to traditional methods like passwords also contribute significantly to their widespread adoption. While the initial investment in infrastructure and technology can pose a restraint, the long-term cost savings and enhanced security benefits are increasingly outweighing these concerns. The market is segmented by application, with access control and mobile banking being prominent segments, reflecting the crucial role of biometric verification in securing sensitive data and physical access. Geographically, North America and Europe currently hold significant market share, but the Asia-Pacific region is anticipated to witness substantial growth due to its rapidly expanding smartphone user base and increasing digitalization.
The competitive landscape is characterized by a mix of established players and emerging companies, indicating a dynamic market with opportunities for innovation and expansion. Companies like Nuance Communications, Precise Biometrics, and IDEMIA are leading the way with their robust solutions and extensive market reach. However, the market also presents opportunities for smaller, specialized companies to carve out niches by focusing on specific biometric modalities or applications. The continuous evolution of technologies, such as the incorporation of artificial intelligence and machine learning for improved accuracy and fraud prevention, will further shape the market landscape. The increasing integration of biometric verification into Internet of Things (IoT) devices and the development of more sophisticated authentication methods promise continued market expansion in the coming years, making mobile biometric verification a significant sector within the broader cybersecurity and digital identity management markets.
Mobile Biometric Verification Industry Report: 2019-2033
This comprehensive report provides an in-depth analysis of the Mobile Biometric Verification industry, offering invaluable insights for industry professionals, investors, and strategic decision-makers. With a study period spanning 2019-2033, a base year of 2025, and a forecast period of 2025-2033, this report leverages extensive data analysis to project market growth and identify key trends. The market is valued at $XX Million in 2025 and is projected to reach $XX Million by 2033, exhibiting a CAGR of XX%.
Mobile Biometric Verification Industry Market Structure & Innovation Trends
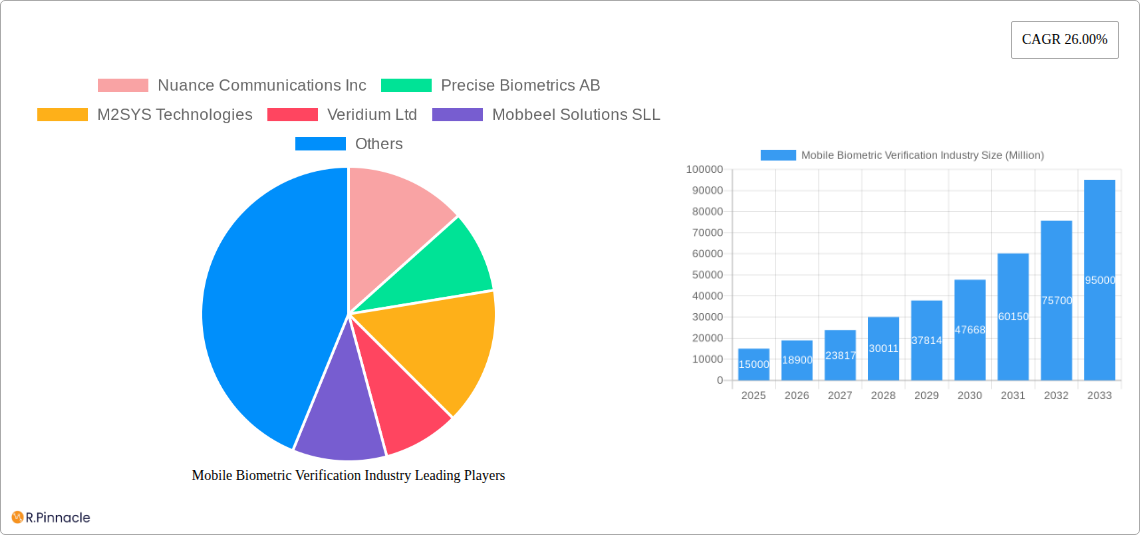
The Mobile Biometric Verification market exhibits a moderately concentrated structure, with key players like Nuance Communications Inc, Precise Biometrics AB, M2SYS Technologies, Veridium Ltd, Mobbeel Solutions SLL, ValidSoft Limited, Aware Inc, VoiceVault Inc, Fingerprint Cards AB, and IDEMIA (Safran Identity & Security SAS) holding significant market share. Precise estimates of market share for each player are unavailable at this time, but the top five companies likely account for approximately 60% of the market. Innovation is driven by advancements in biometric technologies such as fingerprint, facial, and voice recognition, coupled with enhanced security features and user-friendly interfaces. Regulatory frameworks, particularly concerning data privacy and security, significantly influence market dynamics. Product substitutes, such as traditional password-based authentication, face ongoing competition. The end-user demographics are diverse, encompassing individuals and businesses across various sectors. M&A activity has been moderate, with deal values ranging from $XX Million to $XX Million in recent years. Key deals have focused on expanding technological capabilities and broadening market reach.
Mobile Biometric Verification Industry Market Dynamics & Trends
The Mobile Biometric Verification market is experiencing robust growth, driven by several key factors. The increasing adoption of smartphones and other mobile devices has created a large addressable market. The rising need for enhanced security measures across various applications, especially in mobile banking and access control, is fueling market demand. Technological advancements in biometric authentication, including improved accuracy and speed, are further enhancing market appeal. Consumer preferences are shifting towards convenient and secure authentication methods, creating a positive impact on market penetration. The market penetration rate is expected to reach XX% by 2033, up from XX% in 2025. Competitive dynamics are characterized by ongoing innovation, strategic partnerships, and a focus on delivering superior user experiences. The market is witnessing the emergence of new entrants, leading to increased competition.
Dominant Regions & Segments in Mobile Biometric Verification Industry
The North American region currently dominates the Mobile Biometric Verification market, driven by strong technological advancements, high consumer adoption rates, and a robust regulatory landscape supporting innovation.
Key Drivers in North America:
- Strong technological infrastructure
- High smartphone penetration
- Favorable government regulations
- Growing awareness of cybersecurity threats
- High consumer adoption of mobile financial services.
Within application segments, Mobile Banking currently holds the largest market share, fueled by the growing reliance on mobile financial transactions and the need for robust security. Access Control is another significant segment, with steady growth projected due to increasing adoption in enterprises and commercial spaces. The "Other Applications" segment includes government applications, healthcare, and more, representing a rapidly growing area with considerable future potential.
Mobile Biometric Verification Industry Product Innovations
Recent product innovations focus on improving accuracy, speed, and user experience. Multi-modal biometrics, combining different authentication methods, are gaining traction, enhancing security. The integration of artificial intelligence and machine learning is leading to more robust and adaptable systems. These advancements address market needs for enhanced security, improved user convenience, and scalability for large deployments.
Report Scope & Segmentation Analysis
This report segments the Mobile Biometric Verification market by application:
Access Control: This segment is projected to grow at a CAGR of XX% during the forecast period, driven by increased security concerns across various industries. Competitive dynamics are shaped by ongoing innovation in hardware and software solutions. Market size in 2025 is estimated at $XX Million.
Mobile Banking: This segment is anticipated to grow at a CAGR of XX%, fueled by the rise in mobile banking transactions and the consequent need for robust security measures. The market size for 2025 is estimated at $XX Million. Competition is fierce, with providers emphasizing user-friendliness and advanced security features.
Other Applications: This segment encompasses diverse applications and is expected to experience significant growth due to increasing adoption in government, healthcare, and other sectors. The 2025 market size is estimated at $XX Million.
Key Drivers of Mobile Biometric Verification Industry Growth
The Mobile Biometric Verification market's growth is fueled by several factors: the increasing adoption of smartphones and mobile devices, a rising demand for enhanced security measures, technological advancements in biometric technologies, and the shift in consumer preference towards convenient and secure authentication methods. Government regulations promoting digital identity and cybersecurity further encourage market growth.
Challenges in the Mobile Biometric Verification Industry Sector
Significant challenges include stringent regulatory requirements around data privacy and security, the potential for spoofing and fraud, concerns about the ethical implications of biometric data collection and use, and the need for ongoing technological upgrades to maintain security against evolving threats. These factors can impact the market's overall growth rate and adoption.
Emerging Opportunities in Mobile Biometric Verification Industry
Emerging opportunities lie in the expansion into new markets, particularly in developing economies with high mobile penetration rates. The integration of biometric authentication with other technologies, such as blockchain and IoT, holds significant potential. The development of more sophisticated and user-friendly solutions addressing specific market niches promises future growth.
Leading Players in the Mobile Biometric Verification Industry Market
- Nuance Communications Inc
- Precise Biometrics AB
- M2SYS Technologies
- Veridium Ltd
- Mobbeel Solutions SLL
- ValidSoft Limited
- Aware Inc
- VoiceVault Inc
- Fingerprint Cards AB
- IDEMIA (Safran Identity & Security SAS)
Key Developments in Mobile Biometric Verification Industry Industry
- October 2022: Company X launched a new multi-modal biometric authentication system.
- June 2023: Company Y announced a strategic partnership to expand its market reach in Asia.
- March 2024: A major merger between two industry players reshaped the competitive landscape. (Further specific details unavailable)
Future Outlook for Mobile Biometric Verification Industry Market
The Mobile Biometric Verification market is poised for sustained growth, driven by ongoing technological advancements, rising demand for secure authentication solutions, and expansion into new market segments. Strategic partnerships, acquisitions, and the development of innovative solutions will shape the future competitive landscape. The market’s continued expansion into emerging economies and the integration with other technologies present substantial opportunities for growth and innovation.
Mobile Biometric Verification Industry Segmentation
-
1. Application
- 1.1. Access Control
- 1.2. Mobile Banking
- 1.3. Other Applications
Mobile Biometric Verification Industry Segmentation By Geography
-
1. North America
- 1.1. United States
- 1.2. Canada
-
2. Europe
- 2.1. United Kingdom
- 2.2. Germany
- 2.3. France
- 2.4. Italy
- 2.5. Rest of Europe
-
3. Asia Pacific
- 3.1. China
- 3.2. Japan
- 3.3. South Korea
- 3.4. India
- 4. Rest of the World
Mobile Biometric Verification Industry REPORT HIGHLIGHTS
| Aspects | Details |
|---|---|
| Study Period | 2019-2033 |
| Base Year | 2024 |
| Estimated Year | 2025 |
| Forecast Period | 2025-2033 |
| Historical Period | 2019-2024 |
| Growth Rate | CAGR of 26.00% from 2019-2033 |
| Segmentation |
|
Table of Contents
- 1. Introduction
- 1.1. Research Scope
- 1.2. Market Segmentation
- 1.3. Research Methodology
- 1.4. Definitions and Assumptions
- 2. Executive Summary
- 2.1. Introduction
- 3. Market Dynamics
- 3.1. Introduction
- 3.2. Market Drivers
- 3.2.1. ; Growing Popularity of Mobile Commerce; Increasing BYOD Security Requirement
- 3.3. Market Restrains
- 3.3.1. ; Concerns About Data Privacy and Data Breach
- 3.4. Market Trends
- 3.4.1. Mobile Banking is Expected to Hold a Significant Share
- 4. Market Factor Analysis
- 4.1. Porters Five Forces
- 4.2. Supply/Value Chain
- 4.3. PESTEL analysis
- 4.4. Market Entropy
- 4.5. Patent/Trademark Analysis
- 5. Global Mobile Biometric Verification Industry Analysis, Insights and Forecast, 2019-2031
- 5.1. Market Analysis, Insights and Forecast - by Application
- 5.1.1. Access Control
- 5.1.2. Mobile Banking
- 5.1.3. Other Applications
- 5.2. Market Analysis, Insights and Forecast - by Region
- 5.2.1. North America
- 5.2.2. Europe
- 5.2.3. Asia Pacific
- 5.2.4. Rest of the World
- 5.1. Market Analysis, Insights and Forecast - by Application
- 6. North America Mobile Biometric Verification Industry Analysis, Insights and Forecast, 2019-2031
- 6.1. Market Analysis, Insights and Forecast - by Application
- 6.1.1. Access Control
- 6.1.2. Mobile Banking
- 6.1.3. Other Applications
- 6.1. Market Analysis, Insights and Forecast - by Application
- 7. Europe Mobile Biometric Verification Industry Analysis, Insights and Forecast, 2019-2031
- 7.1. Market Analysis, Insights and Forecast - by Application
- 7.1.1. Access Control
- 7.1.2. Mobile Banking
- 7.1.3. Other Applications
- 7.1. Market Analysis, Insights and Forecast - by Application
- 8. Asia Pacific Mobile Biometric Verification Industry Analysis, Insights and Forecast, 2019-2031
- 8.1. Market Analysis, Insights and Forecast - by Application
- 8.1.1. Access Control
- 8.1.2. Mobile Banking
- 8.1.3. Other Applications
- 8.1. Market Analysis, Insights and Forecast - by Application
- 9. Rest of the World Mobile Biometric Verification Industry Analysis, Insights and Forecast, 2019-2031
- 9.1. Market Analysis, Insights and Forecast - by Application
- 9.1.1. Access Control
- 9.1.2. Mobile Banking
- 9.1.3. Other Applications
- 9.1. Market Analysis, Insights and Forecast - by Application
- 10. North America Mobile Biometric Verification Industry Analysis, Insights and Forecast, 2019-2031
- 10.1. Market Analysis, Insights and Forecast - By Country/Sub-region
- 10.1.1 United States
- 10.1.2 Canada
- 10.1.3 Mexico
- 11. Europe Mobile Biometric Verification Industry Analysis, Insights and Forecast, 2019-2031
- 11.1. Market Analysis, Insights and Forecast - By Country/Sub-region
- 11.1.1 Germany
- 11.1.2 United Kingdom
- 11.1.3 France
- 11.1.4 Spain
- 11.1.5 Italy
- 11.1.6 Spain
- 11.1.7 Belgium
- 11.1.8 Netherland
- 11.1.9 Nordics
- 11.1.10 Rest of Europe
- 12. Asia Pacific Mobile Biometric Verification Industry Analysis, Insights and Forecast, 2019-2031
- 12.1. Market Analysis, Insights and Forecast - By Country/Sub-region
- 12.1.1 China
- 12.1.2 Japan
- 12.1.3 India
- 12.1.4 South Korea
- 12.1.5 Southeast Asia
- 12.1.6 Australia
- 12.1.7 Indonesia
- 12.1.8 Phillipes
- 12.1.9 Singapore
- 12.1.10 Thailandc
- 12.1.11 Rest of Asia Pacific
- 13. South America Mobile Biometric Verification Industry Analysis, Insights and Forecast, 2019-2031
- 13.1. Market Analysis, Insights and Forecast - By Country/Sub-region
- 13.1.1 Brazil
- 13.1.2 Argentina
- 13.1.3 Peru
- 13.1.4 Chile
- 13.1.5 Colombia
- 13.1.6 Ecuador
- 13.1.7 Venezuela
- 13.1.8 Rest of South America
- 14. North America Mobile Biometric Verification Industry Analysis, Insights and Forecast, 2019-2031
- 14.1. Market Analysis, Insights and Forecast - By Country/Sub-region
- 14.1.1 United States
- 14.1.2 Canada
- 14.1.3 Mexico
- 15. MEA Mobile Biometric Verification Industry Analysis, Insights and Forecast, 2019-2031
- 15.1. Market Analysis, Insights and Forecast - By Country/Sub-region
- 15.1.1 United Arab Emirates
- 15.1.2 Saudi Arabia
- 15.1.3 South Africa
- 15.1.4 Rest of Middle East and Africa
- 16. Competitive Analysis
- 16.1. Global Market Share Analysis 2024
- 16.2. Company Profiles
- 16.2.1 Nuance Communications Inc
- 16.2.1.1. Overview
- 16.2.1.2. Products
- 16.2.1.3. SWOT Analysis
- 16.2.1.4. Recent Developments
- 16.2.1.5. Financials (Based on Availability)
- 16.2.2 Precise Biometrics AB
- 16.2.2.1. Overview
- 16.2.2.2. Products
- 16.2.2.3. SWOT Analysis
- 16.2.2.4. Recent Developments
- 16.2.2.5. Financials (Based on Availability)
- 16.2.3 M2SYS Technologies
- 16.2.3.1. Overview
- 16.2.3.2. Products
- 16.2.3.3. SWOT Analysis
- 16.2.3.4. Recent Developments
- 16.2.3.5. Financials (Based on Availability)
- 16.2.4 Veridium Ltd
- 16.2.4.1. Overview
- 16.2.4.2. Products
- 16.2.4.3. SWOT Analysis
- 16.2.4.4. Recent Developments
- 16.2.4.5. Financials (Based on Availability)
- 16.2.5 Mobbeel Solutions SLL
- 16.2.5.1. Overview
- 16.2.5.2. Products
- 16.2.5.3. SWOT Analysis
- 16.2.5.4. Recent Developments
- 16.2.5.5. Financials (Based on Availability)
- 16.2.6 ValidSoft Limited
- 16.2.6.1. Overview
- 16.2.6.2. Products
- 16.2.6.3. SWOT Analysis
- 16.2.6.4. Recent Developments
- 16.2.6.5. Financials (Based on Availability)
- 16.2.7 Aware Inc
- 16.2.7.1. Overview
- 16.2.7.2. Products
- 16.2.7.3. SWOT Analysis
- 16.2.7.4. Recent Developments
- 16.2.7.5. Financials (Based on Availability)
- 16.2.8 VoiceVault Inc
- 16.2.8.1. Overview
- 16.2.8.2. Products
- 16.2.8.3. SWOT Analysis
- 16.2.8.4. Recent Developments
- 16.2.8.5. Financials (Based on Availability)
- 16.2.9 Fingerprint Cards AB
- 16.2.9.1. Overview
- 16.2.9.2. Products
- 16.2.9.3. SWOT Analysis
- 16.2.9.4. Recent Developments
- 16.2.9.5. Financials (Based on Availability)
- 16.2.10 IDEMIA (Safran Identity & Security SAS)
- 16.2.10.1. Overview
- 16.2.10.2. Products
- 16.2.10.3. SWOT Analysis
- 16.2.10.4. Recent Developments
- 16.2.10.5. Financials (Based on Availability)
- 16.2.1 Nuance Communications Inc
List of Figures
- Figure 1: Global Mobile Biometric Verification Industry Revenue Breakdown (Million, %) by Region 2024 & 2032
- Figure 2: Global Mobile Biometric Verification Industry Volume Breakdown (K Unit, %) by Region 2024 & 2032
- Figure 3: North America Mobile Biometric Verification Industry Revenue (Million), by Country 2024 & 2032
- Figure 4: North America Mobile Biometric Verification Industry Volume (K Unit), by Country 2024 & 2032
- Figure 5: North America Mobile Biometric Verification Industry Revenue Share (%), by Country 2024 & 2032
- Figure 6: North America Mobile Biometric Verification Industry Volume Share (%), by Country 2024 & 2032
- Figure 7: Europe Mobile Biometric Verification Industry Revenue (Million), by Country 2024 & 2032
- Figure 8: Europe Mobile Biometric Verification Industry Volume (K Unit), by Country 2024 & 2032
- Figure 9: Europe Mobile Biometric Verification Industry Revenue Share (%), by Country 2024 & 2032
- Figure 10: Europe Mobile Biometric Verification Industry Volume Share (%), by Country 2024 & 2032
- Figure 11: Asia Pacific Mobile Biometric Verification Industry Revenue (Million), by Country 2024 & 2032
- Figure 12: Asia Pacific Mobile Biometric Verification Industry Volume (K Unit), by Country 2024 & 2032
- Figure 13: Asia Pacific Mobile Biometric Verification Industry Revenue Share (%), by Country 2024 & 2032
- Figure 14: Asia Pacific Mobile Biometric Verification Industry Volume Share (%), by Country 2024 & 2032
- Figure 15: South America Mobile Biometric Verification Industry Revenue (Million), by Country 2024 & 2032
- Figure 16: South America Mobile Biometric Verification Industry Volume (K Unit), by Country 2024 & 2032
- Figure 17: South America Mobile Biometric Verification Industry Revenue Share (%), by Country 2024 & 2032
- Figure 18: South America Mobile Biometric Verification Industry Volume Share (%), by Country 2024 & 2032
- Figure 19: North America Mobile Biometric Verification Industry Revenue (Million), by Country 2024 & 2032
- Figure 20: North America Mobile Biometric Verification Industry Volume (K Unit), by Country 2024 & 2032
- Figure 21: North America Mobile Biometric Verification Industry Revenue Share (%), by Country 2024 & 2032
- Figure 22: North America Mobile Biometric Verification Industry Volume Share (%), by Country 2024 & 2032
- Figure 23: MEA Mobile Biometric Verification Industry Revenue (Million), by Country 2024 & 2032
- Figure 24: MEA Mobile Biometric Verification Industry Volume (K Unit), by Country 2024 & 2032
- Figure 25: MEA Mobile Biometric Verification Industry Revenue Share (%), by Country 2024 & 2032
- Figure 26: MEA Mobile Biometric Verification Industry Volume Share (%), by Country 2024 & 2032
- Figure 27: North America Mobile Biometric Verification Industry Revenue (Million), by Application 2024 & 2032
- Figure 28: North America Mobile Biometric Verification Industry Volume (K Unit), by Application 2024 & 2032
- Figure 29: North America Mobile Biometric Verification Industry Revenue Share (%), by Application 2024 & 2032
- Figure 30: North America Mobile Biometric Verification Industry Volume Share (%), by Application 2024 & 2032
- Figure 31: North America Mobile Biometric Verification Industry Revenue (Million), by Country 2024 & 2032
- Figure 32: North America Mobile Biometric Verification Industry Volume (K Unit), by Country 2024 & 2032
- Figure 33: North America Mobile Biometric Verification Industry Revenue Share (%), by Country 2024 & 2032
- Figure 34: North America Mobile Biometric Verification Industry Volume Share (%), by Country 2024 & 2032
- Figure 35: Europe Mobile Biometric Verification Industry Revenue (Million), by Application 2024 & 2032
- Figure 36: Europe Mobile Biometric Verification Industry Volume (K Unit), by Application 2024 & 2032
- Figure 37: Europe Mobile Biometric Verification Industry Revenue Share (%), by Application 2024 & 2032
- Figure 38: Europe Mobile Biometric Verification Industry Volume Share (%), by Application 2024 & 2032
- Figure 39: Europe Mobile Biometric Verification Industry Revenue (Million), by Country 2024 & 2032
- Figure 40: Europe Mobile Biometric Verification Industry Volume (K Unit), by Country 2024 & 2032
- Figure 41: Europe Mobile Biometric Verification Industry Revenue Share (%), by Country 2024 & 2032
- Figure 42: Europe Mobile Biometric Verification Industry Volume Share (%), by Country 2024 & 2032
- Figure 43: Asia Pacific Mobile Biometric Verification Industry Revenue (Million), by Application 2024 & 2032
- Figure 44: Asia Pacific Mobile Biometric Verification Industry Volume (K Unit), by Application 2024 & 2032
- Figure 45: Asia Pacific Mobile Biometric Verification Industry Revenue Share (%), by Application 2024 & 2032
- Figure 46: Asia Pacific Mobile Biometric Verification Industry Volume Share (%), by Application 2024 & 2032
- Figure 47: Asia Pacific Mobile Biometric Verification Industry Revenue (Million), by Country 2024 & 2032
- Figure 48: Asia Pacific Mobile Biometric Verification Industry Volume (K Unit), by Country 2024 & 2032
- Figure 49: Asia Pacific Mobile Biometric Verification Industry Revenue Share (%), by Country 2024 & 2032
- Figure 50: Asia Pacific Mobile Biometric Verification Industry Volume Share (%), by Country 2024 & 2032
- Figure 51: Rest of the World Mobile Biometric Verification Industry Revenue (Million), by Application 2024 & 2032
- Figure 52: Rest of the World Mobile Biometric Verification Industry Volume (K Unit), by Application 2024 & 2032
- Figure 53: Rest of the World Mobile Biometric Verification Industry Revenue Share (%), by Application 2024 & 2032
- Figure 54: Rest of the World Mobile Biometric Verification Industry Volume Share (%), by Application 2024 & 2032
- Figure 55: Rest of the World Mobile Biometric Verification Industry Revenue (Million), by Country 2024 & 2032
- Figure 56: Rest of the World Mobile Biometric Verification Industry Volume (K Unit), by Country 2024 & 2032
- Figure 57: Rest of the World Mobile Biometric Verification Industry Revenue Share (%), by Country 2024 & 2032
- Figure 58: Rest of the World Mobile Biometric Verification Industry Volume Share (%), by Country 2024 & 2032
List of Tables
- Table 1: Global Mobile Biometric Verification Industry Revenue Million Forecast, by Region 2019 & 2032
- Table 2: Global Mobile Biometric Verification Industry Volume K Unit Forecast, by Region 2019 & 2032
- Table 3: Global Mobile Biometric Verification Industry Revenue Million Forecast, by Application 2019 & 2032
- Table 4: Global Mobile Biometric Verification Industry Volume K Unit Forecast, by Application 2019 & 2032
- Table 5: Global Mobile Biometric Verification Industry Revenue Million Forecast, by Region 2019 & 2032
- Table 6: Global Mobile Biometric Verification Industry Volume K Unit Forecast, by Region 2019 & 2032
- Table 7: Global Mobile Biometric Verification Industry Revenue Million Forecast, by Country 2019 & 2032
- Table 8: Global Mobile Biometric Verification Industry Volume K Unit Forecast, by Country 2019 & 2032
- Table 9: United States Mobile Biometric Verification Industry Revenue (Million) Forecast, by Application 2019 & 2032
- Table 10: United States Mobile Biometric Verification Industry Volume (K Unit) Forecast, by Application 2019 & 2032
- Table 11: Canada Mobile Biometric Verification Industry Revenue (Million) Forecast, by Application 2019 & 2032
- Table 12: Canada Mobile Biometric Verification Industry Volume (K Unit) Forecast, by Application 2019 & 2032
- Table 13: Mexico Mobile Biometric Verification Industry Revenue (Million) Forecast, by Application 2019 & 2032
- Table 14: Mexico Mobile Biometric Verification Industry Volume (K Unit) Forecast, by Application 2019 & 2032
- Table 15: Global Mobile Biometric Verification Industry Revenue Million Forecast, by Country 2019 & 2032
- Table 16: Global Mobile Biometric Verification Industry Volume K Unit Forecast, by Country 2019 & 2032
- Table 17: Germany Mobile Biometric Verification Industry Revenue (Million) Forecast, by Application 2019 & 2032
- Table 18: Germany Mobile Biometric Verification Industry Volume (K Unit) Forecast, by Application 2019 & 2032
- Table 19: United Kingdom Mobile Biometric Verification Industry Revenue (Million) Forecast, by Application 2019 & 2032
- Table 20: United Kingdom Mobile Biometric Verification Industry Volume (K Unit) Forecast, by Application 2019 & 2032
- Table 21: France Mobile Biometric Verification Industry Revenue (Million) Forecast, by Application 2019 & 2032
- Table 22: France Mobile Biometric Verification Industry Volume (K Unit) Forecast, by Application 2019 & 2032
- Table 23: Spain Mobile Biometric Verification Industry Revenue (Million) Forecast, by Application 2019 & 2032
- Table 24: Spain Mobile Biometric Verification Industry Volume (K Unit) Forecast, by Application 2019 & 2032
- Table 25: Italy Mobile Biometric Verification Industry Revenue (Million) Forecast, by Application 2019 & 2032
- Table 26: Italy Mobile Biometric Verification Industry Volume (K Unit) Forecast, by Application 2019 & 2032
- Table 27: Spain Mobile Biometric Verification Industry Revenue (Million) Forecast, by Application 2019 & 2032
- Table 28: Spain Mobile Biometric Verification Industry Volume (K Unit) Forecast, by Application 2019 & 2032
- Table 29: Belgium Mobile Biometric Verification Industry Revenue (Million) Forecast, by Application 2019 & 2032
- Table 30: Belgium Mobile Biometric Verification Industry Volume (K Unit) Forecast, by Application 2019 & 2032
- Table 31: Netherland Mobile Biometric Verification Industry Revenue (Million) Forecast, by Application 2019 & 2032
- Table 32: Netherland Mobile Biometric Verification Industry Volume (K Unit) Forecast, by Application 2019 & 2032
- Table 33: Nordics Mobile Biometric Verification Industry Revenue (Million) Forecast, by Application 2019 & 2032
- Table 34: Nordics Mobile Biometric Verification Industry Volume (K Unit) Forecast, by Application 2019 & 2032
- Table 35: Rest of Europe Mobile Biometric Verification Industry Revenue (Million) Forecast, by Application 2019 & 2032
- Table 36: Rest of Europe Mobile Biometric Verification Industry Volume (K Unit) Forecast, by Application 2019 & 2032
- Table 37: Global Mobile Biometric Verification Industry Revenue Million Forecast, by Country 2019 & 2032
- Table 38: Global Mobile Biometric Verification Industry Volume K Unit Forecast, by Country 2019 & 2032
- Table 39: China Mobile Biometric Verification Industry Revenue (Million) Forecast, by Application 2019 & 2032
- Table 40: China Mobile Biometric Verification Industry Volume (K Unit) Forecast, by Application 2019 & 2032
- Table 41: Japan Mobile Biometric Verification Industry Revenue (Million) Forecast, by Application 2019 & 2032
- Table 42: Japan Mobile Biometric Verification Industry Volume (K Unit) Forecast, by Application 2019 & 2032
- Table 43: India Mobile Biometric Verification Industry Revenue (Million) Forecast, by Application 2019 & 2032
- Table 44: India Mobile Biometric Verification Industry Volume (K Unit) Forecast, by Application 2019 & 2032
- Table 45: South Korea Mobile Biometric Verification Industry Revenue (Million) Forecast, by Application 2019 & 2032
- Table 46: South Korea Mobile Biometric Verification Industry Volume (K Unit) Forecast, by Application 2019 & 2032
- Table 47: Southeast Asia Mobile Biometric Verification Industry Revenue (Million) Forecast, by Application 2019 & 2032
- Table 48: Southeast Asia Mobile Biometric Verification Industry Volume (K Unit) Forecast, by Application 2019 & 2032
- Table 49: Australia Mobile Biometric Verification Industry Revenue (Million) Forecast, by Application 2019 & 2032
- Table 50: Australia Mobile Biometric Verification Industry Volume (K Unit) Forecast, by Application 2019 & 2032
- Table 51: Indonesia Mobile Biometric Verification Industry Revenue (Million) Forecast, by Application 2019 & 2032
- Table 52: Indonesia Mobile Biometric Verification Industry Volume (K Unit) Forecast, by Application 2019 & 2032
- Table 53: Phillipes Mobile Biometric Verification Industry Revenue (Million) Forecast, by Application 2019 & 2032
- Table 54: Phillipes Mobile Biometric Verification Industry Volume (K Unit) Forecast, by Application 2019 & 2032
- Table 55: Singapore Mobile Biometric Verification Industry Revenue (Million) Forecast, by Application 2019 & 2032
- Table 56: Singapore Mobile Biometric Verification Industry Volume (K Unit) Forecast, by Application 2019 & 2032
- Table 57: Thailandc Mobile Biometric Verification Industry Revenue (Million) Forecast, by Application 2019 & 2032
- Table 58: Thailandc Mobile Biometric Verification Industry Volume (K Unit) Forecast, by Application 2019 & 2032
- Table 59: Rest of Asia Pacific Mobile Biometric Verification Industry Revenue (Million) Forecast, by Application 2019 & 2032
- Table 60: Rest of Asia Pacific Mobile Biometric Verification Industry Volume (K Unit) Forecast, by Application 2019 & 2032
- Table 61: Global Mobile Biometric Verification Industry Revenue Million Forecast, by Country 2019 & 2032
- Table 62: Global Mobile Biometric Verification Industry Volume K Unit Forecast, by Country 2019 & 2032
- Table 63: Brazil Mobile Biometric Verification Industry Revenue (Million) Forecast, by Application 2019 & 2032
- Table 64: Brazil Mobile Biometric Verification Industry Volume (K Unit) Forecast, by Application 2019 & 2032
- Table 65: Argentina Mobile Biometric Verification Industry Revenue (Million) Forecast, by Application 2019 & 2032
- Table 66: Argentina Mobile Biometric Verification Industry Volume (K Unit) Forecast, by Application 2019 & 2032
- Table 67: Peru Mobile Biometric Verification Industry Revenue (Million) Forecast, by Application 2019 & 2032
- Table 68: Peru Mobile Biometric Verification Industry Volume (K Unit) Forecast, by Application 2019 & 2032
- Table 69: Chile Mobile Biometric Verification Industry Revenue (Million) Forecast, by Application 2019 & 2032
- Table 70: Chile Mobile Biometric Verification Industry Volume (K Unit) Forecast, by Application 2019 & 2032
- Table 71: Colombia Mobile Biometric Verification Industry Revenue (Million) Forecast, by Application 2019 & 2032
- Table 72: Colombia Mobile Biometric Verification Industry Volume (K Unit) Forecast, by Application 2019 & 2032
- Table 73: Ecuador Mobile Biometric Verification Industry Revenue (Million) Forecast, by Application 2019 & 2032
- Table 74: Ecuador Mobile Biometric Verification Industry Volume (K Unit) Forecast, by Application 2019 & 2032
- Table 75: Venezuela Mobile Biometric Verification Industry Revenue (Million) Forecast, by Application 2019 & 2032
- Table 76: Venezuela Mobile Biometric Verification Industry Volume (K Unit) Forecast, by Application 2019 & 2032
- Table 77: Rest of South America Mobile Biometric Verification Industry Revenue (Million) Forecast, by Application 2019 & 2032
- Table 78: Rest of South America Mobile Biometric Verification Industry Volume (K Unit) Forecast, by Application 2019 & 2032
- Table 79: Global Mobile Biometric Verification Industry Revenue Million Forecast, by Country 2019 & 2032
- Table 80: Global Mobile Biometric Verification Industry Volume K Unit Forecast, by Country 2019 & 2032
- Table 81: United States Mobile Biometric Verification Industry Revenue (Million) Forecast, by Application 2019 & 2032
- Table 82: United States Mobile Biometric Verification Industry Volume (K Unit) Forecast, by Application 2019 & 2032
- Table 83: Canada Mobile Biometric Verification Industry Revenue (Million) Forecast, by Application 2019 & 2032
- Table 84: Canada Mobile Biometric Verification Industry Volume (K Unit) Forecast, by Application 2019 & 2032
- Table 85: Mexico Mobile Biometric Verification Industry Revenue (Million) Forecast, by Application 2019 & 2032
- Table 86: Mexico Mobile Biometric Verification Industry Volume (K Unit) Forecast, by Application 2019 & 2032
- Table 87: Global Mobile Biometric Verification Industry Revenue Million Forecast, by Country 2019 & 2032
- Table 88: Global Mobile Biometric Verification Industry Volume K Unit Forecast, by Country 2019 & 2032
- Table 89: United Arab Emirates Mobile Biometric Verification Industry Revenue (Million) Forecast, by Application 2019 & 2032
- Table 90: United Arab Emirates Mobile Biometric Verification Industry Volume (K Unit) Forecast, by Application 2019 & 2032
- Table 91: Saudi Arabia Mobile Biometric Verification Industry Revenue (Million) Forecast, by Application 2019 & 2032
- Table 92: Saudi Arabia Mobile Biometric Verification Industry Volume (K Unit) Forecast, by Application 2019 & 2032
- Table 93: South Africa Mobile Biometric Verification Industry Revenue (Million) Forecast, by Application 2019 & 2032
- Table 94: South Africa Mobile Biometric Verification Industry Volume (K Unit) Forecast, by Application 2019 & 2032
- Table 95: Rest of Middle East and Africa Mobile Biometric Verification Industry Revenue (Million) Forecast, by Application 2019 & 2032
- Table 96: Rest of Middle East and Africa Mobile Biometric Verification Industry Volume (K Unit) Forecast, by Application 2019 & 2032
- Table 97: Global Mobile Biometric Verification Industry Revenue Million Forecast, by Application 2019 & 2032
- Table 98: Global Mobile Biometric Verification Industry Volume K Unit Forecast, by Application 2019 & 2032
- Table 99: Global Mobile Biometric Verification Industry Revenue Million Forecast, by Country 2019 & 2032
- Table 100: Global Mobile Biometric Verification Industry Volume K Unit Forecast, by Country 2019 & 2032
- Table 101: United States Mobile Biometric Verification Industry Revenue (Million) Forecast, by Application 2019 & 2032
- Table 102: United States Mobile Biometric Verification Industry Volume (K Unit) Forecast, by Application 2019 & 2032
- Table 103: Canada Mobile Biometric Verification Industry Revenue (Million) Forecast, by Application 2019 & 2032
- Table 104: Canada Mobile Biometric Verification Industry Volume (K Unit) Forecast, by Application 2019 & 2032
- Table 105: Global Mobile Biometric Verification Industry Revenue Million Forecast, by Application 2019 & 2032
- Table 106: Global Mobile Biometric Verification Industry Volume K Unit Forecast, by Application 2019 & 2032
- Table 107: Global Mobile Biometric Verification Industry Revenue Million Forecast, by Country 2019 & 2032
- Table 108: Global Mobile Biometric Verification Industry Volume K Unit Forecast, by Country 2019 & 2032
- Table 109: United Kingdom Mobile Biometric Verification Industry Revenue (Million) Forecast, by Application 2019 & 2032
- Table 110: United Kingdom Mobile Biometric Verification Industry Volume (K Unit) Forecast, by Application 2019 & 2032
- Table 111: Germany Mobile Biometric Verification Industry Revenue (Million) Forecast, by Application 2019 & 2032
- Table 112: Germany Mobile Biometric Verification Industry Volume (K Unit) Forecast, by Application 2019 & 2032
- Table 113: France Mobile Biometric Verification Industry Revenue (Million) Forecast, by Application 2019 & 2032
- Table 114: France Mobile Biometric Verification Industry Volume (K Unit) Forecast, by Application 2019 & 2032
- Table 115: Italy Mobile Biometric Verification Industry Revenue (Million) Forecast, by Application 2019 & 2032
- Table 116: Italy Mobile Biometric Verification Industry Volume (K Unit) Forecast, by Application 2019 & 2032
- Table 117: Rest of Europe Mobile Biometric Verification Industry Revenue (Million) Forecast, by Application 2019 & 2032
- Table 118: Rest of Europe Mobile Biometric Verification Industry Volume (K Unit) Forecast, by Application 2019 & 2032
- Table 119: Global Mobile Biometric Verification Industry Revenue Million Forecast, by Application 2019 & 2032
- Table 120: Global Mobile Biometric Verification Industry Volume K Unit Forecast, by Application 2019 & 2032
- Table 121: Global Mobile Biometric Verification Industry Revenue Million Forecast, by Country 2019 & 2032
- Table 122: Global Mobile Biometric Verification Industry Volume K Unit Forecast, by Country 2019 & 2032
- Table 123: China Mobile Biometric Verification Industry Revenue (Million) Forecast, by Application 2019 & 2032
- Table 124: China Mobile Biometric Verification Industry Volume (K Unit) Forecast, by Application 2019 & 2032
- Table 125: Japan Mobile Biometric Verification Industry Revenue (Million) Forecast, by Application 2019 & 2032
- Table 126: Japan Mobile Biometric Verification Industry Volume (K Unit) Forecast, by Application 2019 & 2032
- Table 127: South Korea Mobile Biometric Verification Industry Revenue (Million) Forecast, by Application 2019 & 2032
- Table 128: South Korea Mobile Biometric Verification Industry Volume (K Unit) Forecast, by Application 2019 & 2032
- Table 129: India Mobile Biometric Verification Industry Revenue (Million) Forecast, by Application 2019 & 2032
- Table 130: India Mobile Biometric Verification Industry Volume (K Unit) Forecast, by Application 2019 & 2032
- Table 131: Global Mobile Biometric Verification Industry Revenue Million Forecast, by Application 2019 & 2032
- Table 132: Global Mobile Biometric Verification Industry Volume K Unit Forecast, by Application 2019 & 2032
- Table 133: Global Mobile Biometric Verification Industry Revenue Million Forecast, by Country 2019 & 2032
- Table 134: Global Mobile Biometric Verification Industry Volume K Unit Forecast, by Country 2019 & 2032
Frequently Asked Questions
1. What is the projected Compound Annual Growth Rate (CAGR) of the Mobile Biometric Verification Industry?
The projected CAGR is approximately 26.00%.
2. Which companies are prominent players in the Mobile Biometric Verification Industry?
Key companies in the market include Nuance Communications Inc, Precise Biometrics AB, M2SYS Technologies, Veridium Ltd, Mobbeel Solutions SLL, ValidSoft Limited, Aware Inc, VoiceVault Inc, Fingerprint Cards AB, IDEMIA (Safran Identity & Security SAS).
3. What are the main segments of the Mobile Biometric Verification Industry?
The market segments include Application.
4. Can you provide details about the market size?
The market size is estimated to be USD XX Million as of 2022.
5. What are some drivers contributing to market growth?
; Growing Popularity of Mobile Commerce; Increasing BYOD Security Requirement.
6. What are the notable trends driving market growth?
Mobile Banking is Expected to Hold a Significant Share.
7. Are there any restraints impacting market growth?
; Concerns About Data Privacy and Data Breach.
8. Can you provide examples of recent developments in the market?
N/A
9. What pricing options are available for accessing the report?
Pricing options include single-user, multi-user, and enterprise licenses priced at USD 4750, USD 5250, and USD 8750 respectively.
10. Is the market size provided in terms of value or volume?
The market size is provided in terms of value, measured in Million and volume, measured in K Unit.
11. Are there any specific market keywords associated with the report?
Yes, the market keyword associated with the report is "Mobile Biometric Verification Industry," which aids in identifying and referencing the specific market segment covered.
12. How do I determine which pricing option suits my needs best?
The pricing options vary based on user requirements and access needs. Individual users may opt for single-user licenses, while businesses requiring broader access may choose multi-user or enterprise licenses for cost-effective access to the report.
13. Are there any additional resources or data provided in the Mobile Biometric Verification Industry report?
While the report offers comprehensive insights, it's advisable to review the specific contents or supplementary materials provided to ascertain if additional resources or data are available.
14. How can I stay updated on further developments or reports in the Mobile Biometric Verification Industry?
To stay informed about further developments, trends, and reports in the Mobile Biometric Verification Industry, consider subscribing to industry newsletters, following relevant companies and organizations, or regularly checking reputable industry news sources and publications.
Methodology
Step 1 - Identification of Relevant Samples Size from Population Database


Step 2 - Approaches for Defining Global Market Size (Value, Volume* & Price*)

Note*: In applicable scenarios
Step 3 - Data Sources
Primary Research
- Web Analytics
- Survey Reports
- Research Institute
- Latest Research Reports
- Opinion Leaders
Secondary Research
- Annual Reports
- White Paper
- Latest Press Release
- Industry Association
- Paid Database
- Investor Presentations

Step 4 - Data Triangulation
Involves using different sources of information in order to increase the validity of a study
These sources are likely to be stakeholders in a program - participants, other researchers, program staff, other community members, and so on.
Then we put all data in single framework & apply various statistical tools to find out the dynamic on the market.
During the analysis stage, feedback from the stakeholder groups would be compared to determine areas of agreement as well as areas of divergence


