
Key Insights
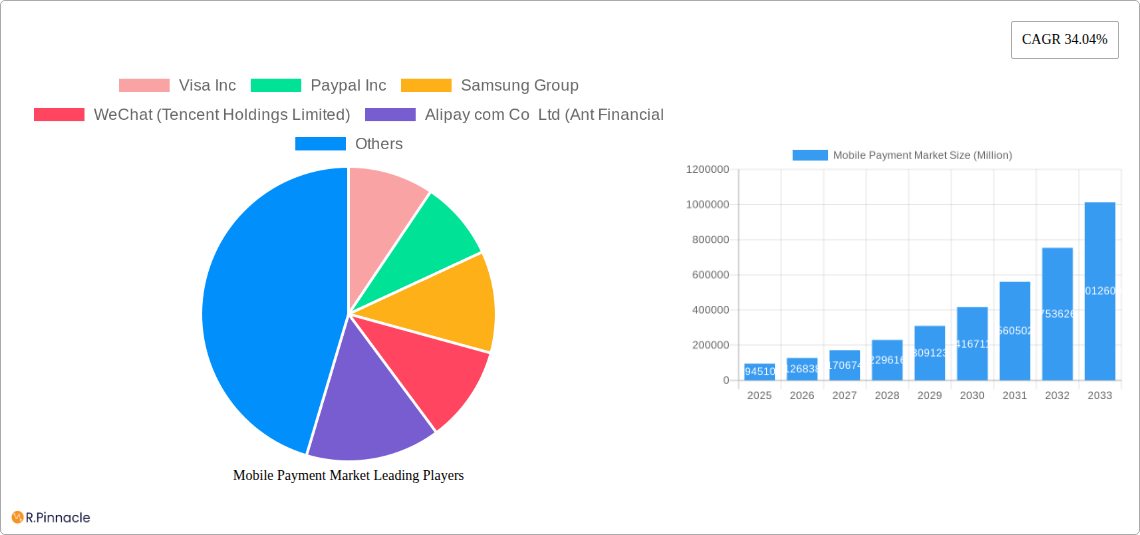
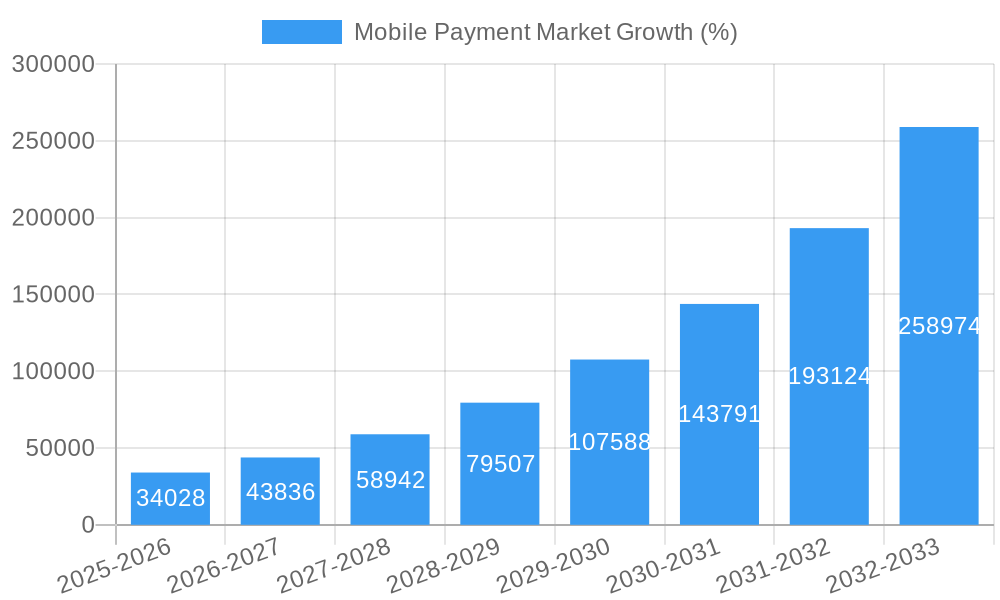
The global mobile payment market, valued at $94.51 billion in 2025, is projected to experience robust growth, driven by the increasing adoption of smartphones, rising e-commerce transactions, and the expanding global digital economy. The market's Compound Annual Growth Rate (CAGR) of 34.04% from 2025 to 2033 indicates significant future expansion. Key growth drivers include the convenience and security offered by contactless payment methods like NFC and QR codes, the widespread availability of mobile internet, and the continuous development of innovative payment technologies such as biometric authentication. Furthermore, the increasing penetration of mobile financial services, particularly in developing economies, fuels this expansion. The market is segmented by payment type, including NFC, QR-based, online digital payments, and text-based solutions, each contributing to the overall growth trajectory. Leading companies such as Visa, PayPal, and Alipay are strategically investing in technological advancements and global partnerships to capture market share within this dynamic landscape. Regional variations exist, with North America and Asia Pacific expected to remain dominant due to higher smartphone penetration and advanced digital infrastructure.
The restraints to growth are primarily associated with concerns regarding data security and privacy, alongside infrastructure limitations in certain regions and the digital literacy gap among some consumer demographics. However, the ongoing improvements in security protocols, increased consumer awareness, and sustained efforts to improve digital infrastructure are mitigating these challenges. The continuous innovation in mobile payment technology, coupled with the integration of artificial intelligence and machine learning for enhanced user experience and fraud prevention, further ensures the continued growth and evolution of the mobile payment market. The long-term forecast suggests substantial market expansion, fueled by the increasing integration of mobile payments into everyday life, and the emergence of new payment ecosystems and solutions.
Mobile Payment Market Report: A Comprehensive Analysis (2019-2033)
This in-depth report provides a comprehensive analysis of the global mobile payment market, covering market structure, dynamics, dominant segments, innovation trends, and future outlook. The study period spans from 2019 to 2033, with a base year of 2025 and a forecast period from 2025 to 2033. The report leverages extensive data and insights to provide actionable intelligence for industry professionals, investors, and strategic decision-makers. The global mobile payment market is projected to reach xx Million by 2033, exhibiting a significant CAGR of xx% during the forecast period.
Mobile Payment Market Structure & Innovation Trends
This section delves into the competitive landscape of the mobile payment market, examining market concentration, innovation drivers, regulatory landscapes, and key industry activities. We analyze the market share held by major players such as Visa Inc, PayPal Inc, and Alipay, among others, and quantify the impact of mergers and acquisitions (M&A) on market dynamics. The report also explores the influence of technological advancements, regulatory frameworks, and evolving consumer preferences on market structure.
- Market Concentration: The mobile payment market is characterized by a high degree of concentration, with a few dominant players holding significant market share. However, the market also features numerous smaller players, fostering intense competition. Market share data for key players (Visa, PayPal, Alipay, etc.) will be presented and analyzed.
- Innovation Drivers: Technological advancements, such as the rise of NFC, QR codes, and biometric authentication, are driving innovation and expansion in the mobile payments sector. Further analysis will explore specific examples of successful innovations and their contributions to market growth.
- Regulatory Frameworks: Government regulations and policies play a crucial role in shaping the mobile payment market. This section will examine the impact of different regulatory environments on market growth and competition.
- M&A Activities: The mobile payments landscape is dynamic, with considerable M&A activity shaping market structures. Our analysis includes specific examples of significant deals and their effects on market concentration and innovation. The total value of M&A deals during the historical period will be reported in Millions.
- Product Substitutes: The report investigates emerging payment technologies and their potential impact on the market share of traditional mobile payment methods.
- End-User Demographics: Consumer behavior and demographic trends significantly influence the adoption of mobile payment solutions. This section explores how different demographics adopt mobile payment technologies.
Mobile Payment Market Dynamics & Trends
This section analyzes the market dynamics and trends that shape the growth trajectory of the mobile payment market. We will explore key growth drivers such as increasing smartphone penetration, rising e-commerce adoption, and the expanding adoption of digital wallets. We will also discuss technological disruptions, including the introduction of new payment technologies and services that influence consumer preferences and competitive dynamics.
- Market Growth Drivers: The report identifies and analyzes key factors driving market growth, including rising smartphone penetration, increased e-commerce transactions, and expanding digital financial inclusion.
- Technological Disruptions: The adoption of new technologies, such as blockchain, AI, and improved security features, will be explored in detail with impacts on market expansion.
- Consumer Preferences: Shifting consumer preferences toward seamless and secure payment solutions, along with their increasing comfort level with digital transactions, will be investigated.
- Competitive Dynamics: The competitive landscape is analyzed, examining strategies employed by key market participants, including partnerships, collaborations, and expansion into new markets.
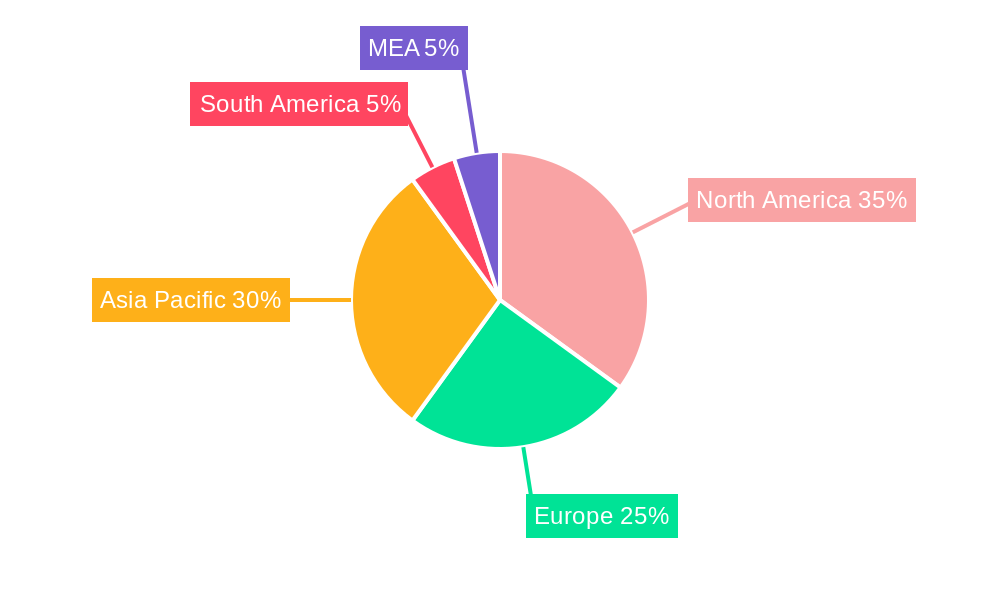
Dominant Regions & Segments in Mobile Payment Market
This section identifies the leading regions and segments within the mobile payment market based on Payment Type (Proximity & Remote). We examine the drivers for this dominance, including economic policies, infrastructure development, and consumer behavior. A detailed analysis will explore why certain regions or payment types outperform others.
Dominant Regions: The report pinpoints the leading regions based on market size and growth rate. The analysis highlights specific factors driving the growth in these regions.
Dominant Segments (by Payment Type): The report analyzes market share, growth trends, and key influencers for each payment type:
NFC (Near Field Communication): Market size, growth rate, and key market drivers for NFC payments are discussed.
QR-based Payments: Analysis of the market dynamics, growth potential, and competitive landscape of QR-based mobile payments.
Online Digital Payments: Growth trends, key players, and market share within the online digital payment segment are discussed.
Text-based Payments: Market analysis of text-based payments, including challenges and future prospects.
Other Payment Types (MST, etc.): Overview of other emerging payment technologies, their adoption rates, and future potential.
Each segment's breakdown includes an overview, trends, percentage breakdown, growth influencers, and market outlook.
Mobile Payment Market Product Innovations
This section focuses on recent product developments, their applications, and the competitive advantages they offer. We highlight technological trends and assess their market fit.
- The report showcases leading innovations in mobile payment technologies, highlighting their functionalities and market impact. It includes an assessment of their competitive advantages and future prospects.
Report Scope & Segmentation Analysis
This section details the market segmentation by payment type (Proximity & Remote) and provides growth projections, market sizes, and competitive dynamics for each segment.
- By Payment Type: The report meticulously outlines each payment type, including NFC, QR-based, online digital payments, text-based payments, and other payment types. Growth projections, market size estimates, and competitive analysis are provided for each segment.
Key Drivers of Mobile Payment Market Growth
This section outlines the key technological, economic, and regulatory factors that fuel the growth of the mobile payment market, providing specific examples.
- The primary drivers for growth in the mobile payments market are highlighted with supporting details.
Challenges in the Mobile Payment Sector
This section discusses the barriers and restraints faced by the mobile payment market, including regulatory hurdles, security concerns, and competitive pressures, with quantifiable impacts.
- Key challenges confronting the mobile payments sector are explored. These include technological limitations, regulatory hurdles, security issues, and competitive pressures.
Emerging Opportunities in Mobile Payment Market
This section highlights emerging trends and opportunities for growth in the mobile payment market, including new technologies and consumer preferences.
- This section explores promising opportunities that will shape the mobile payment landscape in the coming years.
Leading Players in the Mobile Payment Market
- Visa Inc
- Paypal Inc
- Samsung Group
- WeChat (Tencent Holdings Limited)
- Alipay com Co Ltd (Ant Financial)
- Comviva Technologies Limited (A Tech Mahindra Company)
- Google LLC (Alphabet Inc)
- Amazon com Inc
- Apple Inc
- Mastercard PLC
- American Express Co
Key Developments in Mobile Payment Market Industry
- April 2023: Visa partners with PayPal and Venmo to pilot Visa+, enhancing P2P payment interoperability.
- March 2023: PayPal introduces passkeys for enhanced account security on iOS and Android devices.
Future Outlook for Mobile Payment Market
This section summarizes the growth accelerators, highlighting the future market potential and strategic opportunities within the mobile payment sector.
- The section provides an outlook for the future of the mobile payment industry, discussing factors that are expected to drive further growth and expansion in the market.
Mobile Payment Market Segmentation
-
1. Payment Type
- 1.1. NFC
- 1.2. QR-based
- 1.3. Online digital payments
- 1.4. Text-based
- 1.5. Other Payment Types (MST, etc.)
Mobile Payment Market Segmentation By Geography
- 1. North America
- 2. Europe
- 3. Asia
- 4. Australia and New Zealand
- 5. Latin America
- 6. Middle East and Africa
Mobile Payment Market REPORT HIGHLIGHTS
| Aspects | Details |
|---|---|
| Study Period | 2019-2033 |
| Base Year | 2024 |
| Estimated Year | 2025 |
| Forecast Period | 2025-2033 |
| Historical Period | 2019-2024 |
| Growth Rate | CAGR of 34.04% from 2019-2033 |
| Segmentation |
|
Table of Contents
- 1. Introduction
- 1.1. Research Scope
- 1.2. Market Segmentation
- 1.3. Research Methodology
- 1.4. Definitions and Assumptions
- 2. Executive Summary
- 2.1. Introduction
- 3. Market Dynamics
- 3.1. Introduction
- 3.2. Market Drivers
- 3.2.1. Increasing Internet Penetration and Growing M-commerce Market; Increasing Number of Loyalty Benefits in Mobile Environment
- 3.3. Market Restrains
- 3.3.1. Incremental Advancements in Smartphones
- 3.4. Market Trends
- 3.4.1. Increasing Internet Penetration and Growing M-commerce Market To Drive the Market Growth
- 4. Market Factor Analysis
- 4.1. Porters Five Forces
- 4.2. Supply/Value Chain
- 4.3. PESTEL analysis
- 4.4. Market Entropy
- 4.5. Patent/Trademark Analysis
- 5. Global Mobile Payment Market Analysis, Insights and Forecast, 2019-2031
- 5.1. Market Analysis, Insights and Forecast - by Payment Type
- 5.1.1. NFC
- 5.1.2. QR-based
- 5.1.3. Online digital payments
- 5.1.4. Text-based
- 5.1.5. Other Payment Types (MST, etc.)
- 5.2. Market Analysis, Insights and Forecast - by Region
- 5.2.1. North America
- 5.2.2. Europe
- 5.2.3. Asia
- 5.2.4. Australia and New Zealand
- 5.2.5. Latin America
- 5.2.6. Middle East and Africa
- 5.1. Market Analysis, Insights and Forecast - by Payment Type
- 6. North America Mobile Payment Market Analysis, Insights and Forecast, 2019-2031
- 6.1. Market Analysis, Insights and Forecast - by Payment Type
- 6.1.1. NFC
- 6.1.2. QR-based
- 6.1.3. Online digital payments
- 6.1.4. Text-based
- 6.1.5. Other Payment Types (MST, etc.)
- 6.1. Market Analysis, Insights and Forecast - by Payment Type
- 7. Europe Mobile Payment Market Analysis, Insights and Forecast, 2019-2031
- 7.1. Market Analysis, Insights and Forecast - by Payment Type
- 7.1.1. NFC
- 7.1.2. QR-based
- 7.1.3. Online digital payments
- 7.1.4. Text-based
- 7.1.5. Other Payment Types (MST, etc.)
- 7.1. Market Analysis, Insights and Forecast - by Payment Type
- 8. Asia Mobile Payment Market Analysis, Insights and Forecast, 2019-2031
- 8.1. Market Analysis, Insights and Forecast - by Payment Type
- 8.1.1. NFC
- 8.1.2. QR-based
- 8.1.3. Online digital payments
- 8.1.4. Text-based
- 8.1.5. Other Payment Types (MST, etc.)
- 8.1. Market Analysis, Insights and Forecast - by Payment Type
- 9. Australia and New Zealand Mobile Payment Market Analysis, Insights and Forecast, 2019-2031
- 9.1. Market Analysis, Insights and Forecast - by Payment Type
- 9.1.1. NFC
- 9.1.2. QR-based
- 9.1.3. Online digital payments
- 9.1.4. Text-based
- 9.1.5. Other Payment Types (MST, etc.)
- 9.1. Market Analysis, Insights and Forecast - by Payment Type
- 10. Latin America Mobile Payment Market Analysis, Insights and Forecast, 2019-2031
- 10.1. Market Analysis, Insights and Forecast - by Payment Type
- 10.1.1. NFC
- 10.1.2. QR-based
- 10.1.3. Online digital payments
- 10.1.4. Text-based
- 10.1.5. Other Payment Types (MST, etc.)
- 10.1. Market Analysis, Insights and Forecast - by Payment Type
- 11. Middle East and Africa Mobile Payment Market Analysis, Insights and Forecast, 2019-2031
- 11.1. Market Analysis, Insights and Forecast - by Payment Type
- 11.1.1. NFC
- 11.1.2. QR-based
- 11.1.3. Online digital payments
- 11.1.4. Text-based
- 11.1.5. Other Payment Types (MST, etc.)
- 11.1. Market Analysis, Insights and Forecast - by Payment Type
- 12. North America Mobile Payment Market Analysis, Insights and Forecast, 2019-2031
- 12.1. Market Analysis, Insights and Forecast - By Country/Sub-region
- 12.1.1 United States
- 12.1.2 Canada
- 12.1.3 Mexico
- 13. Europe Mobile Payment Market Analysis, Insights and Forecast, 2019-2031
- 13.1. Market Analysis, Insights and Forecast - By Country/Sub-region
- 13.1.1 Germany
- 13.1.2 United Kingdom
- 13.1.3 France
- 13.1.4 Spain
- 13.1.5 Italy
- 13.1.6 Spain
- 13.1.7 Belgium
- 13.1.8 Netherland
- 13.1.9 Nordics
- 13.1.10 Rest of Europe
- 14. Asia Pacific Mobile Payment Market Analysis, Insights and Forecast, 2019-2031
- 14.1. Market Analysis, Insights and Forecast - By Country/Sub-region
- 14.1.1 China
- 14.1.2 Japan
- 14.1.3 India
- 14.1.4 South Korea
- 14.1.5 Southeast Asia
- 14.1.6 Australia
- 14.1.7 Indonesia
- 14.1.8 Phillipes
- 14.1.9 Singapore
- 14.1.10 Thailandc
- 14.1.11 Rest of Asia Pacific
- 15. South America Mobile Payment Market Analysis, Insights and Forecast, 2019-2031
- 15.1. Market Analysis, Insights and Forecast - By Country/Sub-region
- 15.1.1 Brazil
- 15.1.2 Argentina
- 15.1.3 Peru
- 15.1.4 Chile
- 15.1.5 Colombia
- 15.1.6 Ecuador
- 15.1.7 Venezuela
- 15.1.8 Rest of South America
- 16. North America Mobile Payment Market Analysis, Insights and Forecast, 2019-2031
- 16.1. Market Analysis, Insights and Forecast - By Country/Sub-region
- 16.1.1 United States
- 16.1.2 Canada
- 16.1.3 Mexico
- 17. MEA Mobile Payment Market Analysis, Insights and Forecast, 2019-2031
- 17.1. Market Analysis, Insights and Forecast - By Country/Sub-region
- 17.1.1 United Arab Emirates
- 17.1.2 Saudi Arabia
- 17.1.3 South Africa
- 17.1.4 Rest of Middle East and Africa
- 18. Competitive Analysis
- 18.1. Global Market Share Analysis 2024
- 18.2. Company Profiles
- 18.2.1 Visa Inc
- 18.2.1.1. Overview
- 18.2.1.2. Products
- 18.2.1.3. SWOT Analysis
- 18.2.1.4. Recent Developments
- 18.2.1.5. Financials (Based on Availability)
- 18.2.2 Paypal Inc
- 18.2.2.1. Overview
- 18.2.2.2. Products
- 18.2.2.3. SWOT Analysis
- 18.2.2.4. Recent Developments
- 18.2.2.5. Financials (Based on Availability)
- 18.2.3 Samsung Group
- 18.2.3.1. Overview
- 18.2.3.2. Products
- 18.2.3.3. SWOT Analysis
- 18.2.3.4. Recent Developments
- 18.2.3.5. Financials (Based on Availability)
- 18.2.4 WeChat (Tencent Holdings Limited)
- 18.2.4.1. Overview
- 18.2.4.2. Products
- 18.2.4.3. SWOT Analysis
- 18.2.4.4. Recent Developments
- 18.2.4.5. Financials (Based on Availability)
- 18.2.5 Alipay com Co Ltd (Ant Financial
- 18.2.5.1. Overview
- 18.2.5.2. Products
- 18.2.5.3. SWOT Analysis
- 18.2.5.4. Recent Developments
- 18.2.5.5. Financials (Based on Availability)
- 18.2.6 Comviva Technologies Limited (A Tech Mahindra Company)
- 18.2.6.1. Overview
- 18.2.6.2. Products
- 18.2.6.3. SWOT Analysis
- 18.2.6.4. Recent Developments
- 18.2.6.5. Financials (Based on Availability)
- 18.2.7 Google LLC (Alphabet Inc )
- 18.2.7.1. Overview
- 18.2.7.2. Products
- 18.2.7.3. SWOT Analysis
- 18.2.7.4. Recent Developments
- 18.2.7.5. Financials (Based on Availability)
- 18.2.8 Amazon com Inc
- 18.2.8.1. Overview
- 18.2.8.2. Products
- 18.2.8.3. SWOT Analysis
- 18.2.8.4. Recent Developments
- 18.2.8.5. Financials (Based on Availability)
- 18.2.9 Apple Inc
- 18.2.9.1. Overview
- 18.2.9.2. Products
- 18.2.9.3. SWOT Analysis
- 18.2.9.4. Recent Developments
- 18.2.9.5. Financials (Based on Availability)
- 18.2.10 Mastercard PLC
- 18.2.10.1. Overview
- 18.2.10.2. Products
- 18.2.10.3. SWOT Analysis
- 18.2.10.4. Recent Developments
- 18.2.10.5. Financials (Based on Availability)
- 18.2.11 American Express Co
- 18.2.11.1. Overview
- 18.2.11.2. Products
- 18.2.11.3. SWOT Analysis
- 18.2.11.4. Recent Developments
- 18.2.11.5. Financials (Based on Availability)
- 18.2.1 Visa Inc
List of Figures
- Figure 1: Global Mobile Payment Market Revenue Breakdown (Million, %) by Region 2024 & 2032
- Figure 2: North America Mobile Payment Market Revenue (Million), by Country 2024 & 2032
- Figure 3: North America Mobile Payment Market Revenue Share (%), by Country 2024 & 2032
- Figure 4: Europe Mobile Payment Market Revenue (Million), by Country 2024 & 2032
- Figure 5: Europe Mobile Payment Market Revenue Share (%), by Country 2024 & 2032
- Figure 6: Asia Pacific Mobile Payment Market Revenue (Million), by Country 2024 & 2032
- Figure 7: Asia Pacific Mobile Payment Market Revenue Share (%), by Country 2024 & 2032
- Figure 8: South America Mobile Payment Market Revenue (Million), by Country 2024 & 2032
- Figure 9: South America Mobile Payment Market Revenue Share (%), by Country 2024 & 2032
- Figure 10: North America Mobile Payment Market Revenue (Million), by Country 2024 & 2032
- Figure 11: North America Mobile Payment Market Revenue Share (%), by Country 2024 & 2032
- Figure 12: MEA Mobile Payment Market Revenue (Million), by Country 2024 & 2032
- Figure 13: MEA Mobile Payment Market Revenue Share (%), by Country 2024 & 2032
- Figure 14: North America Mobile Payment Market Revenue (Million), by Payment Type 2024 & 2032
- Figure 15: North America Mobile Payment Market Revenue Share (%), by Payment Type 2024 & 2032
- Figure 16: North America Mobile Payment Market Revenue (Million), by Country 2024 & 2032
- Figure 17: North America Mobile Payment Market Revenue Share (%), by Country 2024 & 2032
- Figure 18: Europe Mobile Payment Market Revenue (Million), by Payment Type 2024 & 2032
- Figure 19: Europe Mobile Payment Market Revenue Share (%), by Payment Type 2024 & 2032
- Figure 20: Europe Mobile Payment Market Revenue (Million), by Country 2024 & 2032
- Figure 21: Europe Mobile Payment Market Revenue Share (%), by Country 2024 & 2032
- Figure 22: Asia Mobile Payment Market Revenue (Million), by Payment Type 2024 & 2032
- Figure 23: Asia Mobile Payment Market Revenue Share (%), by Payment Type 2024 & 2032
- Figure 24: Asia Mobile Payment Market Revenue (Million), by Country 2024 & 2032
- Figure 25: Asia Mobile Payment Market Revenue Share (%), by Country 2024 & 2032
- Figure 26: Australia and New Zealand Mobile Payment Market Revenue (Million), by Payment Type 2024 & 2032
- Figure 27: Australia and New Zealand Mobile Payment Market Revenue Share (%), by Payment Type 2024 & 2032
- Figure 28: Australia and New Zealand Mobile Payment Market Revenue (Million), by Country 2024 & 2032
- Figure 29: Australia and New Zealand Mobile Payment Market Revenue Share (%), by Country 2024 & 2032
- Figure 30: Latin America Mobile Payment Market Revenue (Million), by Payment Type 2024 & 2032
- Figure 31: Latin America Mobile Payment Market Revenue Share (%), by Payment Type 2024 & 2032
- Figure 32: Latin America Mobile Payment Market Revenue (Million), by Country 2024 & 2032
- Figure 33: Latin America Mobile Payment Market Revenue Share (%), by Country 2024 & 2032
- Figure 34: Middle East and Africa Mobile Payment Market Revenue (Million), by Payment Type 2024 & 2032
- Figure 35: Middle East and Africa Mobile Payment Market Revenue Share (%), by Payment Type 2024 & 2032
- Figure 36: Middle East and Africa Mobile Payment Market Revenue (Million), by Country 2024 & 2032
- Figure 37: Middle East and Africa Mobile Payment Market Revenue Share (%), by Country 2024 & 2032
List of Tables
- Table 1: Global Mobile Payment Market Revenue Million Forecast, by Region 2019 & 2032
- Table 2: Global Mobile Payment Market Revenue Million Forecast, by Payment Type 2019 & 2032
- Table 3: Global Mobile Payment Market Revenue Million Forecast, by Region 2019 & 2032
- Table 4: Global Mobile Payment Market Revenue Million Forecast, by Country 2019 & 2032
- Table 5: United States Mobile Payment Market Revenue (Million) Forecast, by Application 2019 & 2032
- Table 6: Canada Mobile Payment Market Revenue (Million) Forecast, by Application 2019 & 2032
- Table 7: Mexico Mobile Payment Market Revenue (Million) Forecast, by Application 2019 & 2032
- Table 8: Global Mobile Payment Market Revenue Million Forecast, by Country 2019 & 2032
- Table 9: Germany Mobile Payment Market Revenue (Million) Forecast, by Application 2019 & 2032
- Table 10: United Kingdom Mobile Payment Market Revenue (Million) Forecast, by Application 2019 & 2032
- Table 11: France Mobile Payment Market Revenue (Million) Forecast, by Application 2019 & 2032
- Table 12: Spain Mobile Payment Market Revenue (Million) Forecast, by Application 2019 & 2032
- Table 13: Italy Mobile Payment Market Revenue (Million) Forecast, by Application 2019 & 2032
- Table 14: Spain Mobile Payment Market Revenue (Million) Forecast, by Application 2019 & 2032
- Table 15: Belgium Mobile Payment Market Revenue (Million) Forecast, by Application 2019 & 2032
- Table 16: Netherland Mobile Payment Market Revenue (Million) Forecast, by Application 2019 & 2032
- Table 17: Nordics Mobile Payment Market Revenue (Million) Forecast, by Application 2019 & 2032
- Table 18: Rest of Europe Mobile Payment Market Revenue (Million) Forecast, by Application 2019 & 2032
- Table 19: Global Mobile Payment Market Revenue Million Forecast, by Country 2019 & 2032
- Table 20: China Mobile Payment Market Revenue (Million) Forecast, by Application 2019 & 2032
- Table 21: Japan Mobile Payment Market Revenue (Million) Forecast, by Application 2019 & 2032
- Table 22: India Mobile Payment Market Revenue (Million) Forecast, by Application 2019 & 2032
- Table 23: South Korea Mobile Payment Market Revenue (Million) Forecast, by Application 2019 & 2032
- Table 24: Southeast Asia Mobile Payment Market Revenue (Million) Forecast, by Application 2019 & 2032
- Table 25: Australia Mobile Payment Market Revenue (Million) Forecast, by Application 2019 & 2032
- Table 26: Indonesia Mobile Payment Market Revenue (Million) Forecast, by Application 2019 & 2032
- Table 27: Phillipes Mobile Payment Market Revenue (Million) Forecast, by Application 2019 & 2032
- Table 28: Singapore Mobile Payment Market Revenue (Million) Forecast, by Application 2019 & 2032
- Table 29: Thailandc Mobile Payment Market Revenue (Million) Forecast, by Application 2019 & 2032
- Table 30: Rest of Asia Pacific Mobile Payment Market Revenue (Million) Forecast, by Application 2019 & 2032
- Table 31: Global Mobile Payment Market Revenue Million Forecast, by Country 2019 & 2032
- Table 32: Brazil Mobile Payment Market Revenue (Million) Forecast, by Application 2019 & 2032
- Table 33: Argentina Mobile Payment Market Revenue (Million) Forecast, by Application 2019 & 2032
- Table 34: Peru Mobile Payment Market Revenue (Million) Forecast, by Application 2019 & 2032
- Table 35: Chile Mobile Payment Market Revenue (Million) Forecast, by Application 2019 & 2032
- Table 36: Colombia Mobile Payment Market Revenue (Million) Forecast, by Application 2019 & 2032
- Table 37: Ecuador Mobile Payment Market Revenue (Million) Forecast, by Application 2019 & 2032
- Table 38: Venezuela Mobile Payment Market Revenue (Million) Forecast, by Application 2019 & 2032
- Table 39: Rest of South America Mobile Payment Market Revenue (Million) Forecast, by Application 2019 & 2032
- Table 40: Global Mobile Payment Market Revenue Million Forecast, by Country 2019 & 2032
- Table 41: United States Mobile Payment Market Revenue (Million) Forecast, by Application 2019 & 2032
- Table 42: Canada Mobile Payment Market Revenue (Million) Forecast, by Application 2019 & 2032
- Table 43: Mexico Mobile Payment Market Revenue (Million) Forecast, by Application 2019 & 2032
- Table 44: Global Mobile Payment Market Revenue Million Forecast, by Country 2019 & 2032
- Table 45: United Arab Emirates Mobile Payment Market Revenue (Million) Forecast, by Application 2019 & 2032
- Table 46: Saudi Arabia Mobile Payment Market Revenue (Million) Forecast, by Application 2019 & 2032
- Table 47: South Africa Mobile Payment Market Revenue (Million) Forecast, by Application 2019 & 2032
- Table 48: Rest of Middle East and Africa Mobile Payment Market Revenue (Million) Forecast, by Application 2019 & 2032
- Table 49: Global Mobile Payment Market Revenue Million Forecast, by Payment Type 2019 & 2032
- Table 50: Global Mobile Payment Market Revenue Million Forecast, by Country 2019 & 2032
- Table 51: Global Mobile Payment Market Revenue Million Forecast, by Payment Type 2019 & 2032
- Table 52: Global Mobile Payment Market Revenue Million Forecast, by Country 2019 & 2032
- Table 53: Global Mobile Payment Market Revenue Million Forecast, by Payment Type 2019 & 2032
- Table 54: Global Mobile Payment Market Revenue Million Forecast, by Country 2019 & 2032
- Table 55: Global Mobile Payment Market Revenue Million Forecast, by Payment Type 2019 & 2032
- Table 56: Global Mobile Payment Market Revenue Million Forecast, by Country 2019 & 2032
- Table 57: Global Mobile Payment Market Revenue Million Forecast, by Payment Type 2019 & 2032
- Table 58: Global Mobile Payment Market Revenue Million Forecast, by Country 2019 & 2032
- Table 59: Global Mobile Payment Market Revenue Million Forecast, by Payment Type 2019 & 2032
- Table 60: Global Mobile Payment Market Revenue Million Forecast, by Country 2019 & 2032
Frequently Asked Questions
1. What is the projected Compound Annual Growth Rate (CAGR) of the Mobile Payment Market?
The projected CAGR is approximately 34.04%.
2. Which companies are prominent players in the Mobile Payment Market?
Key companies in the market include Visa Inc, Paypal Inc, Samsung Group, WeChat (Tencent Holdings Limited), Alipay com Co Ltd (Ant Financial, Comviva Technologies Limited (A Tech Mahindra Company), Google LLC (Alphabet Inc ), Amazon com Inc, Apple Inc, Mastercard PLC, American Express Co.
3. What are the main segments of the Mobile Payment Market?
The market segments include Payment Type.
4. Can you provide details about the market size?
The market size is estimated to be USD 94.51 Million as of 2022.
5. What are some drivers contributing to market growth?
Increasing Internet Penetration and Growing M-commerce Market; Increasing Number of Loyalty Benefits in Mobile Environment.
6. What are the notable trends driving market growth?
Increasing Internet Penetration and Growing M-commerce Market To Drive the Market Growth.
7. Are there any restraints impacting market growth?
Incremental Advancements in Smartphones.
8. Can you provide examples of recent developments in the market?
April 2023 - Visa has announced it's partnering with PayPal and Venmo to pilot Visa+. This innovative service aims to help individuals move money quickly and securely between different person-to-person (P2P) digital payment apps. Through this collaboration, Visa+ will expand its reach and enable more use cases, including gig, creator, and marketplace payouts. Participating digital wallets, neo-banks, and other payment apps reaching millions of US users will be able to enable interoperability through Visa+.
9. What pricing options are available for accessing the report?
Pricing options include single-user, multi-user, and enterprise licenses priced at USD 4750, USD 5250, and USD 8750 respectively.
10. Is the market size provided in terms of value or volume?
The market size is provided in terms of value, measured in Million.
11. Are there any specific market keywords associated with the report?
Yes, the market keyword associated with the report is "Mobile Payment Market," which aids in identifying and referencing the specific market segment covered.
12. How do I determine which pricing option suits my needs best?
The pricing options vary based on user requirements and access needs. Individual users may opt for single-user licenses, while businesses requiring broader access may choose multi-user or enterprise licenses for cost-effective access to the report.
13. Are there any additional resources or data provided in the Mobile Payment Market report?
While the report offers comprehensive insights, it's advisable to review the specific contents or supplementary materials provided to ascertain if additional resources or data are available.
14. How can I stay updated on further developments or reports in the Mobile Payment Market?
To stay informed about further developments, trends, and reports in the Mobile Payment Market, consider subscribing to industry newsletters, following relevant companies and organizations, or regularly checking reputable industry news sources and publications.
Methodology
Step 1 - Identification of Relevant Samples Size from Population Database


Step 2 - Approaches for Defining Global Market Size (Value, Volume* & Price*)

Note*: In applicable scenarios
Step 3 - Data Sources
Primary Research
- Web Analytics
- Survey Reports
- Research Institute
- Latest Research Reports
- Opinion Leaders
Secondary Research
- Annual Reports
- White Paper
- Latest Press Release
- Industry Association
- Paid Database
- Investor Presentations

Step 4 - Data Triangulation
Involves using different sources of information in order to increase the validity of a study
These sources are likely to be stakeholders in a program - participants, other researchers, program staff, other community members, and so on.
Then we put all data in single framework & apply various statistical tools to find out the dynamic on the market.
During the analysis stage, feedback from the stakeholder groups would be compared to determine areas of agreement as well as areas of divergence


