
Key Insights
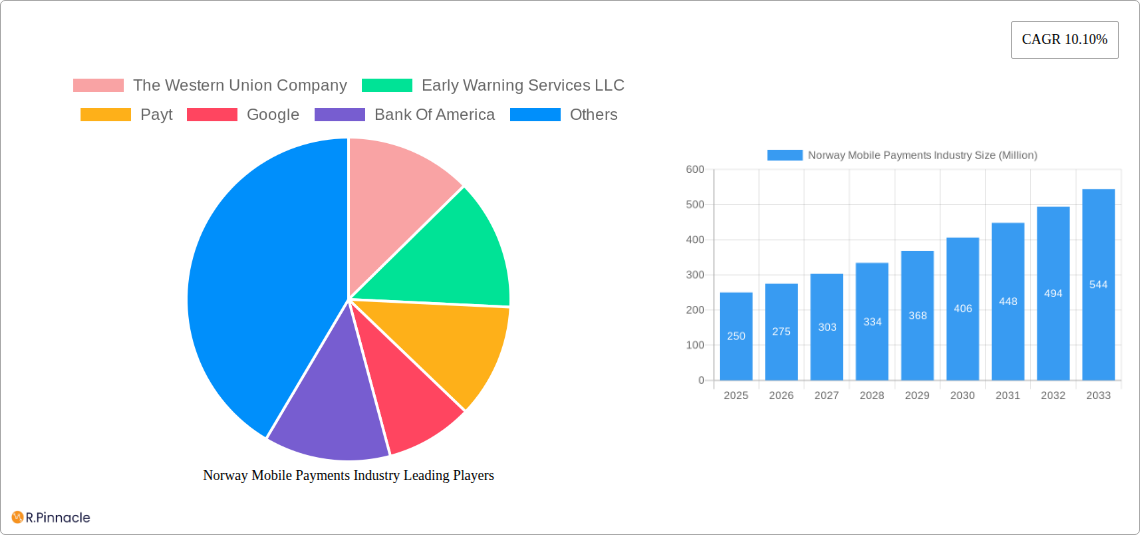
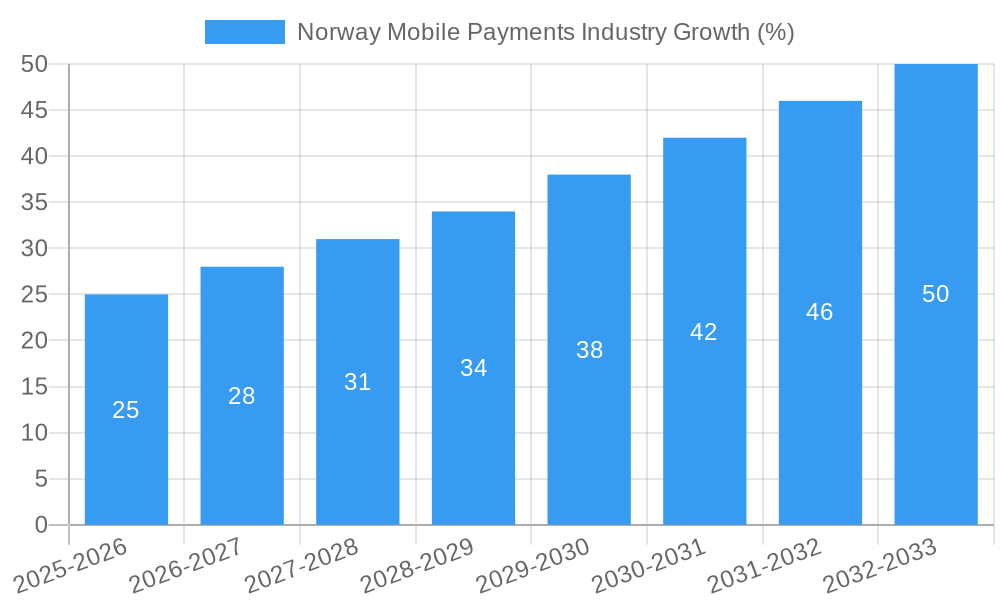
The Norwegian mobile payments market, valued at approximately 250 million in 2025, is projected to experience robust growth, driven by increasing smartphone penetration, rising digital literacy, and a burgeoning e-commerce sector. The market's Compound Annual Growth Rate (CAGR) of 10.1% from 2025 to 2033 indicates significant expansion potential. Key growth drivers include the expanding adoption of contactless payment technologies like NFC and QR codes, fueled by government initiatives promoting digitalization and the convenience offered by mobile wallets. The increasing popularity of mobile banking applications further contributes to this upward trajectory, enhancing the ease and security of transactions. While data privacy concerns and infrastructure limitations could potentially pose challenges, the overall market outlook remains positive. The segment breakdown reveals significant growth in proximity payments, driven by the rapid acceptance of NFC technology in retail and transportation. Remote payment solutions, especially those facilitated by banking apps, are expected to witness substantial growth owing to their accessibility and increased security features. Major players like PayPal, Apple Pay, and potentially local banking institutions are well-positioned to capitalize on these opportunities.
Growth within specific end-user segments like retail and healthcare are anticipated to outpace others, mirroring broader global trends. Retailers are increasingly integrating mobile payment solutions to streamline checkout processes and enhance customer experience, while healthcare providers are adopting mobile payments for improved billing and patient convenience. The energy and utilities sector is also poised for growth, with mobile payment facilitating efficient bill payments. While the precise market share for each segment and company is unavailable, competitive intensity is expected to increase as existing players expand their offerings and new entrants emerge seeking to tap into this thriving market. The forecast period of 2025-2033 promises continued expansion as mobile payments become further ingrained in the daily lives of Norwegians. The continued development of secure and user-friendly mobile payment platforms will be crucial to maintain this growth trajectory.
Norway Mobile Payments Industry: Market Report 2019-2033
This comprehensive report provides an in-depth analysis of the Norway mobile payments industry, offering invaluable insights for industry professionals, investors, and strategic planners. Covering the period 2019-2033, with a focus on 2025, this report unveils the market's structure, dynamics, and future potential. The report leverages extensive data analysis and industry expertise to deliver actionable intelligence, enabling informed decision-making in this rapidly evolving landscape.
Norway Mobile Payments Industry Market Structure & Innovation Trends
This section analyzes the competitive landscape of Norway's mobile payment market, examining market concentration, innovation drivers, regulatory frameworks, and M&A activities from 2019 to 2024. The Norwegian mobile payments market exhibits a [xx]% market concentration, with [xx] major players holding a significant share. Innovation is driven primarily by the increasing adoption of smartphones and the government's push for digitalization. The regulatory framework, while generally supportive, presents some challenges regarding data privacy and security. Product substitutes, such as traditional cash and card payments, continue to compete, but their market share is steadily declining. The end-user demographic is largely skewed towards the younger population, with high smartphone penetration driving adoption. M&A activity in the period 2019-2024 reached an estimated value of xx Million, indicating significant consolidation and strategic investments within the sector.
- Market Share: [Insert data on market share of key players – e.g., Vipps holds xx%, etc. If unavailable, use estimated percentages]
- M&A Deal Values: xx Million (2019-2024)
- Key Players: Vipps, [Other significant players and their estimated market share]
Norway Mobile Payments Industry Market Dynamics & Trends
The Norwegian mobile payments market is experiencing robust growth, driven by factors such as rising smartphone penetration, increasing internet access, and government initiatives promoting cashless transactions. The market’s Compound Annual Growth Rate (CAGR) from 2019 to 2024 was xx%, and is projected to reach xx% from 2025 to 2033. Market penetration is currently estimated at [xx]% in 2025, showing substantial room for expansion. Technological disruptions, particularly the rise of contactless payments and innovative mobile wallets, are reshaping the competitive landscape. Consumer preferences are shifting towards convenient, secure, and user-friendly mobile payment solutions. This is evident in the growing popularity of services like Vipps. Competitive dynamics are characterized by both cooperation and competition, with established players partnering with fintech startups to expand their offerings.
Dominant Regions & Segments in Norway Mobile Payments Industry
The dominant region for mobile payments in Norway is the urban areas, driven by higher smartphone penetration and a greater concentration of businesses that accept mobile payments. Within segments, Proximity Payments (via NFC) and Banking App-based payments dominate, reflecting the prevalent usage of smartphones and established banking infrastructure.
Key Drivers:
- Urban Areas: High smartphone penetration, business density, and consumer adoption.
- Proximity Payments (NFC): Convenience, speed, and widespread adoption of NFC-enabled devices.
- Banking App-Based Payments: Integration with existing banking systems and widespread trust in established financial institutions.
Dominant Segments:
- Payment Mode: Proximity Payment and Banking App-based payments account for [xx]% and [xx]% of the market respectively. Remote payment is steadily growing, especially with increased e-commerce.
- Technology: NFC and Banking App-based technology leads the market with [xx]% and [xx]% market share respectively. QR Code is experiencing moderate growth with [xx]% market share.
- End User: Retail sector remains the largest segment, followed by Hospitality and Transportation.
Norway Mobile Payments Industry Product Innovations
Recent product innovations focus on enhancing security, user experience, and payment flexibility. The integration of biometric authentication, advanced fraud detection systems, and seamless integration with other financial services are key trends. The market is witnessing the emergence of innovative payment solutions tailored to specific industries, such as targeted solutions for the energy and utility sectors. This focus on specialization and enhanced user experience is driving market expansion.
Report Scope & Segmentation Analysis
This report segments the Norway mobile payments market by payment mode (Proximity Payment, Remote Payment), technology (NFC, QR Code, WAP & Card-Based, Banking App-based, Others), and end-user (Healthcare, Retail, Energy & Utilities, Hospitality and Transportation, Entertainment, Others). Each segment’s growth trajectory, market size, and competitive dynamics are analyzed in detail, providing a comprehensive overview of the market’s structure and future potential. For example, the proximity payment segment is projected to grow at a CAGR of [xx]% during the forecast period, driven by increasing NFC-enabled device adoption.
Key Drivers of Norway Mobile Payments Industry Growth
Several factors drive the growth of Norway’s mobile payments industry. High smartphone penetration and internet access among the population provide a fertile ground for adoption. Government initiatives promoting digitalization and cashless transactions create a favorable regulatory environment. The rising popularity of e-commerce and the increasing demand for seamless and convenient payment solutions further accelerate market growth.
Challenges in the Norway Mobile Payments Industry Sector
Despite significant growth, challenges remain. Concerns over data security and privacy, coupled with the need to address potential fraud, require robust security measures. Maintaining interoperability between various payment platforms and ensuring seamless user experience across different devices are crucial. Competition from established payment methods like credit cards also presents an ongoing challenge.
Emerging Opportunities in Norway Mobile Payments Industry
Significant opportunities exist in expanding mobile payment solutions into underserved segments, like rural areas. The integration of mobile payments with loyalty programs and other value-added services presents substantial potential. The emergence of new technologies, such as blockchain and AI-powered fraud detection, offers further opportunities for innovation and growth.
Leading Players in the Norway Mobile Payments Industry Market
- The Western Union Company
- Early Warning Services LLC
- Payt
- Bank Of America
- Intuit Pay
- PayPal
- Boku
- Alipay
- Apple Inc
Key Developments in Norway Mobile Payments Industry
- April 2022: Westpay integrates Vipps payment solutions into its Swipe2Pay technology, expanding its in-store payment options and increasing transaction revenue. This partnership significantly boosts Vipps' market presence in Norway.
Future Outlook for Norway Mobile Payments Industry Market
The future outlook for the Norwegian mobile payments market remains positive. Continued technological advancements, increasing consumer adoption, and supportive regulatory policies will drive market expansion. The focus on enhanced security features, personalized payment solutions, and seamless integration across platforms will be crucial for sustained growth. The market is projected to reach xx Million by 2033, representing significant growth potential for players in the industry.
Norway Mobile Payments Industry Segmentation
-
1. Payment Mode
- 1.1. Proximity Payment
- 1.2. Remote Payment
-
2. Technology
- 2.1. NFC
- 2.2. QR Code
- 2.3. WAP & Card-Based
- 2.4. Banking App-based
- 2.5. Others
-
3. End User
- 3.1. Healthcare
- 3.2. Retail
- 3.3. Energy & Utilities
- 3.4. Hospitality and Transporatation
- 3.5. Entertainment
- 3.6. Others
Norway Mobile Payments Industry Segmentation By Geography
- 1. North America
- 2. Europe
- 3. Asia Pacific
- 4. Latin America
- 5. Middle East and Africa

Norway Mobile Payments Industry REPORT HIGHLIGHTS
| Aspects | Details |
|---|---|
| Study Period | 2019-2033 |
| Base Year | 2024 |
| Estimated Year | 2025 |
| Forecast Period | 2025-2033 |
| Historical Period | 2019-2024 |
| Growth Rate | CAGR of 10.10% from 2019-2033 |
| Segmentation |
|
Table of Contents
- 1. Introduction
- 1.1. Research Scope
- 1.2. Market Segmentation
- 1.3. Research Methodology
- 1.4. Definitions and Assumptions
- 2. Executive Summary
- 2.1. Introduction
- 3. Market Dynamics
- 3.1. Introduction
- 3.2. Market Drivers
- 3.2.1. Growing Adoption of the Digitalization; Rise of Personal Financial Apps
- 3.3. Market Restrains
- 3.3.1. Security of the Data can Hinder the Growth of the Market
- 3.4. Market Trends
- 3.4.1. Growing Adoption of the Online Shopping among the Norwegian
- 4. Market Factor Analysis
- 4.1. Porters Five Forces
- 4.2. Supply/Value Chain
- 4.3. PESTEL analysis
- 4.4. Market Entropy
- 4.5. Patent/Trademark Analysis
- 5. Norway Mobile Payments Industry Analysis, Insights and Forecast, 2019-2031
- 5.1. Market Analysis, Insights and Forecast - by Payment Mode
- 5.1.1. Proximity Payment
- 5.1.2. Remote Payment
- 5.2. Market Analysis, Insights and Forecast - by Technology
- 5.2.1. NFC
- 5.2.2. QR Code
- 5.2.3. WAP & Card-Based
- 5.2.4. Banking App-based
- 5.2.5. Others
- 5.3. Market Analysis, Insights and Forecast - by End User
- 5.3.1. Healthcare
- 5.3.2. Retail
- 5.3.3. Energy & Utilities
- 5.3.4. Hospitality and Transporatation
- 5.3.5. Entertainment
- 5.3.6. Others
- 5.4. Market Analysis, Insights and Forecast - by Region
- 5.4.1. North America
- 5.4.2. Europe
- 5.4.3. Asia Pacific
- 5.4.4. Latin America
- 5.4.5. Middle East and Africa
- 5.1. Market Analysis, Insights and Forecast - by Payment Mode
- 6. North America Norway Mobile Payments Industry Analysis, Insights and Forecast, 2019-2031
- 6.1. Market Analysis, Insights and Forecast - by Payment Mode
- 6.1.1. Proximity Payment
- 6.1.2. Remote Payment
- 6.2. Market Analysis, Insights and Forecast - by Technology
- 6.2.1. NFC
- 6.2.2. QR Code
- 6.2.3. WAP & Card-Based
- 6.2.4. Banking App-based
- 6.2.5. Others
- 6.3. Market Analysis, Insights and Forecast - by End User
- 6.3.1. Healthcare
- 6.3.2. Retail
- 6.3.3. Energy & Utilities
- 6.3.4. Hospitality and Transporatation
- 6.3.5. Entertainment
- 6.3.6. Others
- 6.1. Market Analysis, Insights and Forecast - by Payment Mode
- 7. Europe Norway Mobile Payments Industry Analysis, Insights and Forecast, 2019-2031
- 7.1. Market Analysis, Insights and Forecast - by Payment Mode
- 7.1.1. Proximity Payment
- 7.1.2. Remote Payment
- 7.2. Market Analysis, Insights and Forecast - by Technology
- 7.2.1. NFC
- 7.2.2. QR Code
- 7.2.3. WAP & Card-Based
- 7.2.4. Banking App-based
- 7.2.5. Others
- 7.3. Market Analysis, Insights and Forecast - by End User
- 7.3.1. Healthcare
- 7.3.2. Retail
- 7.3.3. Energy & Utilities
- 7.3.4. Hospitality and Transporatation
- 7.3.5. Entertainment
- 7.3.6. Others
- 7.1. Market Analysis, Insights and Forecast - by Payment Mode
- 8. Asia Pacific Norway Mobile Payments Industry Analysis, Insights and Forecast, 2019-2031
- 8.1. Market Analysis, Insights and Forecast - by Payment Mode
- 8.1.1. Proximity Payment
- 8.1.2. Remote Payment
- 8.2. Market Analysis, Insights and Forecast - by Technology
- 8.2.1. NFC
- 8.2.2. QR Code
- 8.2.3. WAP & Card-Based
- 8.2.4. Banking App-based
- 8.2.5. Others
- 8.3. Market Analysis, Insights and Forecast - by End User
- 8.3.1. Healthcare
- 8.3.2. Retail
- 8.3.3. Energy & Utilities
- 8.3.4. Hospitality and Transporatation
- 8.3.5. Entertainment
- 8.3.6. Others
- 8.1. Market Analysis, Insights and Forecast - by Payment Mode
- 9. Latin America Norway Mobile Payments Industry Analysis, Insights and Forecast, 2019-2031
- 9.1. Market Analysis, Insights and Forecast - by Payment Mode
- 9.1.1. Proximity Payment
- 9.1.2. Remote Payment
- 9.2. Market Analysis, Insights and Forecast - by Technology
- 9.2.1. NFC
- 9.2.2. QR Code
- 9.2.3. WAP & Card-Based
- 9.2.4. Banking App-based
- 9.2.5. Others
- 9.3. Market Analysis, Insights and Forecast - by End User
- 9.3.1. Healthcare
- 9.3.2. Retail
- 9.3.3. Energy & Utilities
- 9.3.4. Hospitality and Transporatation
- 9.3.5. Entertainment
- 9.3.6. Others
- 9.1. Market Analysis, Insights and Forecast - by Payment Mode
- 10. Middle East and Africa Norway Mobile Payments Industry Analysis, Insights and Forecast, 2019-2031
- 10.1. Market Analysis, Insights and Forecast - by Payment Mode
- 10.1.1. Proximity Payment
- 10.1.2. Remote Payment
- 10.2. Market Analysis, Insights and Forecast - by Technology
- 10.2.1. NFC
- 10.2.2. QR Code
- 10.2.3. WAP & Card-Based
- 10.2.4. Banking App-based
- 10.2.5. Others
- 10.3. Market Analysis, Insights and Forecast - by End User
- 10.3.1. Healthcare
- 10.3.2. Retail
- 10.3.3. Energy & Utilities
- 10.3.4. Hospitality and Transporatation
- 10.3.5. Entertainment
- 10.3.6. Others
- 10.1. Market Analysis, Insights and Forecast - by Payment Mode
- 11. Competitive Analysis
- 11.1. Market Share Analysis 2024
- 11.2. Company Profiles
- 11.2.1 The Western Union Company
- 11.2.1.1. Overview
- 11.2.1.2. Products
- 11.2.1.3. SWOT Analysis
- 11.2.1.4. Recent Developments
- 11.2.1.5. Financials (Based on Availability)
- 11.2.2 Early Warning Services LLC
- 11.2.2.1. Overview
- 11.2.2.2. Products
- 11.2.2.3. SWOT Analysis
- 11.2.2.4. Recent Developments
- 11.2.2.5. Financials (Based on Availability)
- 11.2.3 Payt
- 11.2.3.1. Overview
- 11.2.3.2. Products
- 11.2.3.3. SWOT Analysis
- 11.2.3.4. Recent Developments
- 11.2.3.5. Financials (Based on Availability)
- 11.2.4 Google
- 11.2.4.1. Overview
- 11.2.4.2. Products
- 11.2.4.3. SWOT Analysis
- 11.2.4.4. Recent Developments
- 11.2.4.5. Financials (Based on Availability)
- 11.2.5 Bank Of America
- 11.2.5.1. Overview
- 11.2.5.2. Products
- 11.2.5.3. SWOT Analysis
- 11.2.5.4. Recent Developments
- 11.2.5.5. Financials (Based on Availability)
- 11.2.6 Intuit Pay
- 11.2.6.1. Overview
- 11.2.6.2. Products
- 11.2.6.3. SWOT Analysis
- 11.2.6.4. Recent Developments
- 11.2.6.5. Financials (Based on Availability)
- 11.2.7 PayPal
- 11.2.7.1. Overview
- 11.2.7.2. Products
- 11.2.7.3. SWOT Analysis
- 11.2.7.4. Recent Developments
- 11.2.7.5. Financials (Based on Availability)
- 11.2.8 Boku
- 11.2.8.1. Overview
- 11.2.8.2. Products
- 11.2.8.3. SWOT Analysis
- 11.2.8.4. Recent Developments
- 11.2.8.5. Financials (Based on Availability)
- 11.2.9 Alipay
- 11.2.9.1. Overview
- 11.2.9.2. Products
- 11.2.9.3. SWOT Analysis
- 11.2.9.4. Recent Developments
- 11.2.9.5. Financials (Based on Availability)
- 11.2.10 Apple Inc
- 11.2.10.1. Overview
- 11.2.10.2. Products
- 11.2.10.3. SWOT Analysis
- 11.2.10.4. Recent Developments
- 11.2.10.5. Financials (Based on Availability)
- 11.2.1 The Western Union Company
List of Figures
- Figure 1: Norway Mobile Payments Industry Revenue Breakdown (Million, %) by Product 2024 & 2032
- Figure 2: Norway Mobile Payments Industry Share (%) by Company 2024
List of Tables
- Table 1: Norway Mobile Payments Industry Revenue Million Forecast, by Region 2019 & 2032
- Table 2: Norway Mobile Payments Industry Revenue Million Forecast, by Payment Mode 2019 & 2032
- Table 3: Norway Mobile Payments Industry Revenue Million Forecast, by Technology 2019 & 2032
- Table 4: Norway Mobile Payments Industry Revenue Million Forecast, by End User 2019 & 2032
- Table 5: Norway Mobile Payments Industry Revenue Million Forecast, by Region 2019 & 2032
- Table 6: Norway Mobile Payments Industry Revenue Million Forecast, by Country 2019 & 2032
- Table 7: Norway Mobile Payments Industry Revenue Million Forecast, by Payment Mode 2019 & 2032
- Table 8: Norway Mobile Payments Industry Revenue Million Forecast, by Technology 2019 & 2032
- Table 9: Norway Mobile Payments Industry Revenue Million Forecast, by End User 2019 & 2032
- Table 10: Norway Mobile Payments Industry Revenue Million Forecast, by Country 2019 & 2032
- Table 11: Norway Mobile Payments Industry Revenue Million Forecast, by Payment Mode 2019 & 2032
- Table 12: Norway Mobile Payments Industry Revenue Million Forecast, by Technology 2019 & 2032
- Table 13: Norway Mobile Payments Industry Revenue Million Forecast, by End User 2019 & 2032
- Table 14: Norway Mobile Payments Industry Revenue Million Forecast, by Country 2019 & 2032
- Table 15: Norway Mobile Payments Industry Revenue Million Forecast, by Payment Mode 2019 & 2032
- Table 16: Norway Mobile Payments Industry Revenue Million Forecast, by Technology 2019 & 2032
- Table 17: Norway Mobile Payments Industry Revenue Million Forecast, by End User 2019 & 2032
- Table 18: Norway Mobile Payments Industry Revenue Million Forecast, by Country 2019 & 2032
- Table 19: Norway Mobile Payments Industry Revenue Million Forecast, by Payment Mode 2019 & 2032
- Table 20: Norway Mobile Payments Industry Revenue Million Forecast, by Technology 2019 & 2032
- Table 21: Norway Mobile Payments Industry Revenue Million Forecast, by End User 2019 & 2032
- Table 22: Norway Mobile Payments Industry Revenue Million Forecast, by Country 2019 & 2032
- Table 23: Norway Mobile Payments Industry Revenue Million Forecast, by Payment Mode 2019 & 2032
- Table 24: Norway Mobile Payments Industry Revenue Million Forecast, by Technology 2019 & 2032
- Table 25: Norway Mobile Payments Industry Revenue Million Forecast, by End User 2019 & 2032
- Table 26: Norway Mobile Payments Industry Revenue Million Forecast, by Country 2019 & 2032
Frequently Asked Questions
1. What is the projected Compound Annual Growth Rate (CAGR) of the Norway Mobile Payments Industry?
The projected CAGR is approximately 10.10%.
2. Which companies are prominent players in the Norway Mobile Payments Industry?
Key companies in the market include The Western Union Company, Early Warning Services LLC, Payt, Google, Bank Of America, Intuit Pay, PayPal, Boku, Alipay, Apple Inc.
3. What are the main segments of the Norway Mobile Payments Industry?
The market segments include Payment Mode, Technology, End User.
4. Can you provide details about the market size?
The market size is estimated to be USD XX Million as of 2022.
5. What are some drivers contributing to market growth?
Growing Adoption of the Digitalization; Rise of Personal Financial Apps.
6. What are the notable trends driving market growth?
Growing Adoption of the Online Shopping among the Norwegian.
7. Are there any restraints impacting market growth?
Security of the Data can Hinder the Growth of the Market.
8. Can you provide examples of recent developments in the market?
April 2022 - Westpay has integrated Vipps payment solutions into the Swipe2Pay technology. Vipps is the obvious choice for in-store payments in the Norwegian market, as the first transactions have just been completed. Westpay has a cutting-edge technology platform with Swipe2Pay that enables new alternative payment methods in addition to conventional card-present payments. Additionally, this partnership will increase Westpay's transaction revenue while enhancing the value of Vipps and Westpay's services to consumers and businesses.
9. What pricing options are available for accessing the report?
Pricing options include single-user, multi-user, and enterprise licenses priced at USD 3800, USD 4500, and USD 5800 respectively.
10. Is the market size provided in terms of value or volume?
The market size is provided in terms of value, measured in Million.
11. Are there any specific market keywords associated with the report?
Yes, the market keyword associated with the report is "Norway Mobile Payments Industry," which aids in identifying and referencing the specific market segment covered.
12. How do I determine which pricing option suits my needs best?
The pricing options vary based on user requirements and access needs. Individual users may opt for single-user licenses, while businesses requiring broader access may choose multi-user or enterprise licenses for cost-effective access to the report.
13. Are there any additional resources or data provided in the Norway Mobile Payments Industry report?
While the report offers comprehensive insights, it's advisable to review the specific contents or supplementary materials provided to ascertain if additional resources or data are available.
14. How can I stay updated on further developments or reports in the Norway Mobile Payments Industry?
To stay informed about further developments, trends, and reports in the Norway Mobile Payments Industry, consider subscribing to industry newsletters, following relevant companies and organizations, or regularly checking reputable industry news sources and publications.
Methodology
Step 1 - Identification of Relevant Samples Size from Population Database


Step 2 - Approaches for Defining Global Market Size (Value, Volume* & Price*)

Note*: In applicable scenarios
Step 3 - Data Sources
Primary Research
- Web Analytics
- Survey Reports
- Research Institute
- Latest Research Reports
- Opinion Leaders
Secondary Research
- Annual Reports
- White Paper
- Latest Press Release
- Industry Association
- Paid Database
- Investor Presentations

Step 4 - Data Triangulation
Involves using different sources of information in order to increase the validity of a study
These sources are likely to be stakeholders in a program - participants, other researchers, program staff, other community members, and so on.
Then we put all data in single framework & apply various statistical tools to find out the dynamic on the market.
During the analysis stage, feedback from the stakeholder groups would be compared to determine areas of agreement as well as areas of divergence


