
Key Insights
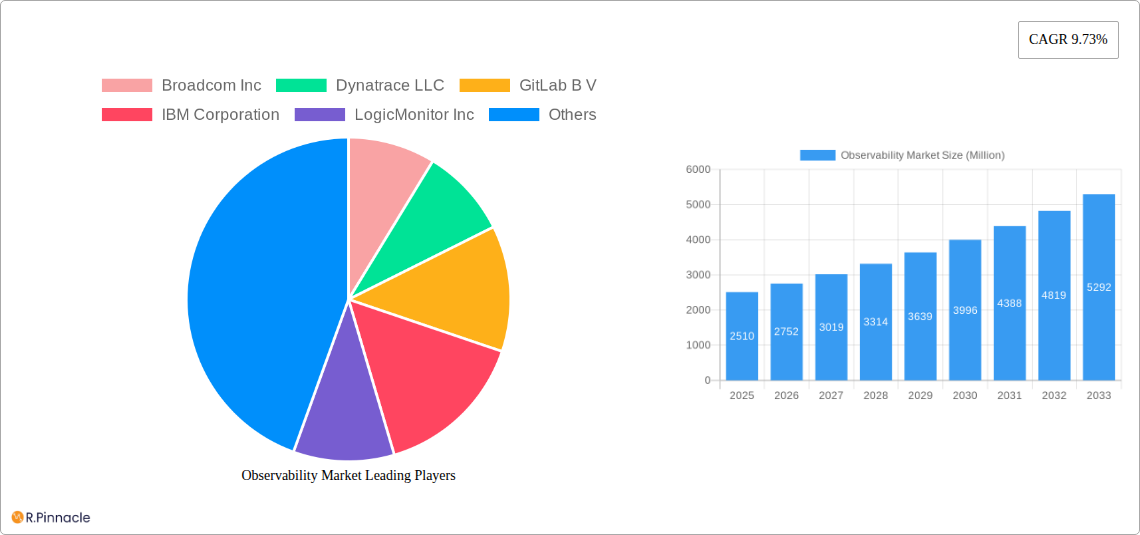
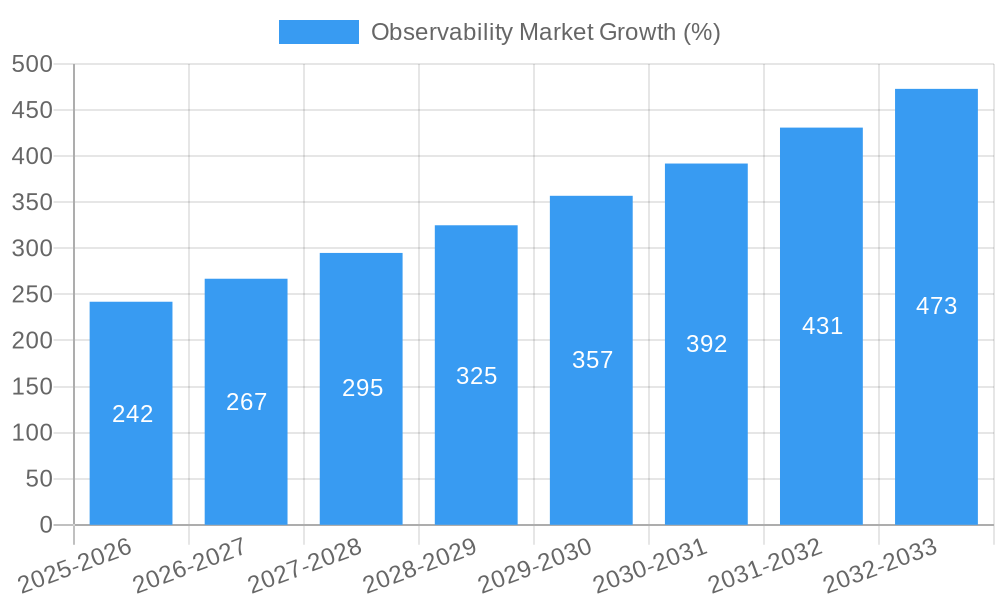
The global observability market, valued at $2.51 billion in 2025, is poised for robust growth, exhibiting a Compound Annual Growth Rate (CAGR) of 9.73% from 2025 to 2033. This expansion is driven by the increasing adoption of cloud-native architectures, microservices, and the burgeoning demand for real-time application performance monitoring. Businesses across diverse sectors are embracing observability solutions to gain deeper insights into their complex IT infrastructure and applications, enabling proactive issue resolution and improved operational efficiency. Key drivers include the need for enhanced digital experience monitoring, the rise of DevOps and AIOps practices, and the increasing complexity of modern applications, all demanding more sophisticated monitoring and troubleshooting capabilities. The competitive landscape is dynamic, with established players like Broadcom, IBM, and Microsoft alongside emerging innovative companies such as Dynatrace, GitLab, and Splunk vying for market share. This competition fuels innovation, resulting in a wider range of solutions catering to diverse needs and budgets. The market is segmented by deployment model (cloud, on-premises), organization size (small, medium, large enterprises), and vertical industry (BFSI, IT & Telecom, Healthcare, Retail). While data security and integration complexities present some challenges, the overall market trajectory indicates significant growth potential throughout the forecast period. Continued investment in AI and machine learning within observability platforms will further enhance the market's capabilities and drive adoption.
The market's growth will be influenced by several factors including technological advancements in areas like AI-powered anomaly detection, improved integration with existing monitoring tools, and the increasing adoption of serverless architectures. Geographic expansion, particularly in emerging markets, will also contribute to the market's expansion. The increasing adoption of hybrid and multi-cloud environments necessitates robust observability solutions that can effectively monitor and manage diverse IT landscapes, further fueling market expansion. Competitive pressure will continue to drive innovation, with vendors constantly striving to offer more comprehensive, user-friendly, and cost-effective solutions.
Observability Market Report: 2019-2033
This comprehensive report provides an in-depth analysis of the Observability Market, offering invaluable insights for industry professionals, investors, and strategic decision-makers. Covering the period 2019-2033, with a focus on 2025, this report meticulously examines market structure, dynamics, key players, and future growth potential. The report leverages extensive market research and data analysis to deliver actionable intelligence, empowering informed business strategies. The global market is projected to reach xx Million by 2033.
Observability Market Structure & Innovation Trends
This section analyzes the competitive landscape of the Observability Market, encompassing market concentration, innovation drivers, regulatory frameworks, and M&A activities. The report identifies key players like Broadcom Inc, Dynatrace LLC, GitLab B V, IBM Corporation, LogicMonitor Inc, Microsoft Corporation, Monte Carlo Corporation, Riverbed Technology, ScienceLogic Inc, and Splunk Inc (list not exhaustive), assessing their market share and strategic moves.
The market exhibits a moderately concentrated structure, with a few dominant players holding significant market share. Innovation is driven primarily by advancements in AI, machine learning, and cloud computing, leading to more sophisticated monitoring and analytics capabilities. Regulatory frameworks, particularly around data privacy and security, significantly influence market dynamics. Product substitutes, such as traditional monitoring tools, are gradually losing ground to the more comprehensive observability solutions. The end-user demographic is diverse, encompassing enterprises across various sectors, with a growing focus on cloud-native applications.
M&A activities have played a substantial role in shaping the market landscape. Recent deals, though not comprehensively detailed here, have involved significant investments, demonstrating the considerable growth potential and attractiveness of the sector. For instance, the average M&A deal value in the last five years (2019-2024) is estimated to be xx Million.
Observability Market Dynamics & Trends
This section delves into the key dynamics shaping the Observability Market, including growth drivers, technological disruptions, consumer preferences, and competitive dynamics. The market is witnessing robust growth, driven by the increasing adoption of cloud-native architectures, microservices, and DevOps practices.
The CAGR for the forecast period (2025-2033) is estimated at xx%, indicating substantial growth potential. Technological disruptions, such as the rise of serverless computing and edge computing, are creating new opportunities for observability solutions. Consumer preferences are shifting towards solutions that offer greater visibility, real-time insights, and automation capabilities. Competitive dynamics are intense, with players constantly innovating to enhance their offerings and gain market share. Market penetration is currently estimated at xx% in the base year (2025) and is projected to increase substantially by 2033.
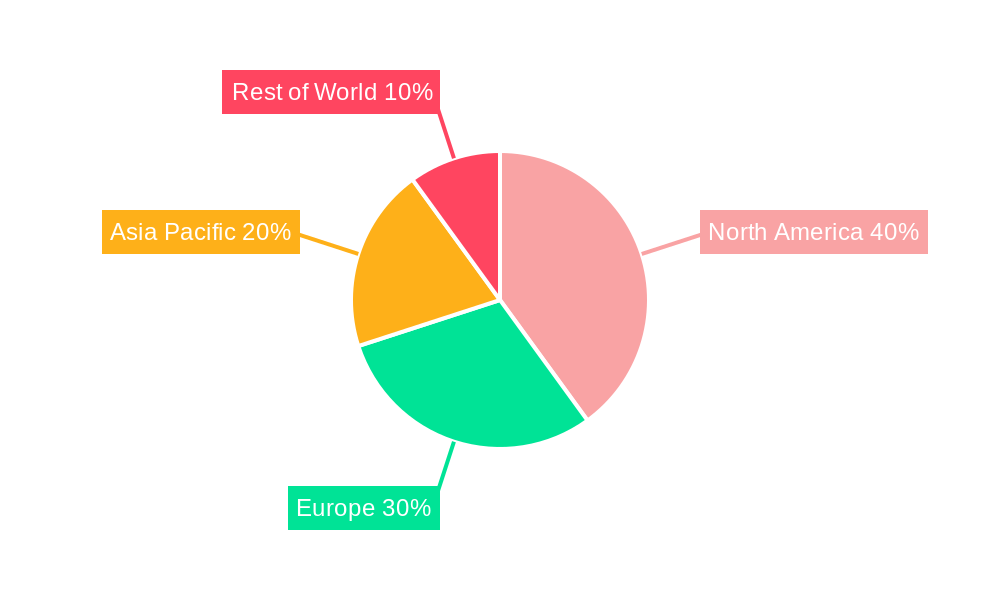
Dominant Regions & Segments in Observability Market
This section identifies the leading regions and segments within the Observability Market. While detailed regional breakdowns are included in the full report, the North American market currently holds a dominant position, driven by strong technological advancements, early adoption of cloud technologies, and a robust IT infrastructure.
- Key Drivers for North American Dominance:
- Advanced technological infrastructure.
- High adoption rates of cloud-native applications.
- Strong investment in R&D.
- Favorable regulatory environment.
Other regions are experiencing significant growth, fueled by increasing digitalization and government initiatives to promote technological adoption. The enterprise segment is currently the largest, followed by the SMB segment. Further segmentations by deployment model (cloud, on-premises), application type (web, mobile, IoT), and industry vertical are detailed in the complete report. The full report provides a granular analysis of market size and growth projections for each segment and region.
Observability Market Product Innovations
Recent product innovations are focused on enhancing the capabilities of observability platforms, leveraging AI/ML for advanced analytics, anomaly detection, and automated root cause analysis. The integration of AIOps is becoming increasingly prevalent, enabling proactive issue resolution and improved operational efficiency. New offerings are emphasizing ease of use, improved scalability, and seamless integration with existing IT infrastructure. This improved market fit is driven by the increasing complexity of modern applications and the growing demand for comprehensive monitoring and management capabilities.
Report Scope & Segmentation Analysis
This report segments the Observability Market by deployment model (cloud, on-premises, hybrid), organization size (large enterprises, SMEs), industry vertical (BFSI, IT & Telecom, Healthcare, Retail, etc.), and application type (web applications, mobile applications, IoT). Each segment's growth projections, market size, and competitive dynamics are analyzed in detail. The report also covers different pricing models and their impact on market adoption.
Key Drivers of Observability Market Growth
The growth of the Observability Market is driven by several key factors:
- Increased adoption of cloud-native applications: The shift towards microservices and containerized applications requires robust observability solutions.
- Rising demand for AIOps: AI-powered analytics are improving the efficiency and effectiveness of IT operations.
- Growing need for real-time insights: Businesses need immediate visibility into their systems and applications to ensure optimal performance.
- Stringent regulatory compliance requirements: Observability solutions help organizations meet compliance standards.
These factors contribute significantly to the increasing demand for advanced monitoring and analytics capabilities.
Challenges in the Observability Market Sector
Despite significant growth potential, several challenges hinder market expansion. These include:
- High implementation costs: Implementing and maintaining observability solutions can be expensive, especially for SMEs.
- Complexity of integration: Integrating observability tools with existing IT infrastructure can be challenging.
- Shortage of skilled professionals: There's a growing demand for professionals with expertise in observability and AIOps. This skills gap restricts the ability of organizations to fully leverage the potential of these solutions.
- Data security and privacy concerns: Managing and securing large volumes of observability data requires robust security measures.
Emerging Opportunities in Observability Market
Emerging opportunities lie in expanding into new market segments, leveraging emerging technologies like edge computing, and addressing the increasing demand for automation and self-service capabilities. The integration of observability with security tools (SecOps) is an emerging trend, creating significant opportunities for vendors. Furthermore, the development of more user-friendly and intuitive interfaces will enhance market accessibility.
Leading Players in the Observability Market Market
- Broadcom Inc
- Dynatrace LLC
- GitLab B V
- IBM Corporation
- LogicMonitor Inc
- Microsoft Corporation
- Monte Carlo Corporation
- Riverbed Technology
- ScienceLogic Inc
- Splunk Inc
- List Not Exhaustive
Key Developments in Observability Market Industry
- June 2024: SUSE acquired StackState, integrating observability capabilities into its Rancher platform for Kubernetes management. This move strengthens SUSE's position in the enterprise observability market.
- May 2024: Cisco launched a new virtual appliance for its AppDynamics On-Premises offering, providing a self-hosted, AI-powered solution for enhanced anomaly detection, root cause analysis, and security monitoring. This expands Cisco's reach to customers prioritizing on-premises solutions.
Future Outlook for Observability Market Market
The Observability Market is poised for sustained growth, driven by the continued adoption of cloud-native technologies, the increasing complexity of IT infrastructures, and the rising demand for AI-powered analytics. Strategic opportunities lie in developing innovative solutions that address emerging challenges, enhance user experience, and cater to the evolving needs of businesses across diverse industry verticals. The market is expected to witness further consolidation through M&A activities, shaping a more competitive yet increasingly integrated landscape.
Observability Market Segmentation
-
1. Type
- 1.1. Solution
- 1.2. Services
-
2. Deployment
- 2.1. Cloud
- 2.2. On-Premises
-
3. Enterprises
- 3.1. SMEs
- 3.2. Large Enterprises
-
4. End-user Vertical
- 4.1. IT and Telecom
- 4.2. Retail and E-commerce
- 4.3. Manufacturing
- 4.4. BFSI
- 4.5. Government and Defense
- 4.6. Other End-user Verticals
Observability Market Segmentation By Geography
- 1. North America
- 2. Europe
- 3. Asia
- 4. Australia and New Zealand
- 5. Latin America
- 6. Middle East and Africa
Observability Market REPORT HIGHLIGHTS
| Aspects | Details |
|---|---|
| Study Period | 2019-2033 |
| Base Year | 2024 |
| Estimated Year | 2025 |
| Forecast Period | 2025-2033 |
| Historical Period | 2019-2024 |
| Growth Rate | CAGR of 9.73% from 2019-2033 |
| Segmentation |
|
Table of Contents
- 1. Introduction
- 1.1. Research Scope
- 1.2. Market Segmentation
- 1.3. Research Methodology
- 1.4. Definitions and Assumptions
- 2. Executive Summary
- 2.1. Introduction
- 3. Market Dynamics
- 3.1. Introduction
- 3.2. Market Drivers
- 3.2.1. Increasing Automation Among Enterprises; Shifting Workloads of Enterprises towards Cloud Environment
- 3.3. Market Restrains
- 3.3.1. Increasing Automation Among Enterprises; Shifting Workloads of Enterprises towards Cloud Environment
- 3.4. Market Trends
- 3.4.1. BFSI to Hold Significant Share
- 4. Market Factor Analysis
- 4.1. Porters Five Forces
- 4.2. Supply/Value Chain
- 4.3. PESTEL analysis
- 4.4. Market Entropy
- 4.5. Patent/Trademark Analysis
- 5. Global Observability Market Analysis, Insights and Forecast, 2019-2031
- 5.1. Market Analysis, Insights and Forecast - by Type
- 5.1.1. Solution
- 5.1.2. Services
- 5.2. Market Analysis, Insights and Forecast - by Deployment
- 5.2.1. Cloud
- 5.2.2. On-Premises
- 5.3. Market Analysis, Insights and Forecast - by Enterprises
- 5.3.1. SMEs
- 5.3.2. Large Enterprises
- 5.4. Market Analysis, Insights and Forecast - by End-user Vertical
- 5.4.1. IT and Telecom
- 5.4.2. Retail and E-commerce
- 5.4.3. Manufacturing
- 5.4.4. BFSI
- 5.4.5. Government and Defense
- 5.4.6. Other End-user Verticals
- 5.5. Market Analysis, Insights and Forecast - by Region
- 5.5.1. North America
- 5.5.2. Europe
- 5.5.3. Asia
- 5.5.4. Australia and New Zealand
- 5.5.5. Latin America
- 5.5.6. Middle East and Africa
- 5.1. Market Analysis, Insights and Forecast - by Type
- 6. North America Observability Market Analysis, Insights and Forecast, 2019-2031
- 6.1. Market Analysis, Insights and Forecast - by Type
- 6.1.1. Solution
- 6.1.2. Services
- 6.2. Market Analysis, Insights and Forecast - by Deployment
- 6.2.1. Cloud
- 6.2.2. On-Premises
- 6.3. Market Analysis, Insights and Forecast - by Enterprises
- 6.3.1. SMEs
- 6.3.2. Large Enterprises
- 6.4. Market Analysis, Insights and Forecast - by End-user Vertical
- 6.4.1. IT and Telecom
- 6.4.2. Retail and E-commerce
- 6.4.3. Manufacturing
- 6.4.4. BFSI
- 6.4.5. Government and Defense
- 6.4.6. Other End-user Verticals
- 6.1. Market Analysis, Insights and Forecast - by Type
- 7. Europe Observability Market Analysis, Insights and Forecast, 2019-2031
- 7.1. Market Analysis, Insights and Forecast - by Type
- 7.1.1. Solution
- 7.1.2. Services
- 7.2. Market Analysis, Insights and Forecast - by Deployment
- 7.2.1. Cloud
- 7.2.2. On-Premises
- 7.3. Market Analysis, Insights and Forecast - by Enterprises
- 7.3.1. SMEs
- 7.3.2. Large Enterprises
- 7.4. Market Analysis, Insights and Forecast - by End-user Vertical
- 7.4.1. IT and Telecom
- 7.4.2. Retail and E-commerce
- 7.4.3. Manufacturing
- 7.4.4. BFSI
- 7.4.5. Government and Defense
- 7.4.6. Other End-user Verticals
- 7.1. Market Analysis, Insights and Forecast - by Type
- 8. Asia Observability Market Analysis, Insights and Forecast, 2019-2031
- 8.1. Market Analysis, Insights and Forecast - by Type
- 8.1.1. Solution
- 8.1.2. Services
- 8.2. Market Analysis, Insights and Forecast - by Deployment
- 8.2.1. Cloud
- 8.2.2. On-Premises
- 8.3. Market Analysis, Insights and Forecast - by Enterprises
- 8.3.1. SMEs
- 8.3.2. Large Enterprises
- 8.4. Market Analysis, Insights and Forecast - by End-user Vertical
- 8.4.1. IT and Telecom
- 8.4.2. Retail and E-commerce
- 8.4.3. Manufacturing
- 8.4.4. BFSI
- 8.4.5. Government and Defense
- 8.4.6. Other End-user Verticals
- 8.1. Market Analysis, Insights and Forecast - by Type
- 9. Australia and New Zealand Observability Market Analysis, Insights and Forecast, 2019-2031
- 9.1. Market Analysis, Insights and Forecast - by Type
- 9.1.1. Solution
- 9.1.2. Services
- 9.2. Market Analysis, Insights and Forecast - by Deployment
- 9.2.1. Cloud
- 9.2.2. On-Premises
- 9.3. Market Analysis, Insights and Forecast - by Enterprises
- 9.3.1. SMEs
- 9.3.2. Large Enterprises
- 9.4. Market Analysis, Insights and Forecast - by End-user Vertical
- 9.4.1. IT and Telecom
- 9.4.2. Retail and E-commerce
- 9.4.3. Manufacturing
- 9.4.4. BFSI
- 9.4.5. Government and Defense
- 9.4.6. Other End-user Verticals
- 9.1. Market Analysis, Insights and Forecast - by Type
- 10. Latin America Observability Market Analysis, Insights and Forecast, 2019-2031
- 10.1. Market Analysis, Insights and Forecast - by Type
- 10.1.1. Solution
- 10.1.2. Services
- 10.2. Market Analysis, Insights and Forecast - by Deployment
- 10.2.1. Cloud
- 10.2.2. On-Premises
- 10.3. Market Analysis, Insights and Forecast - by Enterprises
- 10.3.1. SMEs
- 10.3.2. Large Enterprises
- 10.4. Market Analysis, Insights and Forecast - by End-user Vertical
- 10.4.1. IT and Telecom
- 10.4.2. Retail and E-commerce
- 10.4.3. Manufacturing
- 10.4.4. BFSI
- 10.4.5. Government and Defense
- 10.4.6. Other End-user Verticals
- 10.1. Market Analysis, Insights and Forecast - by Type
- 11. Middle East and Africa Observability Market Analysis, Insights and Forecast, 2019-2031
- 11.1. Market Analysis, Insights and Forecast - by Type
- 11.1.1. Solution
- 11.1.2. Services
- 11.2. Market Analysis, Insights and Forecast - by Deployment
- 11.2.1. Cloud
- 11.2.2. On-Premises
- 11.3. Market Analysis, Insights and Forecast - by Enterprises
- 11.3.1. SMEs
- 11.3.2. Large Enterprises
- 11.4. Market Analysis, Insights and Forecast - by End-user Vertical
- 11.4.1. IT and Telecom
- 11.4.2. Retail and E-commerce
- 11.4.3. Manufacturing
- 11.4.4. BFSI
- 11.4.5. Government and Defense
- 11.4.6. Other End-user Verticals
- 11.1. Market Analysis, Insights and Forecast - by Type
- 12. Competitive Analysis
- 12.1. Global Market Share Analysis 2024
- 12.2. Company Profiles
- 12.2.1 Broadcom Inc
- 12.2.1.1. Overview
- 12.2.1.2. Products
- 12.2.1.3. SWOT Analysis
- 12.2.1.4. Recent Developments
- 12.2.1.5. Financials (Based on Availability)
- 12.2.2 Dynatrace LLC
- 12.2.2.1. Overview
- 12.2.2.2. Products
- 12.2.2.3. SWOT Analysis
- 12.2.2.4. Recent Developments
- 12.2.2.5. Financials (Based on Availability)
- 12.2.3 GitLab B V
- 12.2.3.1. Overview
- 12.2.3.2. Products
- 12.2.3.3. SWOT Analysis
- 12.2.3.4. Recent Developments
- 12.2.3.5. Financials (Based on Availability)
- 12.2.4 IBM Corporation
- 12.2.4.1. Overview
- 12.2.4.2. Products
- 12.2.4.3. SWOT Analysis
- 12.2.4.4. Recent Developments
- 12.2.4.5. Financials (Based on Availability)
- 12.2.5 LogicMonitor Inc
- 12.2.5.1. Overview
- 12.2.5.2. Products
- 12.2.5.3. SWOT Analysis
- 12.2.5.4. Recent Developments
- 12.2.5.5. Financials (Based on Availability)
- 12.2.6 Microsoft Corporation
- 12.2.6.1. Overview
- 12.2.6.2. Products
- 12.2.6.3. SWOT Analysis
- 12.2.6.4. Recent Developments
- 12.2.6.5. Financials (Based on Availability)
- 12.2.7 Monte Carlo Corporation
- 12.2.7.1. Overview
- 12.2.7.2. Products
- 12.2.7.3. SWOT Analysis
- 12.2.7.4. Recent Developments
- 12.2.7.5. Financials (Based on Availability)
- 12.2.8 Riverbed Technology
- 12.2.8.1. Overview
- 12.2.8.2. Products
- 12.2.8.3. SWOT Analysis
- 12.2.8.4. Recent Developments
- 12.2.8.5. Financials (Based on Availability)
- 12.2.9 ScienceLogic Inc
- 12.2.9.1. Overview
- 12.2.9.2. Products
- 12.2.9.3. SWOT Analysis
- 12.2.9.4. Recent Developments
- 12.2.9.5. Financials (Based on Availability)
- 12.2.10 Splunk Inc *List Not Exhaustive
- 12.2.10.1. Overview
- 12.2.10.2. Products
- 12.2.10.3. SWOT Analysis
- 12.2.10.4. Recent Developments
- 12.2.10.5. Financials (Based on Availability)
- 12.2.1 Broadcom Inc
List of Figures
- Figure 1: Global Observability Market Revenue Breakdown (Million, %) by Region 2024 & 2032
- Figure 2: Global Observability Market Volume Breakdown (Billion, %) by Region 2024 & 2032
- Figure 3: North America Observability Market Revenue (Million), by Type 2024 & 2032
- Figure 4: North America Observability Market Volume (Billion), by Type 2024 & 2032
- Figure 5: North America Observability Market Revenue Share (%), by Type 2024 & 2032
- Figure 6: North America Observability Market Volume Share (%), by Type 2024 & 2032
- Figure 7: North America Observability Market Revenue (Million), by Deployment 2024 & 2032
- Figure 8: North America Observability Market Volume (Billion), by Deployment 2024 & 2032
- Figure 9: North America Observability Market Revenue Share (%), by Deployment 2024 & 2032
- Figure 10: North America Observability Market Volume Share (%), by Deployment 2024 & 2032
- Figure 11: North America Observability Market Revenue (Million), by Enterprises 2024 & 2032
- Figure 12: North America Observability Market Volume (Billion), by Enterprises 2024 & 2032
- Figure 13: North America Observability Market Revenue Share (%), by Enterprises 2024 & 2032
- Figure 14: North America Observability Market Volume Share (%), by Enterprises 2024 & 2032
- Figure 15: North America Observability Market Revenue (Million), by End-user Vertical 2024 & 2032
- Figure 16: North America Observability Market Volume (Billion), by End-user Vertical 2024 & 2032
- Figure 17: North America Observability Market Revenue Share (%), by End-user Vertical 2024 & 2032
- Figure 18: North America Observability Market Volume Share (%), by End-user Vertical 2024 & 2032
- Figure 19: North America Observability Market Revenue (Million), by Country 2024 & 2032
- Figure 20: North America Observability Market Volume (Billion), by Country 2024 & 2032
- Figure 21: North America Observability Market Revenue Share (%), by Country 2024 & 2032
- Figure 22: North America Observability Market Volume Share (%), by Country 2024 & 2032
- Figure 23: Europe Observability Market Revenue (Million), by Type 2024 & 2032
- Figure 24: Europe Observability Market Volume (Billion), by Type 2024 & 2032
- Figure 25: Europe Observability Market Revenue Share (%), by Type 2024 & 2032
- Figure 26: Europe Observability Market Volume Share (%), by Type 2024 & 2032
- Figure 27: Europe Observability Market Revenue (Million), by Deployment 2024 & 2032
- Figure 28: Europe Observability Market Volume (Billion), by Deployment 2024 & 2032
- Figure 29: Europe Observability Market Revenue Share (%), by Deployment 2024 & 2032
- Figure 30: Europe Observability Market Volume Share (%), by Deployment 2024 & 2032
- Figure 31: Europe Observability Market Revenue (Million), by Enterprises 2024 & 2032
- Figure 32: Europe Observability Market Volume (Billion), by Enterprises 2024 & 2032
- Figure 33: Europe Observability Market Revenue Share (%), by Enterprises 2024 & 2032
- Figure 34: Europe Observability Market Volume Share (%), by Enterprises 2024 & 2032
- Figure 35: Europe Observability Market Revenue (Million), by End-user Vertical 2024 & 2032
- Figure 36: Europe Observability Market Volume (Billion), by End-user Vertical 2024 & 2032
- Figure 37: Europe Observability Market Revenue Share (%), by End-user Vertical 2024 & 2032
- Figure 38: Europe Observability Market Volume Share (%), by End-user Vertical 2024 & 2032
- Figure 39: Europe Observability Market Revenue (Million), by Country 2024 & 2032
- Figure 40: Europe Observability Market Volume (Billion), by Country 2024 & 2032
- Figure 41: Europe Observability Market Revenue Share (%), by Country 2024 & 2032
- Figure 42: Europe Observability Market Volume Share (%), by Country 2024 & 2032
- Figure 43: Asia Observability Market Revenue (Million), by Type 2024 & 2032
- Figure 44: Asia Observability Market Volume (Billion), by Type 2024 & 2032
- Figure 45: Asia Observability Market Revenue Share (%), by Type 2024 & 2032
- Figure 46: Asia Observability Market Volume Share (%), by Type 2024 & 2032
- Figure 47: Asia Observability Market Revenue (Million), by Deployment 2024 & 2032
- Figure 48: Asia Observability Market Volume (Billion), by Deployment 2024 & 2032
- Figure 49: Asia Observability Market Revenue Share (%), by Deployment 2024 & 2032
- Figure 50: Asia Observability Market Volume Share (%), by Deployment 2024 & 2032
- Figure 51: Asia Observability Market Revenue (Million), by Enterprises 2024 & 2032
- Figure 52: Asia Observability Market Volume (Billion), by Enterprises 2024 & 2032
- Figure 53: Asia Observability Market Revenue Share (%), by Enterprises 2024 & 2032
- Figure 54: Asia Observability Market Volume Share (%), by Enterprises 2024 & 2032
- Figure 55: Asia Observability Market Revenue (Million), by End-user Vertical 2024 & 2032
- Figure 56: Asia Observability Market Volume (Billion), by End-user Vertical 2024 & 2032
- Figure 57: Asia Observability Market Revenue Share (%), by End-user Vertical 2024 & 2032
- Figure 58: Asia Observability Market Volume Share (%), by End-user Vertical 2024 & 2032
- Figure 59: Asia Observability Market Revenue (Million), by Country 2024 & 2032
- Figure 60: Asia Observability Market Volume (Billion), by Country 2024 & 2032
- Figure 61: Asia Observability Market Revenue Share (%), by Country 2024 & 2032
- Figure 62: Asia Observability Market Volume Share (%), by Country 2024 & 2032
- Figure 63: Australia and New Zealand Observability Market Revenue (Million), by Type 2024 & 2032
- Figure 64: Australia and New Zealand Observability Market Volume (Billion), by Type 2024 & 2032
- Figure 65: Australia and New Zealand Observability Market Revenue Share (%), by Type 2024 & 2032
- Figure 66: Australia and New Zealand Observability Market Volume Share (%), by Type 2024 & 2032
- Figure 67: Australia and New Zealand Observability Market Revenue (Million), by Deployment 2024 & 2032
- Figure 68: Australia and New Zealand Observability Market Volume (Billion), by Deployment 2024 & 2032
- Figure 69: Australia and New Zealand Observability Market Revenue Share (%), by Deployment 2024 & 2032
- Figure 70: Australia and New Zealand Observability Market Volume Share (%), by Deployment 2024 & 2032
- Figure 71: Australia and New Zealand Observability Market Revenue (Million), by Enterprises 2024 & 2032
- Figure 72: Australia and New Zealand Observability Market Volume (Billion), by Enterprises 2024 & 2032
- Figure 73: Australia and New Zealand Observability Market Revenue Share (%), by Enterprises 2024 & 2032
- Figure 74: Australia and New Zealand Observability Market Volume Share (%), by Enterprises 2024 & 2032
- Figure 75: Australia and New Zealand Observability Market Revenue (Million), by End-user Vertical 2024 & 2032
- Figure 76: Australia and New Zealand Observability Market Volume (Billion), by End-user Vertical 2024 & 2032
- Figure 77: Australia and New Zealand Observability Market Revenue Share (%), by End-user Vertical 2024 & 2032
- Figure 78: Australia and New Zealand Observability Market Volume Share (%), by End-user Vertical 2024 & 2032
- Figure 79: Australia and New Zealand Observability Market Revenue (Million), by Country 2024 & 2032
- Figure 80: Australia and New Zealand Observability Market Volume (Billion), by Country 2024 & 2032
- Figure 81: Australia and New Zealand Observability Market Revenue Share (%), by Country 2024 & 2032
- Figure 82: Australia and New Zealand Observability Market Volume Share (%), by Country 2024 & 2032
- Figure 83: Latin America Observability Market Revenue (Million), by Type 2024 & 2032
- Figure 84: Latin America Observability Market Volume (Billion), by Type 2024 & 2032
- Figure 85: Latin America Observability Market Revenue Share (%), by Type 2024 & 2032
- Figure 86: Latin America Observability Market Volume Share (%), by Type 2024 & 2032
- Figure 87: Latin America Observability Market Revenue (Million), by Deployment 2024 & 2032
- Figure 88: Latin America Observability Market Volume (Billion), by Deployment 2024 & 2032
- Figure 89: Latin America Observability Market Revenue Share (%), by Deployment 2024 & 2032
- Figure 90: Latin America Observability Market Volume Share (%), by Deployment 2024 & 2032
- Figure 91: Latin America Observability Market Revenue (Million), by Enterprises 2024 & 2032
- Figure 92: Latin America Observability Market Volume (Billion), by Enterprises 2024 & 2032
- Figure 93: Latin America Observability Market Revenue Share (%), by Enterprises 2024 & 2032
- Figure 94: Latin America Observability Market Volume Share (%), by Enterprises 2024 & 2032
- Figure 95: Latin America Observability Market Revenue (Million), by End-user Vertical 2024 & 2032
- Figure 96: Latin America Observability Market Volume (Billion), by End-user Vertical 2024 & 2032
- Figure 97: Latin America Observability Market Revenue Share (%), by End-user Vertical 2024 & 2032
- Figure 98: Latin America Observability Market Volume Share (%), by End-user Vertical 2024 & 2032
- Figure 99: Latin America Observability Market Revenue (Million), by Country 2024 & 2032
- Figure 100: Latin America Observability Market Volume (Billion), by Country 2024 & 2032
- Figure 101: Latin America Observability Market Revenue Share (%), by Country 2024 & 2032
- Figure 102: Latin America Observability Market Volume Share (%), by Country 2024 & 2032
- Figure 103: Middle East and Africa Observability Market Revenue (Million), by Type 2024 & 2032
- Figure 104: Middle East and Africa Observability Market Volume (Billion), by Type 2024 & 2032
- Figure 105: Middle East and Africa Observability Market Revenue Share (%), by Type 2024 & 2032
- Figure 106: Middle East and Africa Observability Market Volume Share (%), by Type 2024 & 2032
- Figure 107: Middle East and Africa Observability Market Revenue (Million), by Deployment 2024 & 2032
- Figure 108: Middle East and Africa Observability Market Volume (Billion), by Deployment 2024 & 2032
- Figure 109: Middle East and Africa Observability Market Revenue Share (%), by Deployment 2024 & 2032
- Figure 110: Middle East and Africa Observability Market Volume Share (%), by Deployment 2024 & 2032
- Figure 111: Middle East and Africa Observability Market Revenue (Million), by Enterprises 2024 & 2032
- Figure 112: Middle East and Africa Observability Market Volume (Billion), by Enterprises 2024 & 2032
- Figure 113: Middle East and Africa Observability Market Revenue Share (%), by Enterprises 2024 & 2032
- Figure 114: Middle East and Africa Observability Market Volume Share (%), by Enterprises 2024 & 2032
- Figure 115: Middle East and Africa Observability Market Revenue (Million), by End-user Vertical 2024 & 2032
- Figure 116: Middle East and Africa Observability Market Volume (Billion), by End-user Vertical 2024 & 2032
- Figure 117: Middle East and Africa Observability Market Revenue Share (%), by End-user Vertical 2024 & 2032
- Figure 118: Middle East and Africa Observability Market Volume Share (%), by End-user Vertical 2024 & 2032
- Figure 119: Middle East and Africa Observability Market Revenue (Million), by Country 2024 & 2032
- Figure 120: Middle East and Africa Observability Market Volume (Billion), by Country 2024 & 2032
- Figure 121: Middle East and Africa Observability Market Revenue Share (%), by Country 2024 & 2032
- Figure 122: Middle East and Africa Observability Market Volume Share (%), by Country 2024 & 2032
List of Tables
- Table 1: Global Observability Market Revenue Million Forecast, by Region 2019 & 2032
- Table 2: Global Observability Market Volume Billion Forecast, by Region 2019 & 2032
- Table 3: Global Observability Market Revenue Million Forecast, by Type 2019 & 2032
- Table 4: Global Observability Market Volume Billion Forecast, by Type 2019 & 2032
- Table 5: Global Observability Market Revenue Million Forecast, by Deployment 2019 & 2032
- Table 6: Global Observability Market Volume Billion Forecast, by Deployment 2019 & 2032
- Table 7: Global Observability Market Revenue Million Forecast, by Enterprises 2019 & 2032
- Table 8: Global Observability Market Volume Billion Forecast, by Enterprises 2019 & 2032
- Table 9: Global Observability Market Revenue Million Forecast, by End-user Vertical 2019 & 2032
- Table 10: Global Observability Market Volume Billion Forecast, by End-user Vertical 2019 & 2032
- Table 11: Global Observability Market Revenue Million Forecast, by Region 2019 & 2032
- Table 12: Global Observability Market Volume Billion Forecast, by Region 2019 & 2032
- Table 13: Global Observability Market Revenue Million Forecast, by Type 2019 & 2032
- Table 14: Global Observability Market Volume Billion Forecast, by Type 2019 & 2032
- Table 15: Global Observability Market Revenue Million Forecast, by Deployment 2019 & 2032
- Table 16: Global Observability Market Volume Billion Forecast, by Deployment 2019 & 2032
- Table 17: Global Observability Market Revenue Million Forecast, by Enterprises 2019 & 2032
- Table 18: Global Observability Market Volume Billion Forecast, by Enterprises 2019 & 2032
- Table 19: Global Observability Market Revenue Million Forecast, by End-user Vertical 2019 & 2032
- Table 20: Global Observability Market Volume Billion Forecast, by End-user Vertical 2019 & 2032
- Table 21: Global Observability Market Revenue Million Forecast, by Country 2019 & 2032
- Table 22: Global Observability Market Volume Billion Forecast, by Country 2019 & 2032
- Table 23: Global Observability Market Revenue Million Forecast, by Type 2019 & 2032
- Table 24: Global Observability Market Volume Billion Forecast, by Type 2019 & 2032
- Table 25: Global Observability Market Revenue Million Forecast, by Deployment 2019 & 2032
- Table 26: Global Observability Market Volume Billion Forecast, by Deployment 2019 & 2032
- Table 27: Global Observability Market Revenue Million Forecast, by Enterprises 2019 & 2032
- Table 28: Global Observability Market Volume Billion Forecast, by Enterprises 2019 & 2032
- Table 29: Global Observability Market Revenue Million Forecast, by End-user Vertical 2019 & 2032
- Table 30: Global Observability Market Volume Billion Forecast, by End-user Vertical 2019 & 2032
- Table 31: Global Observability Market Revenue Million Forecast, by Country 2019 & 2032
- Table 32: Global Observability Market Volume Billion Forecast, by Country 2019 & 2032
- Table 33: Global Observability Market Revenue Million Forecast, by Type 2019 & 2032
- Table 34: Global Observability Market Volume Billion Forecast, by Type 2019 & 2032
- Table 35: Global Observability Market Revenue Million Forecast, by Deployment 2019 & 2032
- Table 36: Global Observability Market Volume Billion Forecast, by Deployment 2019 & 2032
- Table 37: Global Observability Market Revenue Million Forecast, by Enterprises 2019 & 2032
- Table 38: Global Observability Market Volume Billion Forecast, by Enterprises 2019 & 2032
- Table 39: Global Observability Market Revenue Million Forecast, by End-user Vertical 2019 & 2032
- Table 40: Global Observability Market Volume Billion Forecast, by End-user Vertical 2019 & 2032
- Table 41: Global Observability Market Revenue Million Forecast, by Country 2019 & 2032
- Table 42: Global Observability Market Volume Billion Forecast, by Country 2019 & 2032
- Table 43: Global Observability Market Revenue Million Forecast, by Type 2019 & 2032
- Table 44: Global Observability Market Volume Billion Forecast, by Type 2019 & 2032
- Table 45: Global Observability Market Revenue Million Forecast, by Deployment 2019 & 2032
- Table 46: Global Observability Market Volume Billion Forecast, by Deployment 2019 & 2032
- Table 47: Global Observability Market Revenue Million Forecast, by Enterprises 2019 & 2032
- Table 48: Global Observability Market Volume Billion Forecast, by Enterprises 2019 & 2032
- Table 49: Global Observability Market Revenue Million Forecast, by End-user Vertical 2019 & 2032
- Table 50: Global Observability Market Volume Billion Forecast, by End-user Vertical 2019 & 2032
- Table 51: Global Observability Market Revenue Million Forecast, by Country 2019 & 2032
- Table 52: Global Observability Market Volume Billion Forecast, by Country 2019 & 2032
- Table 53: Global Observability Market Revenue Million Forecast, by Type 2019 & 2032
- Table 54: Global Observability Market Volume Billion Forecast, by Type 2019 & 2032
- Table 55: Global Observability Market Revenue Million Forecast, by Deployment 2019 & 2032
- Table 56: Global Observability Market Volume Billion Forecast, by Deployment 2019 & 2032
- Table 57: Global Observability Market Revenue Million Forecast, by Enterprises 2019 & 2032
- Table 58: Global Observability Market Volume Billion Forecast, by Enterprises 2019 & 2032
- Table 59: Global Observability Market Revenue Million Forecast, by End-user Vertical 2019 & 2032
- Table 60: Global Observability Market Volume Billion Forecast, by End-user Vertical 2019 & 2032
- Table 61: Global Observability Market Revenue Million Forecast, by Country 2019 & 2032
- Table 62: Global Observability Market Volume Billion Forecast, by Country 2019 & 2032
- Table 63: Global Observability Market Revenue Million Forecast, by Type 2019 & 2032
- Table 64: Global Observability Market Volume Billion Forecast, by Type 2019 & 2032
- Table 65: Global Observability Market Revenue Million Forecast, by Deployment 2019 & 2032
- Table 66: Global Observability Market Volume Billion Forecast, by Deployment 2019 & 2032
- Table 67: Global Observability Market Revenue Million Forecast, by Enterprises 2019 & 2032
- Table 68: Global Observability Market Volume Billion Forecast, by Enterprises 2019 & 2032
- Table 69: Global Observability Market Revenue Million Forecast, by End-user Vertical 2019 & 2032
- Table 70: Global Observability Market Volume Billion Forecast, by End-user Vertical 2019 & 2032
- Table 71: Global Observability Market Revenue Million Forecast, by Country 2019 & 2032
- Table 72: Global Observability Market Volume Billion Forecast, by Country 2019 & 2032
Frequently Asked Questions
1. What is the projected Compound Annual Growth Rate (CAGR) of the Observability Market?
The projected CAGR is approximately 9.73%.
2. Which companies are prominent players in the Observability Market?
Key companies in the market include Broadcom Inc, Dynatrace LLC, GitLab B V, IBM Corporation, LogicMonitor Inc, Microsoft Corporation, Monte Carlo Corporation, Riverbed Technology, ScienceLogic Inc, Splunk Inc *List Not Exhaustive.
3. What are the main segments of the Observability Market?
The market segments include Type, Deployment, Enterprises, End-user Vertical.
4. Can you provide details about the market size?
The market size is estimated to be USD 2.51 Million as of 2022.
5. What are some drivers contributing to market growth?
Increasing Automation Among Enterprises; Shifting Workloads of Enterprises towards Cloud Environment.
6. What are the notable trends driving market growth?
BFSI to Hold Significant Share.
7. Are there any restraints impacting market growth?
Increasing Automation Among Enterprises; Shifting Workloads of Enterprises towards Cloud Environment.
8. Can you provide examples of recent developments in the market?
June 2024: SUSE announced it has acquired StackState as part of a plan to embed observability capabilities into its Rancher platform for managing Kubernetes clusters. Announced at SUSECon event, the StackState observability platform will be embedded into the Rancher Prime version of the platform for enterprise IT teams.May 2024: Cisco announced a new virtual appliance for its AppDynamics On-Premises application observability offering, enabling customers to use a self-hosted observability solution built on AI-powered intelligence for anomaly detection and root cause analysis, application security, and SAP monitoring.
9. What pricing options are available for accessing the report?
Pricing options include single-user, multi-user, and enterprise licenses priced at USD 4750, USD 5250, and USD 8750 respectively.
10. Is the market size provided in terms of value or volume?
The market size is provided in terms of value, measured in Million and volume, measured in Billion.
11. Are there any specific market keywords associated with the report?
Yes, the market keyword associated with the report is "Observability Market," which aids in identifying and referencing the specific market segment covered.
12. How do I determine which pricing option suits my needs best?
The pricing options vary based on user requirements and access needs. Individual users may opt for single-user licenses, while businesses requiring broader access may choose multi-user or enterprise licenses for cost-effective access to the report.
13. Are there any additional resources or data provided in the Observability Market report?
While the report offers comprehensive insights, it's advisable to review the specific contents or supplementary materials provided to ascertain if additional resources or data are available.
14. How can I stay updated on further developments or reports in the Observability Market?
To stay informed about further developments, trends, and reports in the Observability Market, consider subscribing to industry newsletters, following relevant companies and organizations, or regularly checking reputable industry news sources and publications.
Methodology
Step 1 - Identification of Relevant Samples Size from Population Database


Step 2 - Approaches for Defining Global Market Size (Value, Volume* & Price*)

Note*: In applicable scenarios
Step 3 - Data Sources
Primary Research
- Web Analytics
- Survey Reports
- Research Institute
- Latest Research Reports
- Opinion Leaders
Secondary Research
- Annual Reports
- White Paper
- Latest Press Release
- Industry Association
- Paid Database
- Investor Presentations

Step 4 - Data Triangulation
Involves using different sources of information in order to increase the validity of a study
These sources are likely to be stakeholders in a program - participants, other researchers, program staff, other community members, and so on.
Then we put all data in single framework & apply various statistical tools to find out the dynamic on the market.
During the analysis stage, feedback from the stakeholder groups would be compared to determine areas of agreement as well as areas of divergence


