
Key Insights
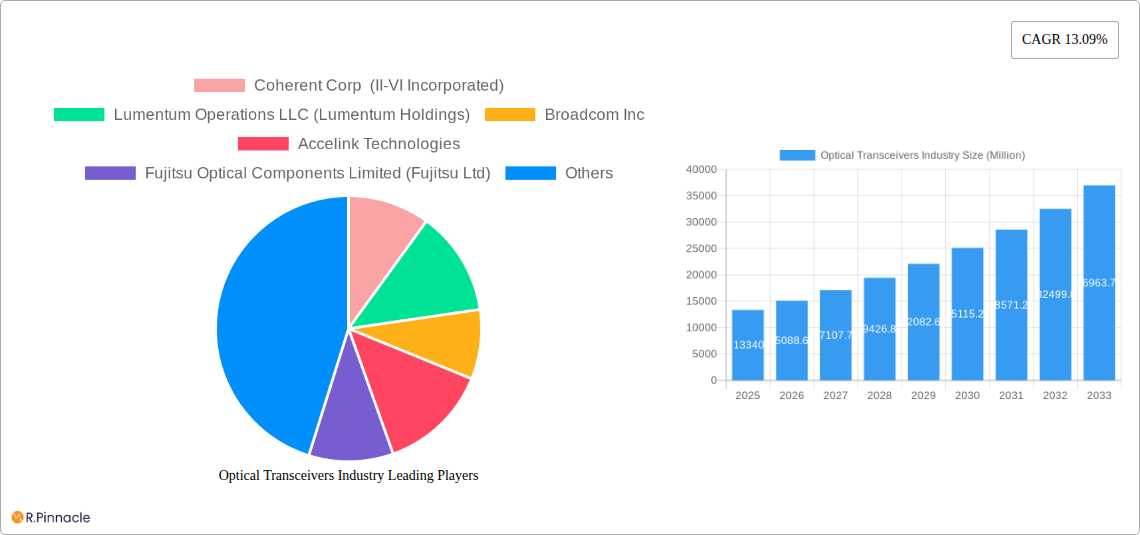
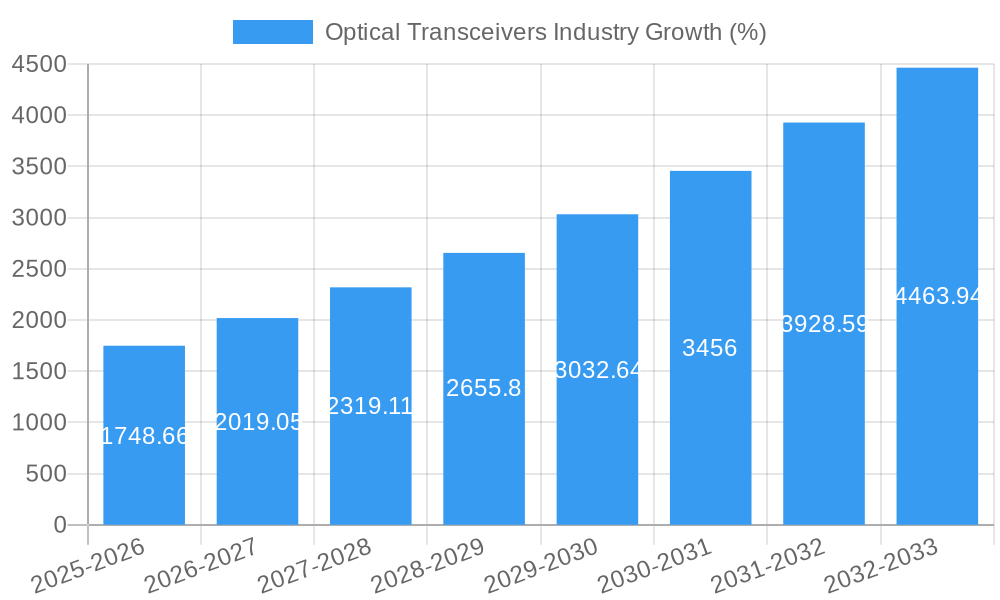
The optical transceivers market, valued at $13.34 billion in 2025, is projected to experience robust growth, exhibiting a compound annual growth rate (CAGR) of 13.09% from 2025 to 2033. This expansion is fueled by several key drivers. The increasing adoption of high-speed data transmission technologies in data centers, driven by cloud computing and big data analytics, significantly boosts demand for high-bandwidth optical transceivers. Furthermore, the proliferation of 5G and fiber-to-the-X (FTTX) networks globally necessitates advanced optical transceiver solutions, underpinning market growth. The shift towards 100Gbps and beyond data rates, coupled with the expanding deployment of coherent optical communication systems, further contributes to this positive trend. Market segmentation reveals a strong preference for Ethernet protocols within data center applications. However, the Fiber Channel, CWDM/DWDM and FTTX segments are also experiencing significant growth, driven by their specialized applications in telecommunications and enterprise networks. Competitive landscape analysis shows a concentrated market with key players like Coherent Corp, Lumentum, Broadcom, and Huawei actively shaping technological advancements and market strategies.
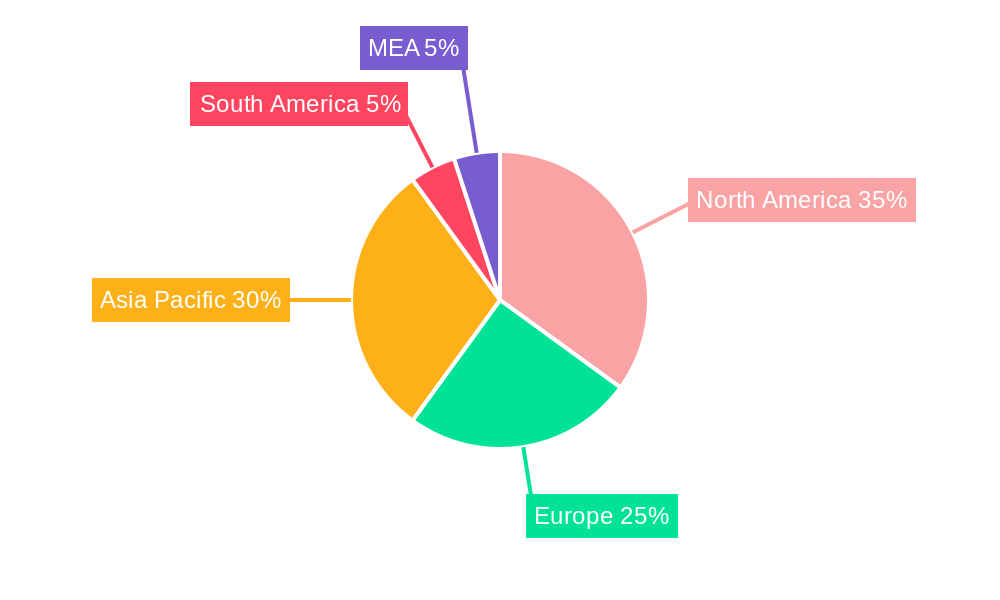
Geographic expansion is another prominent feature of this market. North America currently holds a significant market share, attributed to a mature technological infrastructure and substantial investments in data center infrastructure. However, the Asia-Pacific region, especially China and India, is anticipated to exhibit the fastest growth rate due to rapid infrastructure development and expanding digital economies. While factors like high initial investment costs and potential technological obsolescence pose some restraints, the overall market outlook remains positive, driven by sustained technological advancements and increasing demand for higher bandwidth and faster data transmission across various applications and geographical regions. The market is expected to reach approximately $40 billion by 2033 based on the provided CAGR and current market size.
Optical Transceivers Industry Market Report: 2019-2033
This comprehensive report provides an in-depth analysis of the Optical Transceivers industry, offering invaluable insights for industry professionals, investors, and strategic decision-makers. With a study period spanning 2019-2033, a base year of 2025, and a forecast period of 2025-2033, this report leverages historical data (2019-2024) to project future market trends and opportunities. The report examines key market segments, leading players, and emerging technologies, providing a 360-degree view of this dynamic sector. Expect detailed analysis of market size (in Millions), CAGR, and market share across various segments and geographic regions.
Optical Transceivers Industry Market Structure & Innovation Trends
The optical transceiver market exhibits a moderately consolidated structure, with several key players holding significant market share. Competition is fierce, driven by continuous technological advancements and the increasing demand for higher data rates. Major players include Coherent Corp (II-VI Incorporated), Lumentum Operations LLC (Lumentum Holdings), Broadcom Inc, Accelink Technologies, Fujitsu Optical Components Limited (Fujitsu Ltd), Huawei Technologies Co Ltd, Source Photonics (Redview Capital), HUBER+SUHNER Cube Optics, Smiths Interconnect (Reflex Photonics Inc), and Sumitomo Electric Industries Ltd. These companies engage in intense R&D, leading to frequent product launches and technological innovations.
- Market Concentration: The top 5 players account for approximately xx% of the global market share in 2025.
- Innovation Drivers: The primary drivers of innovation include the need for higher bandwidth, lower latency, and improved energy efficiency. The rise of cloud computing, AI/ML, and 5G networks significantly influences this demand.
- Regulatory Frameworks: Government regulations regarding data security and network infrastructure impact the market, particularly in the telecommunications sector.
- Product Substitutes: While few direct substitutes exist, advancements in alternative technologies constantly present potential challenges.
- End-User Demographics: Data centers, telecommunication companies, and enterprise networks represent the key end-user segments.
- M&A Activities: The industry has witnessed several mergers and acquisitions in recent years, with deal values reaching xx Million annually. These activities are primarily aimed at expanding product portfolios and market reach.
Optical Transceivers Industry Market Dynamics & Trends
The optical transceiver market is experiencing robust growth, driven by the exponential increase in data traffic globally. The Compound Annual Growth Rate (CAGR) is projected to be xx% during the forecast period (2025-2033). Key factors fueling this growth include:
- The increasing adoption of cloud computing and data centers: The demand for high-speed, low-latency connections within data centers continues to rise, necessitating the use of advanced optical transceivers.
- Expansion of 5G and other high-speed wireless networks: The rollout of 5G and other high-bandwidth wireless technologies requires robust optical infrastructure, creating substantial demand for optical transceivers.
- Growth of the Internet of Things (IoT): The proliferation of IoT devices increases data traffic, necessitating improvements in network infrastructure, again pushing demand for optical transceivers.
- Technological advancements, such as the development of higher-speed transceivers (400G, 800G, and beyond): Technological innovation continually pushes the boundaries of data transmission speeds, driving market expansion.
- Increasing adoption of high-bandwidth applications like video streaming and online gaming: These applications require substantial bandwidth, driving the need for advanced optical transceivers.
- Market penetration of optical transceivers in various industries such as automotive, industrial automation, and healthcare: Applications outside traditional sectors are expanding the market's reach.
Dominant Regions & Segments in Optical Transceivers Industry
North America and Asia-Pacific currently dominate the optical transceiver market.
- North America: Strong presence of key players, advanced technological infrastructure, and significant investment in data centers fuel this region's dominance.
- Asia-Pacific: Rapid growth of the telecommunications and data center infrastructure in countries like China, Japan, and South Korea are driving the demand.
Dominant Segments:
- By Protocol: Ethernet holds the largest market share, followed by CWDM/DWDM. The adoption of Ethernet in data centers and telecommunications drives its dominance.
- By Data Rate: The 100 Gbps and greater than 100 Gbps segments are experiencing rapid growth, reflecting the industry's shift toward higher bandwidth applications.
- By Application: Data centers currently dominate the application segment, driven by the escalating demand for high-speed interconnections.
Key Drivers for Dominant Regions and Segments:
- Strong government support for digital infrastructure development: Government initiatives focusing on digital transformation drive the demand for high-speed networking solutions.
- High levels of capital investment in the telecommunications and data center sectors: Significant investments in infrastructure are fueling the growth of the optical transceiver market.
- Presence of large-scale hyperscale data centers: The concentration of major cloud service providers in specific regions fuels the demand for optical transceivers.
Optical Transceivers Industry Product Innovations
Recent years have seen significant advancements in optical transceiver technology, including the development of higher data rates (400G, 800G, 1.6T), improved energy efficiency, and smaller form factors. These innovations cater to the growing demand for higher bandwidth and lower latency in data centers and telecommunications networks. The introduction of coherent optical transceivers has enabled long-haul and high-capacity transmission over optical fiber, enhancing the capabilities of long-distance networks. Competition focuses on increasing data rates, reducing power consumption, and improving cost-effectiveness.
Report Scope & Segmentation Analysis
This report comprehensively segments the optical transceiver market based on protocol (Ethernet, Fiber Channel, CWDM/DWDM, FTTX, Other Protocols), data rate (Less than 10 Gbps, 10 Gbps to 40 Gbps, 100 Gbps, Greater than 100 Gbps), and application (Data Center, Telecommunication). Each segment’s growth projections, market sizes, and competitive dynamics are analyzed in detail, providing a granular understanding of the market landscape. Growth forecasts indicate robust expansion across all segments, though higher data rate segments are predicted to experience the most significant growth. The competitive landscape varies across segments, reflecting the technological complexities and market demands.
Key Drivers of Optical Transceivers Industry Growth
The optical transceiver market's growth is propelled by several key factors: the escalating demand for high-bandwidth applications, the proliferation of data centers, the expansion of 5G networks, and continuous technological advancements leading to higher data rates and improved energy efficiency. Government initiatives promoting digital infrastructure development further accelerate market growth. The increasing adoption of cloud computing and AI/ML applications also drives significant demand.
Challenges in the Optical Transceivers Industry Sector
Challenges facing the industry include maintaining a balance between cost-effectiveness and performance, the complexities of integrating new technologies into existing networks, managing supply chain disruptions (potential impact of xx Million in lost revenue projected for 2026), and intense competition amongst leading manufacturers. Regulatory changes and standardization efforts also present complexities for manufacturers.
Emerging Opportunities in Optical Transceivers Industry
Emerging opportunities lie in the development of next-generation optical transceivers for 800G and beyond, expansion into new applications (e.g., automotive, industrial automation), and the integration of optical transceivers with other technologies, such as artificial intelligence. The adoption of coherent optical technologies in submarine cables and long-haul networks presents significant growth potential. Furthermore, exploring energy-efficient designs offers substantial future opportunities.
Leading Players in the Optical Transceivers Industry Market
- Coherent Corp (II-VI Incorporated)
- Lumentum Operations LLC (Lumentum Holdings)
- Broadcom Inc
- Accelink Technologies
- Fujitsu Optical Components Limited (Fujitsu Ltd)
- Huawei Technologies Co Ltd
- Source Photonics (Redview Capital)
- HUBER+SUHNER Cube Optics
- Smiths Interconnect (Reflex Photonics Inc)
- Sumitomo Electric Industries Ltd
Key Developments in Optical Transceivers Industry Industry
- October 2023: Broadcom and Semtech Corporation demonstrated a 200 G/lane optical transceiver at ECOC 2023. This showcases advancements in PAM4 PMDs and DSP PHY technologies.
- October 2023: II-VI Incorporated demonstrated next-generation transceivers and laser technology for 800 G and 1.6T datacom transmission at ECOC 2023. This highlights the push towards higher data rates for data centers and cloud infrastructure.
Future Outlook for Optical Transceivers Industry Market
The future of the optical transceiver market is bright, driven by the continuous growth in data traffic, advancements in technology, and expanding applications across various sectors. The focus on higher data rates, improved energy efficiency, and cost reduction will continue to shape the market. Strategic partnerships and acquisitions will likely play a key role in shaping the competitive landscape. The market is poised for significant growth, driven by the expanding global digital infrastructure.
Optical Transceivers Industry Segmentation
-
1. Protocol
- 1.1. Ethernet
- 1.2. Fiber Channel
- 1.3. CWDM/DWDM
- 1.4. FTTX
- 1.5. Other Protocols
-
2. Data Rate
- 2.1. Less than 10 Gbps
- 2.2. 10 Gbps to 40 Gbps
- 2.3. 100 Gbps
- 2.4. Greater than 100 Gbps
-
3. Application
- 3.1. Data Center
- 3.2. Telecommunication
Optical Transceivers Industry Segmentation By Geography
- 1. North America
- 2. Europe
- 3. Asia
- 4. Australia and New Zealand
- 5. Latin America
- 6. Middle East and Africa
Optical Transceivers Industry REPORT HIGHLIGHTS
| Aspects | Details |
|---|---|
| Study Period | 2019-2033 |
| Base Year | 2024 |
| Estimated Year | 2025 |
| Forecast Period | 2025-2033 |
| Historical Period | 2019-2024 |
| Growth Rate | CAGR of 13.09% from 2019-2033 |
| Segmentation |
|
Table of Contents
- 1. Introduction
- 1.1. Research Scope
- 1.2. Market Segmentation
- 1.3. Research Methodology
- 1.4. Definitions and Assumptions
- 2. Executive Summary
- 2.1. Introduction
- 3. Market Dynamics
- 3.1. Introduction
- 3.2. Market Drivers
- 3.2.1. Increasing Need for Advanced Communication; Increasing Demand for Cloud-based Services
- 3.3. Market Restrains
- 3.3.1. Increase in Network Complexity
- 3.4. Market Trends
- 3.4.1. Data Centers to the Fastest Growing Application for Optical Transceivers
- 4. Market Factor Analysis
- 4.1. Porters Five Forces
- 4.2. Supply/Value Chain
- 4.3. PESTEL analysis
- 4.4. Market Entropy
- 4.5. Patent/Trademark Analysis
- 5. Global Optical Transceivers Industry Analysis, Insights and Forecast, 2019-2031
- 5.1. Market Analysis, Insights and Forecast - by Protocol
- 5.1.1. Ethernet
- 5.1.2. Fiber Channel
- 5.1.3. CWDM/DWDM
- 5.1.4. FTTX
- 5.1.5. Other Protocols
- 5.2. Market Analysis, Insights and Forecast - by Data Rate
- 5.2.1. Less than 10 Gbps
- 5.2.2. 10 Gbps to 40 Gbps
- 5.2.3. 100 Gbps
- 5.2.4. Greater than 100 Gbps
- 5.3. Market Analysis, Insights and Forecast - by Application
- 5.3.1. Data Center
- 5.3.2. Telecommunication
- 5.4. Market Analysis, Insights and Forecast - by Region
- 5.4.1. North America
- 5.4.2. Europe
- 5.4.3. Asia
- 5.4.4. Australia and New Zealand
- 5.4.5. Latin America
- 5.4.6. Middle East and Africa
- 5.1. Market Analysis, Insights and Forecast - by Protocol
- 6. North America Optical Transceivers Industry Analysis, Insights and Forecast, 2019-2031
- 6.1. Market Analysis, Insights and Forecast - by Protocol
- 6.1.1. Ethernet
- 6.1.2. Fiber Channel
- 6.1.3. CWDM/DWDM
- 6.1.4. FTTX
- 6.1.5. Other Protocols
- 6.2. Market Analysis, Insights and Forecast - by Data Rate
- 6.2.1. Less than 10 Gbps
- 6.2.2. 10 Gbps to 40 Gbps
- 6.2.3. 100 Gbps
- 6.2.4. Greater than 100 Gbps
- 6.3. Market Analysis, Insights and Forecast - by Application
- 6.3.1. Data Center
- 6.3.2. Telecommunication
- 6.1. Market Analysis, Insights and Forecast - by Protocol
- 7. Europe Optical Transceivers Industry Analysis, Insights and Forecast, 2019-2031
- 7.1. Market Analysis, Insights and Forecast - by Protocol
- 7.1.1. Ethernet
- 7.1.2. Fiber Channel
- 7.1.3. CWDM/DWDM
- 7.1.4. FTTX
- 7.1.5. Other Protocols
- 7.2. Market Analysis, Insights and Forecast - by Data Rate
- 7.2.1. Less than 10 Gbps
- 7.2.2. 10 Gbps to 40 Gbps
- 7.2.3. 100 Gbps
- 7.2.4. Greater than 100 Gbps
- 7.3. Market Analysis, Insights and Forecast - by Application
- 7.3.1. Data Center
- 7.3.2. Telecommunication
- 7.1. Market Analysis, Insights and Forecast - by Protocol
- 8. Asia Optical Transceivers Industry Analysis, Insights and Forecast, 2019-2031
- 8.1. Market Analysis, Insights and Forecast - by Protocol
- 8.1.1. Ethernet
- 8.1.2. Fiber Channel
- 8.1.3. CWDM/DWDM
- 8.1.4. FTTX
- 8.1.5. Other Protocols
- 8.2. Market Analysis, Insights and Forecast - by Data Rate
- 8.2.1. Less than 10 Gbps
- 8.2.2. 10 Gbps to 40 Gbps
- 8.2.3. 100 Gbps
- 8.2.4. Greater than 100 Gbps
- 8.3. Market Analysis, Insights and Forecast - by Application
- 8.3.1. Data Center
- 8.3.2. Telecommunication
- 8.1. Market Analysis, Insights and Forecast - by Protocol
- 9. Australia and New Zealand Optical Transceivers Industry Analysis, Insights and Forecast, 2019-2031
- 9.1. Market Analysis, Insights and Forecast - by Protocol
- 9.1.1. Ethernet
- 9.1.2. Fiber Channel
- 9.1.3. CWDM/DWDM
- 9.1.4. FTTX
- 9.1.5. Other Protocols
- 9.2. Market Analysis, Insights and Forecast - by Data Rate
- 9.2.1. Less than 10 Gbps
- 9.2.2. 10 Gbps to 40 Gbps
- 9.2.3. 100 Gbps
- 9.2.4. Greater than 100 Gbps
- 9.3. Market Analysis, Insights and Forecast - by Application
- 9.3.1. Data Center
- 9.3.2. Telecommunication
- 9.1. Market Analysis, Insights and Forecast - by Protocol
- 10. Latin America Optical Transceivers Industry Analysis, Insights and Forecast, 2019-2031
- 10.1. Market Analysis, Insights and Forecast - by Protocol
- 10.1.1. Ethernet
- 10.1.2. Fiber Channel
- 10.1.3. CWDM/DWDM
- 10.1.4. FTTX
- 10.1.5. Other Protocols
- 10.2. Market Analysis, Insights and Forecast - by Data Rate
- 10.2.1. Less than 10 Gbps
- 10.2.2. 10 Gbps to 40 Gbps
- 10.2.3. 100 Gbps
- 10.2.4. Greater than 100 Gbps
- 10.3. Market Analysis, Insights and Forecast - by Application
- 10.3.1. Data Center
- 10.3.2. Telecommunication
- 10.1. Market Analysis, Insights and Forecast - by Protocol
- 11. Middle East and Africa Optical Transceivers Industry Analysis, Insights and Forecast, 2019-2031
- 11.1. Market Analysis, Insights and Forecast - by Protocol
- 11.1.1. Ethernet
- 11.1.2. Fiber Channel
- 11.1.3. CWDM/DWDM
- 11.1.4. FTTX
- 11.1.5. Other Protocols
- 11.2. Market Analysis, Insights and Forecast - by Data Rate
- 11.2.1. Less than 10 Gbps
- 11.2.2. 10 Gbps to 40 Gbps
- 11.2.3. 100 Gbps
- 11.2.4. Greater than 100 Gbps
- 11.3. Market Analysis, Insights and Forecast - by Application
- 11.3.1. Data Center
- 11.3.2. Telecommunication
- 11.1. Market Analysis, Insights and Forecast - by Protocol
- 12. North America Optical Transceivers Industry Analysis, Insights and Forecast, 2019-2031
- 12.1. Market Analysis, Insights and Forecast - By Country/Sub-region
- 12.1.1 United States
- 12.1.2 Canada
- 12.1.3 Mexico
- 13. Europe Optical Transceivers Industry Analysis, Insights and Forecast, 2019-2031
- 13.1. Market Analysis, Insights and Forecast - By Country/Sub-region
- 13.1.1 Germany
- 13.1.2 United Kingdom
- 13.1.3 France
- 13.1.4 Spain
- 13.1.5 Italy
- 13.1.6 Spain
- 13.1.7 Belgium
- 13.1.8 Netherland
- 13.1.9 Nordics
- 13.1.10 Rest of Europe
- 14. Asia Pacific Optical Transceivers Industry Analysis, Insights and Forecast, 2019-2031
- 14.1. Market Analysis, Insights and Forecast - By Country/Sub-region
- 14.1.1 China
- 14.1.2 Japan
- 14.1.3 India
- 14.1.4 South Korea
- 14.1.5 Southeast Asia
- 14.1.6 Australia
- 14.1.7 Indonesia
- 14.1.8 Phillipes
- 14.1.9 Singapore
- 14.1.10 Thailandc
- 14.1.11 Rest of Asia Pacific
- 15. South America Optical Transceivers Industry Analysis, Insights and Forecast, 2019-2031
- 15.1. Market Analysis, Insights and Forecast - By Country/Sub-region
- 15.1.1 Brazil
- 15.1.2 Argentina
- 15.1.3 Peru
- 15.1.4 Chile
- 15.1.5 Colombia
- 15.1.6 Ecuador
- 15.1.7 Venezuela
- 15.1.8 Rest of South America
- 16. North America Optical Transceivers Industry Analysis, Insights and Forecast, 2019-2031
- 16.1. Market Analysis, Insights and Forecast - By Country/Sub-region
- 16.1.1 United States
- 16.1.2 Canada
- 16.1.3 Mexico
- 17. MEA Optical Transceivers Industry Analysis, Insights and Forecast, 2019-2031
- 17.1. Market Analysis, Insights and Forecast - By Country/Sub-region
- 17.1.1 United Arab Emirates
- 17.1.2 Saudi Arabia
- 17.1.3 South Africa
- 17.1.4 Rest of Middle East and Africa
- 18. Competitive Analysis
- 18.1. Global Market Share Analysis 2024
- 18.2. Company Profiles
- 18.2.1 Coherent Corp (II-VI Incorporated)
- 18.2.1.1. Overview
- 18.2.1.2. Products
- 18.2.1.3. SWOT Analysis
- 18.2.1.4. Recent Developments
- 18.2.1.5. Financials (Based on Availability)
- 18.2.2 Lumentum Operations LLC (Lumentum Holdings)
- 18.2.2.1. Overview
- 18.2.2.2. Products
- 18.2.2.3. SWOT Analysis
- 18.2.2.4. Recent Developments
- 18.2.2.5. Financials (Based on Availability)
- 18.2.3 Broadcom Inc
- 18.2.3.1. Overview
- 18.2.3.2. Products
- 18.2.3.3. SWOT Analysis
- 18.2.3.4. Recent Developments
- 18.2.3.5. Financials (Based on Availability)
- 18.2.4 Accelink Technologies
- 18.2.4.1. Overview
- 18.2.4.2. Products
- 18.2.4.3. SWOT Analysis
- 18.2.4.4. Recent Developments
- 18.2.4.5. Financials (Based on Availability)
- 18.2.5 Fujitsu Optical Components Limited (Fujitsu Ltd)
- 18.2.5.1. Overview
- 18.2.5.2. Products
- 18.2.5.3. SWOT Analysis
- 18.2.5.4. Recent Developments
- 18.2.5.5. Financials (Based on Availability)
- 18.2.6 Huawei Technologies Co Ltd
- 18.2.6.1. Overview
- 18.2.6.2. Products
- 18.2.6.3. SWOT Analysis
- 18.2.6.4. Recent Developments
- 18.2.6.5. Financials (Based on Availability)
- 18.2.7 Source Photonics (Redview Capital)
- 18.2.7.1. Overview
- 18.2.7.2. Products
- 18.2.7.3. SWOT Analysis
- 18.2.7.4. Recent Developments
- 18.2.7.5. Financials (Based on Availability)
- 18.2.8 HUBER+SUHNER Cube Optics
- 18.2.8.1. Overview
- 18.2.8.2. Products
- 18.2.8.3. SWOT Analysis
- 18.2.8.4. Recent Developments
- 18.2.8.5. Financials (Based on Availability)
- 18.2.9 Smiths Interconnect (Reflex Photonics Inc )
- 18.2.9.1. Overview
- 18.2.9.2. Products
- 18.2.9.3. SWOT Analysis
- 18.2.9.4. Recent Developments
- 18.2.9.5. Financials (Based on Availability)
- 18.2.10 Sumitomo Electric Industries Ltd
- 18.2.10.1. Overview
- 18.2.10.2. Products
- 18.2.10.3. SWOT Analysis
- 18.2.10.4. Recent Developments
- 18.2.10.5. Financials (Based on Availability)
- 18.2.1 Coherent Corp (II-VI Incorporated)
List of Figures
- Figure 1: Global Optical Transceivers Industry Revenue Breakdown (Million, %) by Region 2024 & 2032
- Figure 2: North America Optical Transceivers Industry Revenue (Million), by Country 2024 & 2032
- Figure 3: North America Optical Transceivers Industry Revenue Share (%), by Country 2024 & 2032
- Figure 4: Europe Optical Transceivers Industry Revenue (Million), by Country 2024 & 2032
- Figure 5: Europe Optical Transceivers Industry Revenue Share (%), by Country 2024 & 2032
- Figure 6: Asia Pacific Optical Transceivers Industry Revenue (Million), by Country 2024 & 2032
- Figure 7: Asia Pacific Optical Transceivers Industry Revenue Share (%), by Country 2024 & 2032
- Figure 8: South America Optical Transceivers Industry Revenue (Million), by Country 2024 & 2032
- Figure 9: South America Optical Transceivers Industry Revenue Share (%), by Country 2024 & 2032
- Figure 10: North America Optical Transceivers Industry Revenue (Million), by Country 2024 & 2032
- Figure 11: North America Optical Transceivers Industry Revenue Share (%), by Country 2024 & 2032
- Figure 12: MEA Optical Transceivers Industry Revenue (Million), by Country 2024 & 2032
- Figure 13: MEA Optical Transceivers Industry Revenue Share (%), by Country 2024 & 2032
- Figure 14: North America Optical Transceivers Industry Revenue (Million), by Protocol 2024 & 2032
- Figure 15: North America Optical Transceivers Industry Revenue Share (%), by Protocol 2024 & 2032
- Figure 16: North America Optical Transceivers Industry Revenue (Million), by Data Rate 2024 & 2032
- Figure 17: North America Optical Transceivers Industry Revenue Share (%), by Data Rate 2024 & 2032
- Figure 18: North America Optical Transceivers Industry Revenue (Million), by Application 2024 & 2032
- Figure 19: North America Optical Transceivers Industry Revenue Share (%), by Application 2024 & 2032
- Figure 20: North America Optical Transceivers Industry Revenue (Million), by Country 2024 & 2032
- Figure 21: North America Optical Transceivers Industry Revenue Share (%), by Country 2024 & 2032
- Figure 22: Europe Optical Transceivers Industry Revenue (Million), by Protocol 2024 & 2032
- Figure 23: Europe Optical Transceivers Industry Revenue Share (%), by Protocol 2024 & 2032
- Figure 24: Europe Optical Transceivers Industry Revenue (Million), by Data Rate 2024 & 2032
- Figure 25: Europe Optical Transceivers Industry Revenue Share (%), by Data Rate 2024 & 2032
- Figure 26: Europe Optical Transceivers Industry Revenue (Million), by Application 2024 & 2032
- Figure 27: Europe Optical Transceivers Industry Revenue Share (%), by Application 2024 & 2032
- Figure 28: Europe Optical Transceivers Industry Revenue (Million), by Country 2024 & 2032
- Figure 29: Europe Optical Transceivers Industry Revenue Share (%), by Country 2024 & 2032
- Figure 30: Asia Optical Transceivers Industry Revenue (Million), by Protocol 2024 & 2032
- Figure 31: Asia Optical Transceivers Industry Revenue Share (%), by Protocol 2024 & 2032
- Figure 32: Asia Optical Transceivers Industry Revenue (Million), by Data Rate 2024 & 2032
- Figure 33: Asia Optical Transceivers Industry Revenue Share (%), by Data Rate 2024 & 2032
- Figure 34: Asia Optical Transceivers Industry Revenue (Million), by Application 2024 & 2032
- Figure 35: Asia Optical Transceivers Industry Revenue Share (%), by Application 2024 & 2032
- Figure 36: Asia Optical Transceivers Industry Revenue (Million), by Country 2024 & 2032
- Figure 37: Asia Optical Transceivers Industry Revenue Share (%), by Country 2024 & 2032
- Figure 38: Australia and New Zealand Optical Transceivers Industry Revenue (Million), by Protocol 2024 & 2032
- Figure 39: Australia and New Zealand Optical Transceivers Industry Revenue Share (%), by Protocol 2024 & 2032
- Figure 40: Australia and New Zealand Optical Transceivers Industry Revenue (Million), by Data Rate 2024 & 2032
- Figure 41: Australia and New Zealand Optical Transceivers Industry Revenue Share (%), by Data Rate 2024 & 2032
- Figure 42: Australia and New Zealand Optical Transceivers Industry Revenue (Million), by Application 2024 & 2032
- Figure 43: Australia and New Zealand Optical Transceivers Industry Revenue Share (%), by Application 2024 & 2032
- Figure 44: Australia and New Zealand Optical Transceivers Industry Revenue (Million), by Country 2024 & 2032
- Figure 45: Australia and New Zealand Optical Transceivers Industry Revenue Share (%), by Country 2024 & 2032
- Figure 46: Latin America Optical Transceivers Industry Revenue (Million), by Protocol 2024 & 2032
- Figure 47: Latin America Optical Transceivers Industry Revenue Share (%), by Protocol 2024 & 2032
- Figure 48: Latin America Optical Transceivers Industry Revenue (Million), by Data Rate 2024 & 2032
- Figure 49: Latin America Optical Transceivers Industry Revenue Share (%), by Data Rate 2024 & 2032
- Figure 50: Latin America Optical Transceivers Industry Revenue (Million), by Application 2024 & 2032
- Figure 51: Latin America Optical Transceivers Industry Revenue Share (%), by Application 2024 & 2032
- Figure 52: Latin America Optical Transceivers Industry Revenue (Million), by Country 2024 & 2032
- Figure 53: Latin America Optical Transceivers Industry Revenue Share (%), by Country 2024 & 2032
- Figure 54: Middle East and Africa Optical Transceivers Industry Revenue (Million), by Protocol 2024 & 2032
- Figure 55: Middle East and Africa Optical Transceivers Industry Revenue Share (%), by Protocol 2024 & 2032
- Figure 56: Middle East and Africa Optical Transceivers Industry Revenue (Million), by Data Rate 2024 & 2032
- Figure 57: Middle East and Africa Optical Transceivers Industry Revenue Share (%), by Data Rate 2024 & 2032
- Figure 58: Middle East and Africa Optical Transceivers Industry Revenue (Million), by Application 2024 & 2032
- Figure 59: Middle East and Africa Optical Transceivers Industry Revenue Share (%), by Application 2024 & 2032
- Figure 60: Middle East and Africa Optical Transceivers Industry Revenue (Million), by Country 2024 & 2032
- Figure 61: Middle East and Africa Optical Transceivers Industry Revenue Share (%), by Country 2024 & 2032
List of Tables
- Table 1: Global Optical Transceivers Industry Revenue Million Forecast, by Region 2019 & 2032
- Table 2: Global Optical Transceivers Industry Revenue Million Forecast, by Protocol 2019 & 2032
- Table 3: Global Optical Transceivers Industry Revenue Million Forecast, by Data Rate 2019 & 2032
- Table 4: Global Optical Transceivers Industry Revenue Million Forecast, by Application 2019 & 2032
- Table 5: Global Optical Transceivers Industry Revenue Million Forecast, by Region 2019 & 2032
- Table 6: Global Optical Transceivers Industry Revenue Million Forecast, by Country 2019 & 2032
- Table 7: United States Optical Transceivers Industry Revenue (Million) Forecast, by Application 2019 & 2032
- Table 8: Canada Optical Transceivers Industry Revenue (Million) Forecast, by Application 2019 & 2032
- Table 9: Mexico Optical Transceivers Industry Revenue (Million) Forecast, by Application 2019 & 2032
- Table 10: Global Optical Transceivers Industry Revenue Million Forecast, by Country 2019 & 2032
- Table 11: Germany Optical Transceivers Industry Revenue (Million) Forecast, by Application 2019 & 2032
- Table 12: United Kingdom Optical Transceivers Industry Revenue (Million) Forecast, by Application 2019 & 2032
- Table 13: France Optical Transceivers Industry Revenue (Million) Forecast, by Application 2019 & 2032
- Table 14: Spain Optical Transceivers Industry Revenue (Million) Forecast, by Application 2019 & 2032
- Table 15: Italy Optical Transceivers Industry Revenue (Million) Forecast, by Application 2019 & 2032
- Table 16: Spain Optical Transceivers Industry Revenue (Million) Forecast, by Application 2019 & 2032
- Table 17: Belgium Optical Transceivers Industry Revenue (Million) Forecast, by Application 2019 & 2032
- Table 18: Netherland Optical Transceivers Industry Revenue (Million) Forecast, by Application 2019 & 2032
- Table 19: Nordics Optical Transceivers Industry Revenue (Million) Forecast, by Application 2019 & 2032
- Table 20: Rest of Europe Optical Transceivers Industry Revenue (Million) Forecast, by Application 2019 & 2032
- Table 21: Global Optical Transceivers Industry Revenue Million Forecast, by Country 2019 & 2032
- Table 22: China Optical Transceivers Industry Revenue (Million) Forecast, by Application 2019 & 2032
- Table 23: Japan Optical Transceivers Industry Revenue (Million) Forecast, by Application 2019 & 2032
- Table 24: India Optical Transceivers Industry Revenue (Million) Forecast, by Application 2019 & 2032
- Table 25: South Korea Optical Transceivers Industry Revenue (Million) Forecast, by Application 2019 & 2032
- Table 26: Southeast Asia Optical Transceivers Industry Revenue (Million) Forecast, by Application 2019 & 2032
- Table 27: Australia Optical Transceivers Industry Revenue (Million) Forecast, by Application 2019 & 2032
- Table 28: Indonesia Optical Transceivers Industry Revenue (Million) Forecast, by Application 2019 & 2032
- Table 29: Phillipes Optical Transceivers Industry Revenue (Million) Forecast, by Application 2019 & 2032
- Table 30: Singapore Optical Transceivers Industry Revenue (Million) Forecast, by Application 2019 & 2032
- Table 31: Thailandc Optical Transceivers Industry Revenue (Million) Forecast, by Application 2019 & 2032
- Table 32: Rest of Asia Pacific Optical Transceivers Industry Revenue (Million) Forecast, by Application 2019 & 2032
- Table 33: Global Optical Transceivers Industry Revenue Million Forecast, by Country 2019 & 2032
- Table 34: Brazil Optical Transceivers Industry Revenue (Million) Forecast, by Application 2019 & 2032
- Table 35: Argentina Optical Transceivers Industry Revenue (Million) Forecast, by Application 2019 & 2032
- Table 36: Peru Optical Transceivers Industry Revenue (Million) Forecast, by Application 2019 & 2032
- Table 37: Chile Optical Transceivers Industry Revenue (Million) Forecast, by Application 2019 & 2032
- Table 38: Colombia Optical Transceivers Industry Revenue (Million) Forecast, by Application 2019 & 2032
- Table 39: Ecuador Optical Transceivers Industry Revenue (Million) Forecast, by Application 2019 & 2032
- Table 40: Venezuela Optical Transceivers Industry Revenue (Million) Forecast, by Application 2019 & 2032
- Table 41: Rest of South America Optical Transceivers Industry Revenue (Million) Forecast, by Application 2019 & 2032
- Table 42: Global Optical Transceivers Industry Revenue Million Forecast, by Country 2019 & 2032
- Table 43: United States Optical Transceivers Industry Revenue (Million) Forecast, by Application 2019 & 2032
- Table 44: Canada Optical Transceivers Industry Revenue (Million) Forecast, by Application 2019 & 2032
- Table 45: Mexico Optical Transceivers Industry Revenue (Million) Forecast, by Application 2019 & 2032
- Table 46: Global Optical Transceivers Industry Revenue Million Forecast, by Country 2019 & 2032
- Table 47: United Arab Emirates Optical Transceivers Industry Revenue (Million) Forecast, by Application 2019 & 2032
- Table 48: Saudi Arabia Optical Transceivers Industry Revenue (Million) Forecast, by Application 2019 & 2032
- Table 49: South Africa Optical Transceivers Industry Revenue (Million) Forecast, by Application 2019 & 2032
- Table 50: Rest of Middle East and Africa Optical Transceivers Industry Revenue (Million) Forecast, by Application 2019 & 2032
- Table 51: Global Optical Transceivers Industry Revenue Million Forecast, by Protocol 2019 & 2032
- Table 52: Global Optical Transceivers Industry Revenue Million Forecast, by Data Rate 2019 & 2032
- Table 53: Global Optical Transceivers Industry Revenue Million Forecast, by Application 2019 & 2032
- Table 54: Global Optical Transceivers Industry Revenue Million Forecast, by Country 2019 & 2032
- Table 55: Global Optical Transceivers Industry Revenue Million Forecast, by Protocol 2019 & 2032
- Table 56: Global Optical Transceivers Industry Revenue Million Forecast, by Data Rate 2019 & 2032
- Table 57: Global Optical Transceivers Industry Revenue Million Forecast, by Application 2019 & 2032
- Table 58: Global Optical Transceivers Industry Revenue Million Forecast, by Country 2019 & 2032
- Table 59: Global Optical Transceivers Industry Revenue Million Forecast, by Protocol 2019 & 2032
- Table 60: Global Optical Transceivers Industry Revenue Million Forecast, by Data Rate 2019 & 2032
- Table 61: Global Optical Transceivers Industry Revenue Million Forecast, by Application 2019 & 2032
- Table 62: Global Optical Transceivers Industry Revenue Million Forecast, by Country 2019 & 2032
- Table 63: Global Optical Transceivers Industry Revenue Million Forecast, by Protocol 2019 & 2032
- Table 64: Global Optical Transceivers Industry Revenue Million Forecast, by Data Rate 2019 & 2032
- Table 65: Global Optical Transceivers Industry Revenue Million Forecast, by Application 2019 & 2032
- Table 66: Global Optical Transceivers Industry Revenue Million Forecast, by Country 2019 & 2032
- Table 67: Global Optical Transceivers Industry Revenue Million Forecast, by Protocol 2019 & 2032
- Table 68: Global Optical Transceivers Industry Revenue Million Forecast, by Data Rate 2019 & 2032
- Table 69: Global Optical Transceivers Industry Revenue Million Forecast, by Application 2019 & 2032
- Table 70: Global Optical Transceivers Industry Revenue Million Forecast, by Country 2019 & 2032
- Table 71: Global Optical Transceivers Industry Revenue Million Forecast, by Protocol 2019 & 2032
- Table 72: Global Optical Transceivers Industry Revenue Million Forecast, by Data Rate 2019 & 2032
- Table 73: Global Optical Transceivers Industry Revenue Million Forecast, by Application 2019 & 2032
- Table 74: Global Optical Transceivers Industry Revenue Million Forecast, by Country 2019 & 2032
Frequently Asked Questions
1. What is the projected Compound Annual Growth Rate (CAGR) of the Optical Transceivers Industry?
The projected CAGR is approximately 13.09%.
2. Which companies are prominent players in the Optical Transceivers Industry?
Key companies in the market include Coherent Corp (II-VI Incorporated), Lumentum Operations LLC (Lumentum Holdings), Broadcom Inc, Accelink Technologies, Fujitsu Optical Components Limited (Fujitsu Ltd), Huawei Technologies Co Ltd, Source Photonics (Redview Capital), HUBER+SUHNER Cube Optics, Smiths Interconnect (Reflex Photonics Inc ), Sumitomo Electric Industries Ltd.
3. What are the main segments of the Optical Transceivers Industry?
The market segments include Protocol, Data Rate, Application.
4. Can you provide details about the market size?
The market size is estimated to be USD 13.34 Million as of 2022.
5. What are some drivers contributing to market growth?
Increasing Need for Advanced Communication; Increasing Demand for Cloud-based Services.
6. What are the notable trends driving market growth?
Data Centers to the Fastest Growing Application for Optical Transceivers.
7. Are there any restraints impacting market growth?
Increase in Network Complexity.
8. Can you provide examples of recent developments in the market?
October 2023: Broadcom and Semtech Corporation announced the demonstration of a 200 G/lane optical transceiver at the ECOC 2023, featuring Semtech’s latest Fiberdge 200 G PAM4 PMDs and Broadcom’s latest generation DSP PHY and single-mode optics.
9. What pricing options are available for accessing the report?
Pricing options include single-user, multi-user, and enterprise licenses priced at USD 4750, USD 5250, and USD 8750 respectively.
10. Is the market size provided in terms of value or volume?
The market size is provided in terms of value, measured in Million.
11. Are there any specific market keywords associated with the report?
Yes, the market keyword associated with the report is "Optical Transceivers Industry," which aids in identifying and referencing the specific market segment covered.
12. How do I determine which pricing option suits my needs best?
The pricing options vary based on user requirements and access needs. Individual users may opt for single-user licenses, while businesses requiring broader access may choose multi-user or enterprise licenses for cost-effective access to the report.
13. Are there any additional resources or data provided in the Optical Transceivers Industry report?
While the report offers comprehensive insights, it's advisable to review the specific contents or supplementary materials provided to ascertain if additional resources or data are available.
14. How can I stay updated on further developments or reports in the Optical Transceivers Industry?
To stay informed about further developments, trends, and reports in the Optical Transceivers Industry, consider subscribing to industry newsletters, following relevant companies and organizations, or regularly checking reputable industry news sources and publications.
Methodology
Step 1 - Identification of Relevant Samples Size from Population Database


Step 2 - Approaches for Defining Global Market Size (Value, Volume* & Price*)

Note*: In applicable scenarios
Step 3 - Data Sources
Primary Research
- Web Analytics
- Survey Reports
- Research Institute
- Latest Research Reports
- Opinion Leaders
Secondary Research
- Annual Reports
- White Paper
- Latest Press Release
- Industry Association
- Paid Database
- Investor Presentations

Step 4 - Data Triangulation
Involves using different sources of information in order to increase the validity of a study
These sources are likely to be stakeholders in a program - participants, other researchers, program staff, other community members, and so on.
Then we put all data in single framework & apply various statistical tools to find out the dynamic on the market.
During the analysis stage, feedback from the stakeholder groups would be compared to determine areas of agreement as well as areas of divergence


