
Key Insights
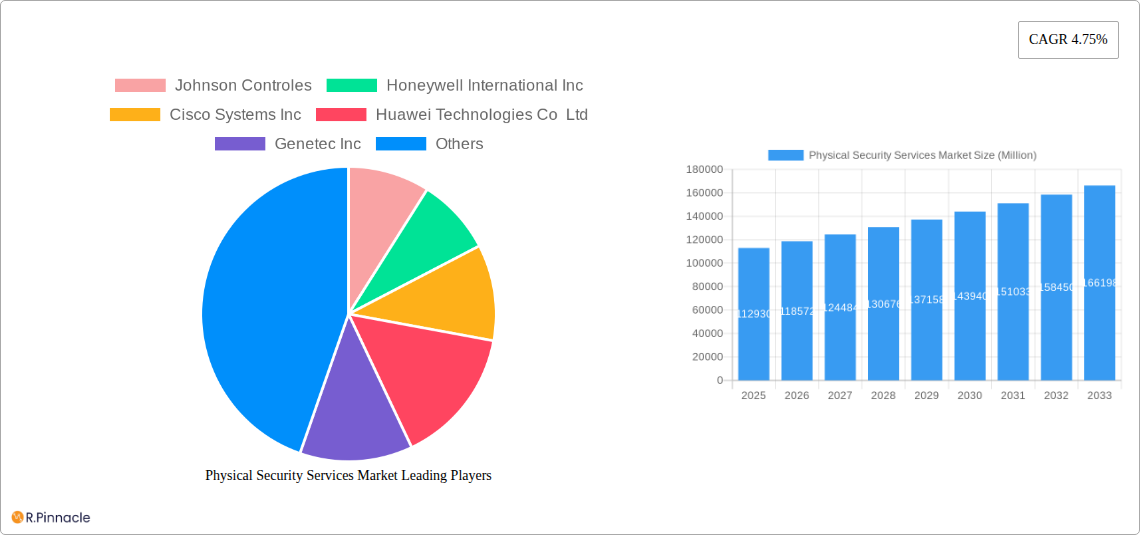
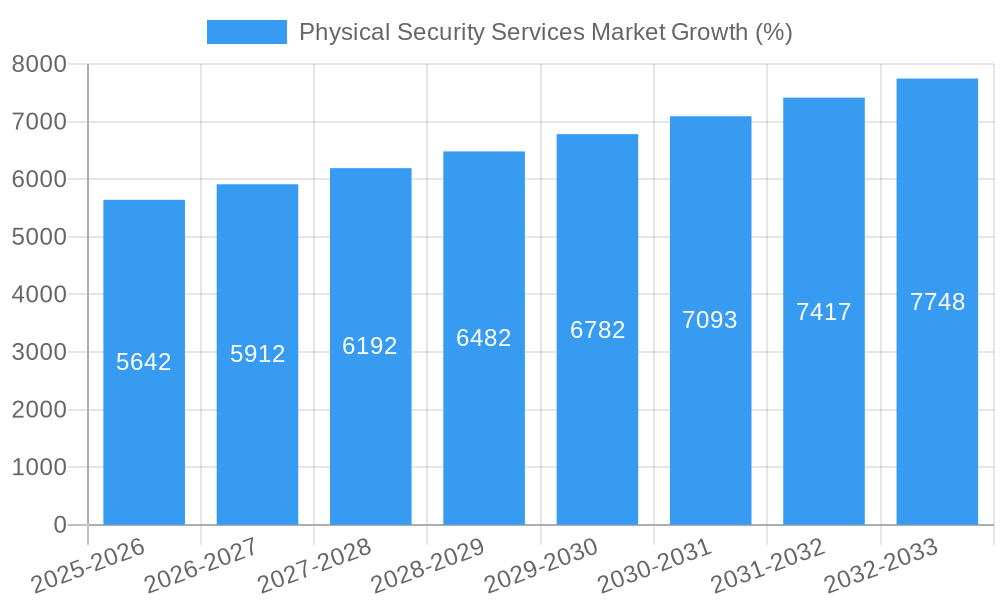
The global Physical Security Services market, valued at $112.93 billion in 2025, is projected to experience robust growth, driven by escalating security concerns across various sectors. The Compound Annual Growth Rate (CAGR) of 4.75% from 2025 to 2033 indicates a significant expansion, reaching an estimated market size of approximately $168 billion by 2033. This growth is fueled by increasing adoption of advanced security technologies like video surveillance, access control systems, and intrusion detection, particularly in response to rising cyber threats and terrorist activities. The market is segmented by service type (e.g., guarding, monitoring, consulting), technology (e.g., CCTV, biometrics), and end-user (e.g., government, commercial, residential). Major players like Johnson Controls, Honeywell, and Cisco are driving innovation and market consolidation through technological advancements and strategic acquisitions. The increasing demand for integrated security solutions and managed security services further contributes to market expansion.
However, market growth faces some challenges. The high initial investment costs associated with implementing sophisticated security systems can be a barrier to entry for smaller businesses. Furthermore, the industry faces regulatory complexities and the need for skilled personnel, potentially limiting growth in certain regions. Nevertheless, the increasing awareness of cybersecurity risks and the growing need for robust security measures across diverse industries, coupled with technological advancements in AI and IoT-enabled security, are expected to propel the market's growth trajectory in the coming years. The competitive landscape is characterized by both large multinational corporations and specialized regional providers, leading to a dynamic and evolving market structure.
Physical Security Services Market Report: 2019-2033
This comprehensive report provides an in-depth analysis of the Physical Security Services Market, offering valuable insights for industry professionals, investors, and strategic decision-makers. Covering the period from 2019 to 2033 (Study Period: 2019–2033, Base Year: 2025, Estimated Year: 2025, Forecast Period: 2025–2033, Historical Period: 2019–2024), this report meticulously examines market dynamics, segmentation, leading players, and future growth opportunities. With a focus on actionable intelligence, this report empowers you to navigate the evolving landscape of physical security and capitalize on emerging trends. The market is valued at xx Million in 2025 and is projected to reach xx Million by 2033, exhibiting a CAGR of xx%.
Physical Security Services Market Market Structure & Innovation Trends
The Physical Security Services Market is characterized by a moderately concentrated landscape, with key players like Johnson Controls, Honeywell International Inc, Cisco Systems Inc, Huawei Technologies Co Ltd, and Genetec Inc holding significant market share. The exact market share distribution for 2025 is currently under analysis but will be available in the final report. Innovation is driven by factors such as increasing demand for advanced security solutions, stringent regulatory frameworks, and the rise of IoT and AI technologies. Product substitutes, such as software-based security systems, pose a competitive challenge, although traditional physical security services maintain considerable relevance. The market also experiences considerable M&A activity; for instance, in 2023, the total value of M&A deals in this space reached approximately xx Million. End-user demographics are diverse, encompassing government agencies, commercial businesses, and residential properties.
- Market Concentration: Moderately Concentrated
- Innovation Drivers: IoT, AI, regulatory compliance
- M&A Activity: Significant, with deal values exceeding xx Million in 2023 (specific numbers available in full report)
- Product Substitutes: Software-based security systems
- End-User Demographics: Diverse – Government, Commercial, Residential
Physical Security Services Market Market Dynamics & Trends
The Physical Security Services Market is experiencing robust growth, driven by factors such as rising security concerns, increasing adoption of advanced technologies like video analytics and biometric authentication, and the growing demand for integrated security solutions. Technological disruptions, particularly the proliferation of cloud-based security platforms and AI-powered threat detection systems, are reshaping the market landscape. Consumer preferences are shifting towards more user-friendly, efficient, and cost-effective solutions. Competitive dynamics are intense, with established players focusing on innovation and strategic partnerships while new entrants leverage disruptive technologies to gain market share. Market penetration of advanced security systems like AI-based surveillance is increasing, with an estimated xx% penetration rate in 2025.
Dominant Regions & Segments in Physical Security Services Market
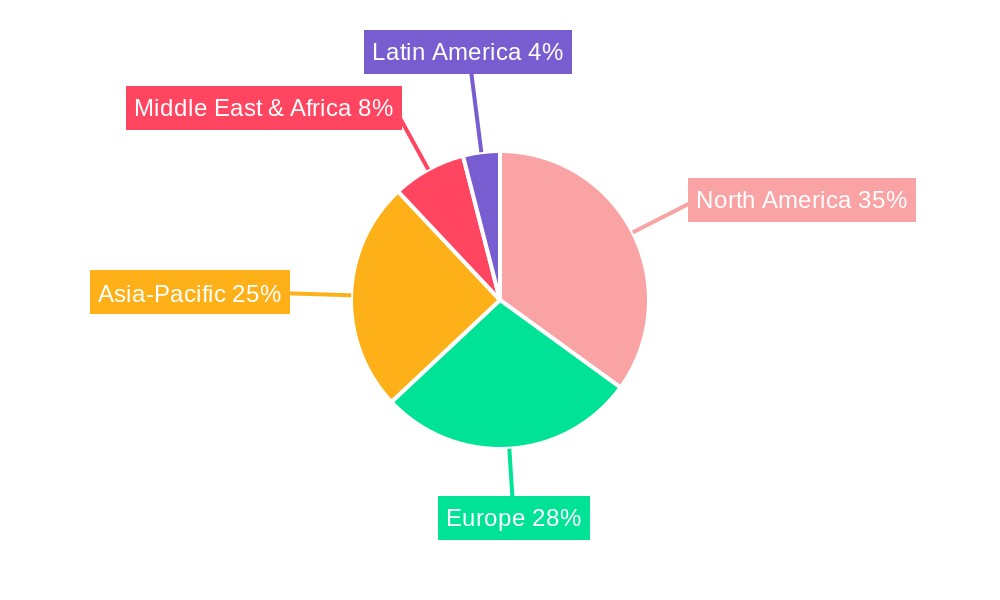
North America currently holds the largest share of the Physical Security Services Market, driven by factors such as robust economic growth, substantial investments in infrastructure security, and the presence of major technology players.
- North America:
- Strong economic growth
- High investment in infrastructure security
- Presence of major technology companies
- Stringent regulatory environment driving adoption.
Europe and Asia-Pacific also represent significant markets, with growth driven by factors specific to each region (detailed in the full report). Within market segments, video surveillance and access control are the largest segments, followed by intrusion detection and perimeter security (exact market size for each segment available in the full report).
Physical Security Services Market Product Innovations
Recent product innovations focus on integrating AI, machine learning, and IoT technologies to enhance security system effectiveness and efficiency. This includes advanced video analytics for improved threat detection, AI-powered access control systems, and smart locks that offer enhanced convenience and security. These innovations aim to meet the growing demand for more sophisticated, user-friendly, and integrated security solutions.
Report Scope & Segmentation Analysis
This report provides a comprehensive segmentation of the Physical Security Services Market, encompassing various segments based on service type (e.g., video surveillance, access control, intrusion detection, perimeter security, others), deployment type (cloud-based, on-premise), end-user (government, commercial, residential), and region (North America, Europe, Asia-Pacific, Middle East & Africa, South America). Each segment's market size, growth projections, and competitive landscape are thoroughly analyzed. For example, the video surveillance segment is estimated at xx Million in 2025, projected to grow at a CAGR of xx% (specific numbers for all segments in full report).
Key Drivers of Physical Security Services Market Growth
Several key factors are driving the growth of the Physical Security Services Market. These include:
- Increased Security Concerns: Global rise in crime and terrorism driving demand for enhanced security solutions.
- Technological Advancements: The development of AI-powered and IoT-integrated security systems is expanding market potential.
- Government Regulations: Stringent security regulations in various sectors are pushing adoption of advanced security measures.
- Growing Urbanization: The expansion of cities increases the demand for reliable and robust security infrastructure.
Challenges in the Physical Security Services Market Sector
The Physical Security Services Market faces several challenges, including:
- High Initial Investment Costs: The implementation of advanced security systems can be expensive, hindering adoption, particularly for smaller businesses.
- Cybersecurity Threats: Vulnerabilities in security systems can lead to data breaches and other security incidents.
- Integration Complexity: Integrating various security systems can be challenging, requiring specialized expertise.
- Lack of Skilled Professionals: A shortage of skilled professionals limits efficient system installation and maintenance.
Emerging Opportunities in Physical Security Services Market
Emerging opportunities in the market include:
- Growth of Smart Cities: Smart city initiatives are creating demand for comprehensive security solutions across various urban infrastructure components.
- Expansion of IoT and AI technologies: Integration of these technologies in security systems will create more efficient and intelligent solutions.
- Rising Demand for Cybersecurity Integration: The convergence of physical and cybersecurity solutions opens new avenues for market expansion.
Leading Players in the Physical Security Services Market Market
- Johnson Controls
- Honeywell International Inc
- Cisco Systems Inc
- Huawei Technologies Co Ltd
- Genetec Inc
- G4S
- Securitas
- Secom
- Prosegur
- Brinks
- Loomis
- Allied Barton
- Garda
- Relianc
Key Developments in Physical Security Services Market Industry
- May 2024: ZKTeco East Africa partnered with Mart Networks Group Ltd, showcasing new time and attendance, access control, smart locks, and video surveillance solutions. This partnership expands ZKTeco's market reach and highlights the demand for integrated security solutions.
- February 2024: ENSCO Inc. launched the Center for Critical Infrastructure Protection (CCIP), focusing on comprehensive cyber and physical security solutions for the Department of Defense (DoD). This signifies the increasing convergence of physical and cybersecurity and the growing need for integrated solutions within critical infrastructure.
Future Outlook for Physical Security Services Market Market
The Physical Security Services Market is poised for continued growth, driven by technological advancements, increasing security concerns, and the growing adoption of integrated security solutions across diverse sectors. Strategic partnerships, investments in R&D, and expansion into new markets will play key roles in shaping the future landscape of the industry. The market's evolution towards more intelligent, automated, and integrated systems will drive further innovation and market expansion.
Physical Security Services Market Segmentation
-
1. Component
-
1.1. By Solution
- 1.1.1. Access Control System
- 1.1.2. Video Surveillance System
- 1.1.3. Security Scanning, Metal Detection, and Imaging
- 1.1.4. Fire and Life Safety
- 1.1.5. Others
-
1.2. By Service Type
- 1.2.1. Professional Services
- 1.2.2. Managed Services
-
1.1. By Solution
-
2. End User Industry
- 2.1. Manufacturing and Industrial
- 2.2. IT and Telecom
- 2.3. BFSI
- 2.4. Retail
- 2.5. Residential
- 2.6. Public Infrastructure (Airports, etc.)
- 2.7. Other End Users
Physical Security Services Market Segmentation By Geography
- 1. North America
- 2. Europe
- 3. Asia
- 4. Australia and New Zealand
- 5. Latin America
- 6. Middle East and Africa
Physical Security Services Market REPORT HIGHLIGHTS
| Aspects | Details |
|---|---|
| Study Period | 2019-2033 |
| Base Year | 2024 |
| Estimated Year | 2025 |
| Forecast Period | 2025-2033 |
| Historical Period | 2019-2024 |
| Growth Rate | CAGR of 4.75% from 2019-2033 |
| Segmentation |
|
Table of Contents
- 1. Introduction
- 1.1. Research Scope
- 1.2. Market Segmentation
- 1.3. Research Methodology
- 1.4. Definitions and Assumptions
- 2. Executive Summary
- 2.1. Introduction
- 3. Market Dynamics
- 3.1. Introduction
- 3.2. Market Drivers
- 3.2.1 Favorable Changes in Regulatory Standards have Prompted the Use of Security Services from the Organized Sector; Dynamic Nature of the Security Threats
- 3.2.2 Especially
- 3.2.3 has Contributed the Demand for Cash Services to Safeguard Cash Transit
- 3.3. Market Restrains
- 3.3.1 Favorable Changes in Regulatory Standards have Prompted the Use of Security Services from the Organized Sector; Dynamic Nature of the Security Threats
- 3.3.2 Especially
- 3.3.3 has Contributed the Demand for Cash Services to Safeguard Cash Transit
- 3.4. Market Trends
- 3.4.1. The Demand for Physical Security Services is Growing in the BSFI Sector
- 4. Market Factor Analysis
- 4.1. Porters Five Forces
- 4.2. Supply/Value Chain
- 4.3. PESTEL analysis
- 4.4. Market Entropy
- 4.5. Patent/Trademark Analysis
- 5. Global Physical Security Services Market Analysis, Insights and Forecast, 2019-2031
- 5.1. Market Analysis, Insights and Forecast - by Component
- 5.1.1. By Solution
- 5.1.1.1. Access Control System
- 5.1.1.2. Video Surveillance System
- 5.1.1.3. Security Scanning, Metal Detection, and Imaging
- 5.1.1.4. Fire and Life Safety
- 5.1.1.5. Others
- 5.1.2. By Service Type
- 5.1.2.1. Professional Services
- 5.1.2.2. Managed Services
- 5.1.1. By Solution
- 5.2. Market Analysis, Insights and Forecast - by End User Industry
- 5.2.1. Manufacturing and Industrial
- 5.2.2. IT and Telecom
- 5.2.3. BFSI
- 5.2.4. Retail
- 5.2.5. Residential
- 5.2.6. Public Infrastructure (Airports, etc.)
- 5.2.7. Other End Users
- 5.3. Market Analysis, Insights and Forecast - by Region
- 5.3.1. North America
- 5.3.2. Europe
- 5.3.3. Asia
- 5.3.4. Australia and New Zealand
- 5.3.5. Latin America
- 5.3.6. Middle East and Africa
- 5.1. Market Analysis, Insights and Forecast - by Component
- 6. North America Physical Security Services Market Analysis, Insights and Forecast, 2019-2031
- 6.1. Market Analysis, Insights and Forecast - by Component
- 6.1.1. By Solution
- 6.1.1.1. Access Control System
- 6.1.1.2. Video Surveillance System
- 6.1.1.3. Security Scanning, Metal Detection, and Imaging
- 6.1.1.4. Fire and Life Safety
- 6.1.1.5. Others
- 6.1.2. By Service Type
- 6.1.2.1. Professional Services
- 6.1.2.2. Managed Services
- 6.1.1. By Solution
- 6.2. Market Analysis, Insights and Forecast - by End User Industry
- 6.2.1. Manufacturing and Industrial
- 6.2.2. IT and Telecom
- 6.2.3. BFSI
- 6.2.4. Retail
- 6.2.5. Residential
- 6.2.6. Public Infrastructure (Airports, etc.)
- 6.2.7. Other End Users
- 6.1. Market Analysis, Insights and Forecast - by Component
- 7. Europe Physical Security Services Market Analysis, Insights and Forecast, 2019-2031
- 7.1. Market Analysis, Insights and Forecast - by Component
- 7.1.1. By Solution
- 7.1.1.1. Access Control System
- 7.1.1.2. Video Surveillance System
- 7.1.1.3. Security Scanning, Metal Detection, and Imaging
- 7.1.1.4. Fire and Life Safety
- 7.1.1.5. Others
- 7.1.2. By Service Type
- 7.1.2.1. Professional Services
- 7.1.2.2. Managed Services
- 7.1.1. By Solution
- 7.2. Market Analysis, Insights and Forecast - by End User Industry
- 7.2.1. Manufacturing and Industrial
- 7.2.2. IT and Telecom
- 7.2.3. BFSI
- 7.2.4. Retail
- 7.2.5. Residential
- 7.2.6. Public Infrastructure (Airports, etc.)
- 7.2.7. Other End Users
- 7.1. Market Analysis, Insights and Forecast - by Component
- 8. Asia Physical Security Services Market Analysis, Insights and Forecast, 2019-2031
- 8.1. Market Analysis, Insights and Forecast - by Component
- 8.1.1. By Solution
- 8.1.1.1. Access Control System
- 8.1.1.2. Video Surveillance System
- 8.1.1.3. Security Scanning, Metal Detection, and Imaging
- 8.1.1.4. Fire and Life Safety
- 8.1.1.5. Others
- 8.1.2. By Service Type
- 8.1.2.1. Professional Services
- 8.1.2.2. Managed Services
- 8.1.1. By Solution
- 8.2. Market Analysis, Insights and Forecast - by End User Industry
- 8.2.1. Manufacturing and Industrial
- 8.2.2. IT and Telecom
- 8.2.3. BFSI
- 8.2.4. Retail
- 8.2.5. Residential
- 8.2.6. Public Infrastructure (Airports, etc.)
- 8.2.7. Other End Users
- 8.1. Market Analysis, Insights and Forecast - by Component
- 9. Australia and New Zealand Physical Security Services Market Analysis, Insights and Forecast, 2019-2031
- 9.1. Market Analysis, Insights and Forecast - by Component
- 9.1.1. By Solution
- 9.1.1.1. Access Control System
- 9.1.1.2. Video Surveillance System
- 9.1.1.3. Security Scanning, Metal Detection, and Imaging
- 9.1.1.4. Fire and Life Safety
- 9.1.1.5. Others
- 9.1.2. By Service Type
- 9.1.2.1. Professional Services
- 9.1.2.2. Managed Services
- 9.1.1. By Solution
- 9.2. Market Analysis, Insights and Forecast - by End User Industry
- 9.2.1. Manufacturing and Industrial
- 9.2.2. IT and Telecom
- 9.2.3. BFSI
- 9.2.4. Retail
- 9.2.5. Residential
- 9.2.6. Public Infrastructure (Airports, etc.)
- 9.2.7. Other End Users
- 9.1. Market Analysis, Insights and Forecast - by Component
- 10. Latin America Physical Security Services Market Analysis, Insights and Forecast, 2019-2031
- 10.1. Market Analysis, Insights and Forecast - by Component
- 10.1.1. By Solution
- 10.1.1.1. Access Control System
- 10.1.1.2. Video Surveillance System
- 10.1.1.3. Security Scanning, Metal Detection, and Imaging
- 10.1.1.4. Fire and Life Safety
- 10.1.1.5. Others
- 10.1.2. By Service Type
- 10.1.2.1. Professional Services
- 10.1.2.2. Managed Services
- 10.1.1. By Solution
- 10.2. Market Analysis, Insights and Forecast - by End User Industry
- 10.2.1. Manufacturing and Industrial
- 10.2.2. IT and Telecom
- 10.2.3. BFSI
- 10.2.4. Retail
- 10.2.5. Residential
- 10.2.6. Public Infrastructure (Airports, etc.)
- 10.2.7. Other End Users
- 10.1. Market Analysis, Insights and Forecast - by Component
- 11. Middle East and Africa Physical Security Services Market Analysis, Insights and Forecast, 2019-2031
- 11.1. Market Analysis, Insights and Forecast - by Component
- 11.1.1. By Solution
- 11.1.1.1. Access Control System
- 11.1.1.2. Video Surveillance System
- 11.1.1.3. Security Scanning, Metal Detection, and Imaging
- 11.1.1.4. Fire and Life Safety
- 11.1.1.5. Others
- 11.1.2. By Service Type
- 11.1.2.1. Professional Services
- 11.1.2.2. Managed Services
- 11.1.1. By Solution
- 11.2. Market Analysis, Insights and Forecast - by End User Industry
- 11.2.1. Manufacturing and Industrial
- 11.2.2. IT and Telecom
- 11.2.3. BFSI
- 11.2.4. Retail
- 11.2.5. Residential
- 11.2.6. Public Infrastructure (Airports, etc.)
- 11.2.7. Other End Users
- 11.1. Market Analysis, Insights and Forecast - by Component
- 12. Competitive Analysis
- 12.1. Global Market Share Analysis 2024
- 12.2. Company Profiles
- 12.2.1 Johnson Controles
- 12.2.1.1. Overview
- 12.2.1.2. Products
- 12.2.1.3. SWOT Analysis
- 12.2.1.4. Recent Developments
- 12.2.1.5. Financials (Based on Availability)
- 12.2.2 Honeywell International Inc
- 12.2.2.1. Overview
- 12.2.2.2. Products
- 12.2.2.3. SWOT Analysis
- 12.2.2.4. Recent Developments
- 12.2.2.5. Financials (Based on Availability)
- 12.2.3 Cisco Systems Inc
- 12.2.3.1. Overview
- 12.2.3.2. Products
- 12.2.3.3. SWOT Analysis
- 12.2.3.4. Recent Developments
- 12.2.3.5. Financials (Based on Availability)
- 12.2.4 Huawei Technologies Co Ltd
- 12.2.4.1. Overview
- 12.2.4.2. Products
- 12.2.4.3. SWOT Analysis
- 12.2.4.4. Recent Developments
- 12.2.4.5. Financials (Based on Availability)
- 12.2.5 Genetec Inc
- 12.2.5.1. Overview
- 12.2.5.2. Products
- 12.2.5.3. SWOT Analysis
- 12.2.5.4. Recent Developments
- 12.2.5.5. Financials (Based on Availability)
- 12.2.6 G4S
- 12.2.6.1. Overview
- 12.2.6.2. Products
- 12.2.6.3. SWOT Analysis
- 12.2.6.4. Recent Developments
- 12.2.6.5. Financials (Based on Availability)
- 12.2.7 Securitas
- 12.2.7.1. Overview
- 12.2.7.2. Products
- 12.2.7.3. SWOT Analysis
- 12.2.7.4. Recent Developments
- 12.2.7.5. Financials (Based on Availability)
- 12.2.8 Secom
- 12.2.8.1. Overview
- 12.2.8.2. Products
- 12.2.8.3. SWOT Analysis
- 12.2.8.4. Recent Developments
- 12.2.8.5. Financials (Based on Availability)
- 12.2.9 Prosegur
- 12.2.9.1. Overview
- 12.2.9.2. Products
- 12.2.9.3. SWOT Analysis
- 12.2.9.4. Recent Developments
- 12.2.9.5. Financials (Based on Availability)
- 12.2.10 Brinks
- 12.2.10.1. Overview
- 12.2.10.2. Products
- 12.2.10.3. SWOT Analysis
- 12.2.10.4. Recent Developments
- 12.2.10.5. Financials (Based on Availability)
- 12.2.11 Loomis
- 12.2.11.1. Overview
- 12.2.11.2. Products
- 12.2.11.3. SWOT Analysis
- 12.2.11.4. Recent Developments
- 12.2.11.5. Financials (Based on Availability)
- 12.2.12 Allied Barton
- 12.2.12.1. Overview
- 12.2.12.2. Products
- 12.2.12.3. SWOT Analysis
- 12.2.12.4. Recent Developments
- 12.2.12.5. Financials (Based on Availability)
- 12.2.13 Garda
- 12.2.13.1. Overview
- 12.2.13.2. Products
- 12.2.13.3. SWOT Analysis
- 12.2.13.4. Recent Developments
- 12.2.13.5. Financials (Based on Availability)
- 12.2.14 Relianc
- 12.2.14.1. Overview
- 12.2.14.2. Products
- 12.2.14.3. SWOT Analysis
- 12.2.14.4. Recent Developments
- 12.2.14.5. Financials (Based on Availability)
- 12.2.1 Johnson Controles
List of Figures
- Figure 1: Global Physical Security Services Market Revenue Breakdown (Million, %) by Region 2024 & 2032
- Figure 2: Global Physical Security Services Market Volume Breakdown (Billion, %) by Region 2024 & 2032
- Figure 3: North America Physical Security Services Market Revenue (Million), by Component 2024 & 2032
- Figure 4: North America Physical Security Services Market Volume (Billion), by Component 2024 & 2032
- Figure 5: North America Physical Security Services Market Revenue Share (%), by Component 2024 & 2032
- Figure 6: North America Physical Security Services Market Volume Share (%), by Component 2024 & 2032
- Figure 7: North America Physical Security Services Market Revenue (Million), by End User Industry 2024 & 2032
- Figure 8: North America Physical Security Services Market Volume (Billion), by End User Industry 2024 & 2032
- Figure 9: North America Physical Security Services Market Revenue Share (%), by End User Industry 2024 & 2032
- Figure 10: North America Physical Security Services Market Volume Share (%), by End User Industry 2024 & 2032
- Figure 11: North America Physical Security Services Market Revenue (Million), by Country 2024 & 2032
- Figure 12: North America Physical Security Services Market Volume (Billion), by Country 2024 & 2032
- Figure 13: North America Physical Security Services Market Revenue Share (%), by Country 2024 & 2032
- Figure 14: North America Physical Security Services Market Volume Share (%), by Country 2024 & 2032
- Figure 15: Europe Physical Security Services Market Revenue (Million), by Component 2024 & 2032
- Figure 16: Europe Physical Security Services Market Volume (Billion), by Component 2024 & 2032
- Figure 17: Europe Physical Security Services Market Revenue Share (%), by Component 2024 & 2032
- Figure 18: Europe Physical Security Services Market Volume Share (%), by Component 2024 & 2032
- Figure 19: Europe Physical Security Services Market Revenue (Million), by End User Industry 2024 & 2032
- Figure 20: Europe Physical Security Services Market Volume (Billion), by End User Industry 2024 & 2032
- Figure 21: Europe Physical Security Services Market Revenue Share (%), by End User Industry 2024 & 2032
- Figure 22: Europe Physical Security Services Market Volume Share (%), by End User Industry 2024 & 2032
- Figure 23: Europe Physical Security Services Market Revenue (Million), by Country 2024 & 2032
- Figure 24: Europe Physical Security Services Market Volume (Billion), by Country 2024 & 2032
- Figure 25: Europe Physical Security Services Market Revenue Share (%), by Country 2024 & 2032
- Figure 26: Europe Physical Security Services Market Volume Share (%), by Country 2024 & 2032
- Figure 27: Asia Physical Security Services Market Revenue (Million), by Component 2024 & 2032
- Figure 28: Asia Physical Security Services Market Volume (Billion), by Component 2024 & 2032
- Figure 29: Asia Physical Security Services Market Revenue Share (%), by Component 2024 & 2032
- Figure 30: Asia Physical Security Services Market Volume Share (%), by Component 2024 & 2032
- Figure 31: Asia Physical Security Services Market Revenue (Million), by End User Industry 2024 & 2032
- Figure 32: Asia Physical Security Services Market Volume (Billion), by End User Industry 2024 & 2032
- Figure 33: Asia Physical Security Services Market Revenue Share (%), by End User Industry 2024 & 2032
- Figure 34: Asia Physical Security Services Market Volume Share (%), by End User Industry 2024 & 2032
- Figure 35: Asia Physical Security Services Market Revenue (Million), by Country 2024 & 2032
- Figure 36: Asia Physical Security Services Market Volume (Billion), by Country 2024 & 2032
- Figure 37: Asia Physical Security Services Market Revenue Share (%), by Country 2024 & 2032
- Figure 38: Asia Physical Security Services Market Volume Share (%), by Country 2024 & 2032
- Figure 39: Australia and New Zealand Physical Security Services Market Revenue (Million), by Component 2024 & 2032
- Figure 40: Australia and New Zealand Physical Security Services Market Volume (Billion), by Component 2024 & 2032
- Figure 41: Australia and New Zealand Physical Security Services Market Revenue Share (%), by Component 2024 & 2032
- Figure 42: Australia and New Zealand Physical Security Services Market Volume Share (%), by Component 2024 & 2032
- Figure 43: Australia and New Zealand Physical Security Services Market Revenue (Million), by End User Industry 2024 & 2032
- Figure 44: Australia and New Zealand Physical Security Services Market Volume (Billion), by End User Industry 2024 & 2032
- Figure 45: Australia and New Zealand Physical Security Services Market Revenue Share (%), by End User Industry 2024 & 2032
- Figure 46: Australia and New Zealand Physical Security Services Market Volume Share (%), by End User Industry 2024 & 2032
- Figure 47: Australia and New Zealand Physical Security Services Market Revenue (Million), by Country 2024 & 2032
- Figure 48: Australia and New Zealand Physical Security Services Market Volume (Billion), by Country 2024 & 2032
- Figure 49: Australia and New Zealand Physical Security Services Market Revenue Share (%), by Country 2024 & 2032
- Figure 50: Australia and New Zealand Physical Security Services Market Volume Share (%), by Country 2024 & 2032
- Figure 51: Latin America Physical Security Services Market Revenue (Million), by Component 2024 & 2032
- Figure 52: Latin America Physical Security Services Market Volume (Billion), by Component 2024 & 2032
- Figure 53: Latin America Physical Security Services Market Revenue Share (%), by Component 2024 & 2032
- Figure 54: Latin America Physical Security Services Market Volume Share (%), by Component 2024 & 2032
- Figure 55: Latin America Physical Security Services Market Revenue (Million), by End User Industry 2024 & 2032
- Figure 56: Latin America Physical Security Services Market Volume (Billion), by End User Industry 2024 & 2032
- Figure 57: Latin America Physical Security Services Market Revenue Share (%), by End User Industry 2024 & 2032
- Figure 58: Latin America Physical Security Services Market Volume Share (%), by End User Industry 2024 & 2032
- Figure 59: Latin America Physical Security Services Market Revenue (Million), by Country 2024 & 2032
- Figure 60: Latin America Physical Security Services Market Volume (Billion), by Country 2024 & 2032
- Figure 61: Latin America Physical Security Services Market Revenue Share (%), by Country 2024 & 2032
- Figure 62: Latin America Physical Security Services Market Volume Share (%), by Country 2024 & 2032
- Figure 63: Middle East and Africa Physical Security Services Market Revenue (Million), by Component 2024 & 2032
- Figure 64: Middle East and Africa Physical Security Services Market Volume (Billion), by Component 2024 & 2032
- Figure 65: Middle East and Africa Physical Security Services Market Revenue Share (%), by Component 2024 & 2032
- Figure 66: Middle East and Africa Physical Security Services Market Volume Share (%), by Component 2024 & 2032
- Figure 67: Middle East and Africa Physical Security Services Market Revenue (Million), by End User Industry 2024 & 2032
- Figure 68: Middle East and Africa Physical Security Services Market Volume (Billion), by End User Industry 2024 & 2032
- Figure 69: Middle East and Africa Physical Security Services Market Revenue Share (%), by End User Industry 2024 & 2032
- Figure 70: Middle East and Africa Physical Security Services Market Volume Share (%), by End User Industry 2024 & 2032
- Figure 71: Middle East and Africa Physical Security Services Market Revenue (Million), by Country 2024 & 2032
- Figure 72: Middle East and Africa Physical Security Services Market Volume (Billion), by Country 2024 & 2032
- Figure 73: Middle East and Africa Physical Security Services Market Revenue Share (%), by Country 2024 & 2032
- Figure 74: Middle East and Africa Physical Security Services Market Volume Share (%), by Country 2024 & 2032
List of Tables
- Table 1: Global Physical Security Services Market Revenue Million Forecast, by Region 2019 & 2032
- Table 2: Global Physical Security Services Market Volume Billion Forecast, by Region 2019 & 2032
- Table 3: Global Physical Security Services Market Revenue Million Forecast, by Component 2019 & 2032
- Table 4: Global Physical Security Services Market Volume Billion Forecast, by Component 2019 & 2032
- Table 5: Global Physical Security Services Market Revenue Million Forecast, by End User Industry 2019 & 2032
- Table 6: Global Physical Security Services Market Volume Billion Forecast, by End User Industry 2019 & 2032
- Table 7: Global Physical Security Services Market Revenue Million Forecast, by Region 2019 & 2032
- Table 8: Global Physical Security Services Market Volume Billion Forecast, by Region 2019 & 2032
- Table 9: Global Physical Security Services Market Revenue Million Forecast, by Component 2019 & 2032
- Table 10: Global Physical Security Services Market Volume Billion Forecast, by Component 2019 & 2032
- Table 11: Global Physical Security Services Market Revenue Million Forecast, by End User Industry 2019 & 2032
- Table 12: Global Physical Security Services Market Volume Billion Forecast, by End User Industry 2019 & 2032
- Table 13: Global Physical Security Services Market Revenue Million Forecast, by Country 2019 & 2032
- Table 14: Global Physical Security Services Market Volume Billion Forecast, by Country 2019 & 2032
- Table 15: Global Physical Security Services Market Revenue Million Forecast, by Component 2019 & 2032
- Table 16: Global Physical Security Services Market Volume Billion Forecast, by Component 2019 & 2032
- Table 17: Global Physical Security Services Market Revenue Million Forecast, by End User Industry 2019 & 2032
- Table 18: Global Physical Security Services Market Volume Billion Forecast, by End User Industry 2019 & 2032
- Table 19: Global Physical Security Services Market Revenue Million Forecast, by Country 2019 & 2032
- Table 20: Global Physical Security Services Market Volume Billion Forecast, by Country 2019 & 2032
- Table 21: Global Physical Security Services Market Revenue Million Forecast, by Component 2019 & 2032
- Table 22: Global Physical Security Services Market Volume Billion Forecast, by Component 2019 & 2032
- Table 23: Global Physical Security Services Market Revenue Million Forecast, by End User Industry 2019 & 2032
- Table 24: Global Physical Security Services Market Volume Billion Forecast, by End User Industry 2019 & 2032
- Table 25: Global Physical Security Services Market Revenue Million Forecast, by Country 2019 & 2032
- Table 26: Global Physical Security Services Market Volume Billion Forecast, by Country 2019 & 2032
- Table 27: Global Physical Security Services Market Revenue Million Forecast, by Component 2019 & 2032
- Table 28: Global Physical Security Services Market Volume Billion Forecast, by Component 2019 & 2032
- Table 29: Global Physical Security Services Market Revenue Million Forecast, by End User Industry 2019 & 2032
- Table 30: Global Physical Security Services Market Volume Billion Forecast, by End User Industry 2019 & 2032
- Table 31: Global Physical Security Services Market Revenue Million Forecast, by Country 2019 & 2032
- Table 32: Global Physical Security Services Market Volume Billion Forecast, by Country 2019 & 2032
- Table 33: Global Physical Security Services Market Revenue Million Forecast, by Component 2019 & 2032
- Table 34: Global Physical Security Services Market Volume Billion Forecast, by Component 2019 & 2032
- Table 35: Global Physical Security Services Market Revenue Million Forecast, by End User Industry 2019 & 2032
- Table 36: Global Physical Security Services Market Volume Billion Forecast, by End User Industry 2019 & 2032
- Table 37: Global Physical Security Services Market Revenue Million Forecast, by Country 2019 & 2032
- Table 38: Global Physical Security Services Market Volume Billion Forecast, by Country 2019 & 2032
- Table 39: Global Physical Security Services Market Revenue Million Forecast, by Component 2019 & 2032
- Table 40: Global Physical Security Services Market Volume Billion Forecast, by Component 2019 & 2032
- Table 41: Global Physical Security Services Market Revenue Million Forecast, by End User Industry 2019 & 2032
- Table 42: Global Physical Security Services Market Volume Billion Forecast, by End User Industry 2019 & 2032
- Table 43: Global Physical Security Services Market Revenue Million Forecast, by Country 2019 & 2032
- Table 44: Global Physical Security Services Market Volume Billion Forecast, by Country 2019 & 2032
Frequently Asked Questions
1. What is the projected Compound Annual Growth Rate (CAGR) of the Physical Security Services Market?
The projected CAGR is approximately 4.75%.
2. Which companies are prominent players in the Physical Security Services Market?
Key companies in the market include Johnson Controles, Honeywell International Inc, Cisco Systems Inc, Huawei Technologies Co Ltd, Genetec Inc, G4S, Securitas, Secom, Prosegur, Brinks, Loomis, Allied Barton, Garda, Relianc.
3. What are the main segments of the Physical Security Services Market?
The market segments include Component, End User Industry.
4. Can you provide details about the market size?
The market size is estimated to be USD 112.93 Million as of 2022.
5. What are some drivers contributing to market growth?
Favorable Changes in Regulatory Standards have Prompted the Use of Security Services from the Organized Sector; Dynamic Nature of the Security Threats. Especially. has Contributed the Demand for Cash Services to Safeguard Cash Transit.
6. What are the notable trends driving market growth?
The Demand for Physical Security Services is Growing in the BSFI Sector.
7. Are there any restraints impacting market growth?
Favorable Changes in Regulatory Standards have Prompted the Use of Security Services from the Organized Sector; Dynamic Nature of the Security Threats. Especially. has Contributed the Demand for Cash Services to Safeguard Cash Transit.
8. Can you provide examples of recent developments in the market?
May 2024: ZKTeco East Africa, a company providing security technology solutions, announced its partnership with Mart Networks Group Ltd at a security technology conference. ZKTecho showcased its newly launched products and solutions, including time and attendance, access control, smart locks, and video surveillance management. It also explores the potential and capabilities of ZKDigimax in digital advertising and displays cutting-edge physical security solutions from Armatura.
9. What pricing options are available for accessing the report?
Pricing options include single-user, multi-user, and enterprise licenses priced at USD 4750, USD 5250, and USD 8750 respectively.
10. Is the market size provided in terms of value or volume?
The market size is provided in terms of value, measured in Million and volume, measured in Billion.
11. Are there any specific market keywords associated with the report?
Yes, the market keyword associated with the report is "Physical Security Services Market," which aids in identifying and referencing the specific market segment covered.
12. How do I determine which pricing option suits my needs best?
The pricing options vary based on user requirements and access needs. Individual users may opt for single-user licenses, while businesses requiring broader access may choose multi-user or enterprise licenses for cost-effective access to the report.
13. Are there any additional resources or data provided in the Physical Security Services Market report?
While the report offers comprehensive insights, it's advisable to review the specific contents or supplementary materials provided to ascertain if additional resources or data are available.
14. How can I stay updated on further developments or reports in the Physical Security Services Market?
To stay informed about further developments, trends, and reports in the Physical Security Services Market, consider subscribing to industry newsletters, following relevant companies and organizations, or regularly checking reputable industry news sources and publications.
Methodology
Step 1 - Identification of Relevant Samples Size from Population Database


Step 2 - Approaches for Defining Global Market Size (Value, Volume* & Price*)

Note*: In applicable scenarios
Step 3 - Data Sources
Primary Research
- Web Analytics
- Survey Reports
- Research Institute
- Latest Research Reports
- Opinion Leaders
Secondary Research
- Annual Reports
- White Paper
- Latest Press Release
- Industry Association
- Paid Database
- Investor Presentations

Step 4 - Data Triangulation
Involves using different sources of information in order to increase the validity of a study
These sources are likely to be stakeholders in a program - participants, other researchers, program staff, other community members, and so on.
Then we put all data in single framework & apply various statistical tools to find out the dynamic on the market.
During the analysis stage, feedback from the stakeholder groups would be compared to determine areas of agreement as well as areas of divergence


