
Key Insights
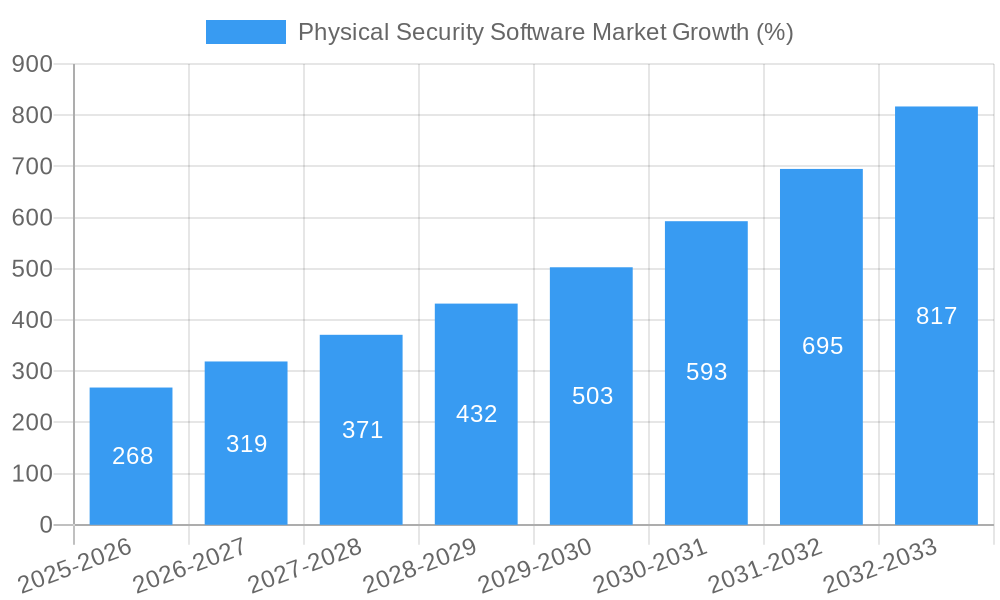
The Physical Security Software market is experiencing robust growth, projected to reach \$1.66 billion in 2025 and maintain a Compound Annual Growth Rate (CAGR) of 16.24% from 2025 to 2033. This expansion is driven by several key factors. The increasing adoption of cloud-based security solutions offers scalability, cost-effectiveness, and remote accessibility, fueling market growth. Furthermore, the rising need for robust security measures across various sectors, including BFSI (Banking, Financial Services, and Insurance), transportation and logistics, government and defense, and retail, is a significant driver. The integration of advanced technologies like AI and machine learning within physical security software enhances threat detection, improves response times, and provides valuable data-driven insights, further stimulating market demand. Growth is also being propelled by the rising adoption of video analytics for improved surveillance and security management. However, challenges like high initial investment costs, the complexity of integrating disparate security systems, and concerns about data privacy and security could potentially restrain market growth to some extent.
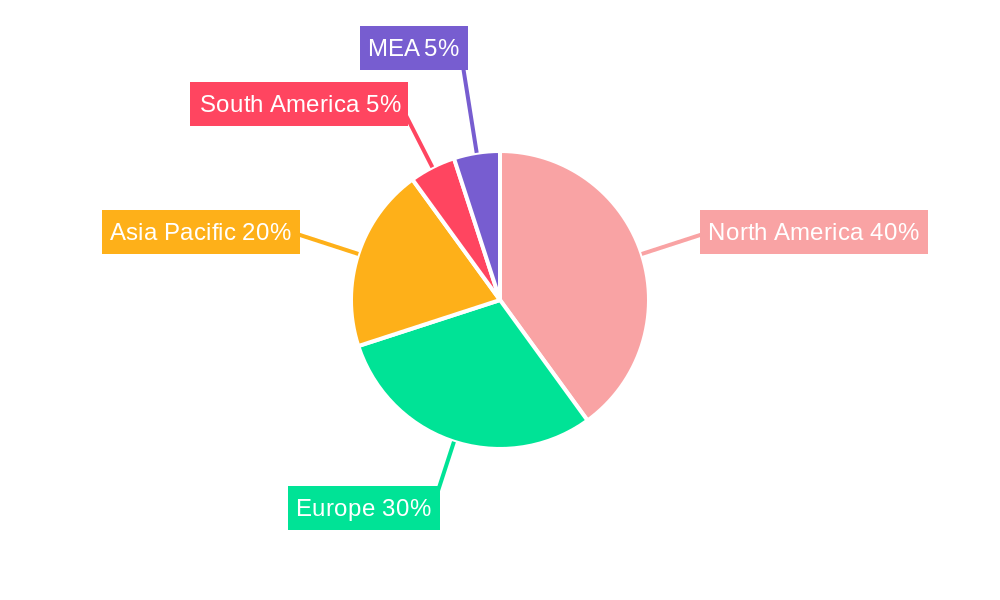
Segmentation reveals a dynamic market landscape. The solution segment is likely to dominate due to increasing demand for comprehensive security platforms, while the cloud deployment model gains traction owing to its flexible and scalable nature. North America currently holds a significant market share, driven by robust technological advancements and high adoption rates within the region. However, Asia-Pacific is projected to witness substantial growth in the coming years fueled by rapid urbanization, expanding infrastructure projects, and increasing investments in security technologies across various industries. Key players, such as Milestone Systems, LenelS, Qognify, and Johnson Controls, are actively engaged in product innovation and strategic partnerships to maintain their market positions and capitalize on growth opportunities. The competitive landscape is characterized by a mix of established players and emerging innovative companies, driving further market expansion and diversification.

Physical Security Software Market: A Comprehensive Report (2019-2033)
This in-depth report provides a comprehensive analysis of the Physical Security Software Market, offering valuable insights for industry professionals, investors, and strategic decision-makers. Covering the period from 2019 to 2033, with a focus on 2025, this report meticulously examines market dynamics, segmentation, leading players, and future growth potential. The market is projected to reach xx Million by 2033, exhibiting a robust CAGR of xx% during the forecast period (2025-2033).
Physical Security Software Market Structure & Innovation Trends
The Physical Security Software market is characterized by a moderately concentrated landscape, with key players holding significant market share. Milestone Systems A/S, LenelS, and Qognify Inc. are among the prominent companies shaping market dynamics. Innovation is primarily driven by advancements in AI, cloud computing, and IoT technologies, enabling enhanced surveillance, threat detection, and response capabilities. Stringent government regulations regarding data privacy and security significantly influence market practices. Product substitutes include traditional security methods (e.g., manned guarding), but the market's growth is primarily driven by the increasing demand for sophisticated, integrated security solutions. The market witnesses frequent mergers and acquisitions (M&A) activities, with deal values averaging around xx Million in recent years. Key M&A activities involve strategic collaborations to expand product portfolios and geographical reach.
- Market Concentration: Moderately concentrated, with top 5 players holding approximately xx% market share in 2025.
- Innovation Drivers: AI, Cloud Computing, IoT integration, and advancements in video analytics.
- Regulatory Framework: Stringent data privacy regulations (e.g., GDPR, CCPA) impact data storage and processing practices.
- Product Substitutes: Traditional security methods, but limited applicability due to limitations in scalability and efficiency.
- End-User Demographics: Predominantly large enterprises and government organizations, with increasing adoption among SMEs.
- M&A Activity: Frequent acquisitions to enhance product offerings and expand market reach. Average deal value: xx Million.
Physical Security Software Market Dynamics & Trends
The Physical Security Software market is experiencing significant growth fueled by rising security concerns across various sectors, increasing adoption of cloud-based solutions, and the proliferation of connected devices. Technological disruptions, such as the integration of AI and machine learning, are transforming surveillance capabilities, leading to more accurate threat detection and proactive response measures. Consumer preferences are shifting towards integrated and user-friendly solutions that offer enhanced scalability and remote management capabilities. Competitive dynamics are marked by intense rivalry amongst established players and the emergence of innovative startups. The market penetration of cloud-based solutions is increasing rapidly, driven by its cost-effectiveness and scalability. The market is projected to witness a CAGR of xx% from 2025 to 2033, reaching a market value of xx Million by 2033.
Dominant Regions & Segments in Physical Security Software Market
The North American region currently holds the largest market share, driven by high technology adoption rates and robust investments in security infrastructure. However, the Asia Pacific region is projected to witness the fastest growth due to rapid urbanization, expanding industrialization, and increasing government initiatives to improve public safety.
By End-user Industry:
- Government and Defense: High adoption driven by national security concerns and the need for advanced surveillance and threat detection capabilities. Robust government spending and large-scale infrastructure projects further fuel market growth.
- BFSI: Stringent regulatory compliance requirements and increasing cyber threats necessitate robust security solutions, driving significant market demand.
- Transportation and Logistics: Need for enhanced asset tracking, security monitoring, and efficient incident management drives demand.
By Type:
- Solution: This segment dominates the market, driven by the increasing demand for comprehensive security management platforms.
- Services: This segment is witnessing steady growth, driven by the rising need for professional services like implementation, integration, and maintenance.
By Deployment:
- Cloud: Rapidly gaining market share due to its scalability, cost-effectiveness, and enhanced accessibility.
- On-premise: Still retains a considerable market share, especially in industries with stringent data security regulations.
Physical Security Software Market Product Innovations
Recent advancements include the integration of AI-powered video analytics for improved threat detection, cloud-based solutions for enhanced scalability and accessibility, and the development of user-friendly interfaces for streamlined security management. These innovations are enhancing the market fit by addressing the growing need for more efficient, proactive, and cost-effective security solutions. The increasing demand for integrated platforms that combine various security functions (access control, video surveillance, intrusion detection) is shaping product development strategies.
Report Scope & Segmentation Analysis
This report segments the Physical Security Software market by end-user industry (BFSI, Transportation and Logistics, Government and Defense, Retail, Energy and Utilities, Other End-user Industries), type (Solution, Services), and deployment (On-premise, Cloud). Each segment's growth projections, market size, and competitive dynamics are analyzed in detail. The Government and Defense segment exhibits the highest growth potential, driven by substantial government investments in security infrastructure. The cloud deployment model is experiencing rapid growth due to its cost-effectiveness and scalability advantages.
Key Drivers of Physical Security Software Market Growth
The market's growth is primarily driven by increasing security threats, the growing adoption of cloud-based solutions, and the increasing demand for integrated security systems. Technological advancements, such as AI and machine learning, are enhancing the capabilities of physical security software, leading to more efficient and effective security measures. Government initiatives and regulations promoting cybersecurity and data privacy are further driving market growth.
Challenges in the Physical Security Software Market Sector
The market faces challenges including high initial investment costs for advanced solutions, the complexity of integrating various security systems, and concerns regarding data privacy and security. Supply chain disruptions and the shortage of skilled professionals can also hinder market growth. The high cost of implementing and maintaining complex security systems can limit adoption among small and medium-sized enterprises (SMEs).
Emerging Opportunities in Physical Security Software Market
Emerging opportunities include the growing adoption of IoT devices and the integration of AI and machine learning in security systems. The expanding demand for cloud-based security solutions and the increasing focus on cybersecurity offer significant growth potential. Furthermore, the development of advanced analytics capabilities for predictive security management presents substantial market opportunities.
Leading Players in the Physical Security Software Market Market
- Milestone Systems A/S (Denmark)
- LenelS
- Qognify Inc
- Johnson Controls International PLC
- AxxonSoft Inc
- Advancis Software & Services GmbH
- Prysm Software
- Hexagon AB
- Vidsys Inc
- Genetec Inc
- Everbridge Inc
- Verint Systems Inc
- Ela-Soft GmbH
- Easypsim AG
- F A S T Systems Inc
- Octopus System
- VIDEONEXT Network Solutions
Key Developments in Physical Security Software Market Industry
- September 2021: Hexagon AB introduced its Physical Security & Surveillance Management portfolio for railways, integrating 3D surveillance systems with security, dispatching, and collaboration software.
- May 2022: SureView Systems and ShotSpotter announced their technology integration, enabling faster law enforcement response to incidents.
Future Outlook for Physical Security Software Market Market
The Physical Security Software market is poised for significant growth, driven by technological advancements, increasing security concerns, and the expanding adoption of cloud-based solutions. The integration of AI and IoT will further enhance the capabilities of security systems, leading to more proactive and efficient security management. Strategic partnerships and acquisitions will shape the competitive landscape, driving innovation and market expansion.
Physical Security Software Market Segmentation
-
1. Type
- 1.1. Solution
- 1.2. Services
-
2. Deployment
- 2.1. On-premise
- 2.2. Cloud
-
3. End-user Industry
- 3.1. BFSI
- 3.2. Transportation and Logistics
- 3.3. Government and Defense
- 3.4. Retail
- 3.5. Energy and Utilities
- 3.6. Other End-user Industries
Physical Security Software Market Segmentation By Geography
-
1. North America
- 1.1. Unites States
- 1.2. Canada
-
2. Europe
- 2.1. Germany
- 2.2. United Kingdom
- 2.3. France
- 2.4. Rest of Europe
-
3. Asia Pacific
- 3.1. India
- 3.2. China
- 3.3. Japan
- 3.4. Rest of Asia Pacific
- 4. Latin America
- 5. Middle East and Africa
Physical Security Software Market REPORT HIGHLIGHTS
| Aspects | Details |
|---|---|
| Study Period | 2019-2033 |
| Base Year | 2024 |
| Estimated Year | 2025 |
| Forecast Period | 2025-2033 |
| Historical Period | 2019-2024 |
| Growth Rate | CAGR of 16.24% from 2019-2033 |
| Segmentation |
|
Table of Contents
- 1. Introduction
- 1.1. Research Scope
- 1.2. Market Segmentation
- 1.3. Research Methodology
- 1.4. Definitions and Assumptions
- 2. Executive Summary
- 2.1. Introduction
- 3. Market Dynamics
- 3.1. Introduction
- 3.2. Market Drivers
- 3.2.1. Increasing Government Initiatives for Smart Cities; Surging Demand for Sophisticated Organizational Security
- 3.3. Market Restrains
- 3.3.1. High Deployment and Integration Costs
- 3.4. Market Trends
- 3.4.1. Government and Defense Have Significant Shares in the Market
- 4. Market Factor Analysis
- 4.1. Porters Five Forces
- 4.2. Supply/Value Chain
- 4.3. PESTEL analysis
- 4.4. Market Entropy
- 4.5. Patent/Trademark Analysis
- 5. Global Physical Security Software Market Analysis, Insights and Forecast, 2019-2031
- 5.1. Market Analysis, Insights and Forecast - by Type
- 5.1.1. Solution
- 5.1.2. Services
- 5.2. Market Analysis, Insights and Forecast - by Deployment
- 5.2.1. On-premise
- 5.2.2. Cloud
- 5.3. Market Analysis, Insights and Forecast - by End-user Industry
- 5.3.1. BFSI
- 5.3.2. Transportation and Logistics
- 5.3.3. Government and Defense
- 5.3.4. Retail
- 5.3.5. Energy and Utilities
- 5.3.6. Other End-user Industries
- 5.4. Market Analysis, Insights and Forecast - by Region
- 5.4.1. North America
- 5.4.2. Europe
- 5.4.3. Asia Pacific
- 5.4.4. Latin America
- 5.4.5. Middle East and Africa
- 5.1. Market Analysis, Insights and Forecast - by Type
- 6. North America Physical Security Software Market Analysis, Insights and Forecast, 2019-2031
- 6.1. Market Analysis, Insights and Forecast - by Type
- 6.1.1. Solution
- 6.1.2. Services
- 6.2. Market Analysis, Insights and Forecast - by Deployment
- 6.2.1. On-premise
- 6.2.2. Cloud
- 6.3. Market Analysis, Insights and Forecast - by End-user Industry
- 6.3.1. BFSI
- 6.3.2. Transportation and Logistics
- 6.3.3. Government and Defense
- 6.3.4. Retail
- 6.3.5. Energy and Utilities
- 6.3.6. Other End-user Industries
- 6.1. Market Analysis, Insights and Forecast - by Type
- 7. Europe Physical Security Software Market Analysis, Insights and Forecast, 2019-2031
- 7.1. Market Analysis, Insights and Forecast - by Type
- 7.1.1. Solution
- 7.1.2. Services
- 7.2. Market Analysis, Insights and Forecast - by Deployment
- 7.2.1. On-premise
- 7.2.2. Cloud
- 7.3. Market Analysis, Insights and Forecast - by End-user Industry
- 7.3.1. BFSI
- 7.3.2. Transportation and Logistics
- 7.3.3. Government and Defense
- 7.3.4. Retail
- 7.3.5. Energy and Utilities
- 7.3.6. Other End-user Industries
- 7.1. Market Analysis, Insights and Forecast - by Type
- 8. Asia Pacific Physical Security Software Market Analysis, Insights and Forecast, 2019-2031
- 8.1. Market Analysis, Insights and Forecast - by Type
- 8.1.1. Solution
- 8.1.2. Services
- 8.2. Market Analysis, Insights and Forecast - by Deployment
- 8.2.1. On-premise
- 8.2.2. Cloud
- 8.3. Market Analysis, Insights and Forecast - by End-user Industry
- 8.3.1. BFSI
- 8.3.2. Transportation and Logistics
- 8.3.3. Government and Defense
- 8.3.4. Retail
- 8.3.5. Energy and Utilities
- 8.3.6. Other End-user Industries
- 8.1. Market Analysis, Insights and Forecast - by Type
- 9. Latin America Physical Security Software Market Analysis, Insights and Forecast, 2019-2031
- 9.1. Market Analysis, Insights and Forecast - by Type
- 9.1.1. Solution
- 9.1.2. Services
- 9.2. Market Analysis, Insights and Forecast - by Deployment
- 9.2.1. On-premise
- 9.2.2. Cloud
- 9.3. Market Analysis, Insights and Forecast - by End-user Industry
- 9.3.1. BFSI
- 9.3.2. Transportation and Logistics
- 9.3.3. Government and Defense
- 9.3.4. Retail
- 9.3.5. Energy and Utilities
- 9.3.6. Other End-user Industries
- 9.1. Market Analysis, Insights and Forecast - by Type
- 10. Middle East and Africa Physical Security Software Market Analysis, Insights and Forecast, 2019-2031
- 10.1. Market Analysis, Insights and Forecast - by Type
- 10.1.1. Solution
- 10.1.2. Services
- 10.2. Market Analysis, Insights and Forecast - by Deployment
- 10.2.1. On-premise
- 10.2.2. Cloud
- 10.3. Market Analysis, Insights and Forecast - by End-user Industry
- 10.3.1. BFSI
- 10.3.2. Transportation and Logistics
- 10.3.3. Government and Defense
- 10.3.4. Retail
- 10.3.5. Energy and Utilities
- 10.3.6. Other End-user Industries
- 10.1. Market Analysis, Insights and Forecast - by Type
- 11. North America Physical Security Software Market Analysis, Insights and Forecast, 2019-2031
- 11.1. Market Analysis, Insights and Forecast - By Country/Sub-region
- 11.1.1 United States
- 11.1.2 Canada
- 11.1.3 Mexico
- 12. Europe Physical Security Software Market Analysis, Insights and Forecast, 2019-2031
- 12.1. Market Analysis, Insights and Forecast - By Country/Sub-region
- 12.1.1 Germany
- 12.1.2 United Kingdom
- 12.1.3 France
- 12.1.4 Spain
- 12.1.5 Italy
- 12.1.6 Spain
- 12.1.7 Belgium
- 12.1.8 Netherland
- 12.1.9 Nordics
- 12.1.10 Rest of Europe
- 13. Asia Pacific Physical Security Software Market Analysis, Insights and Forecast, 2019-2031
- 13.1. Market Analysis, Insights and Forecast - By Country/Sub-region
- 13.1.1 China
- 13.1.2 Japan
- 13.1.3 India
- 13.1.4 South Korea
- 13.1.5 Southeast Asia
- 13.1.6 Australia
- 13.1.7 Indonesia
- 13.1.8 Phillipes
- 13.1.9 Singapore
- 13.1.10 Thailandc
- 13.1.11 Rest of Asia Pacific
- 14. South America Physical Security Software Market Analysis, Insights and Forecast, 2019-2031
- 14.1. Market Analysis, Insights and Forecast - By Country/Sub-region
- 14.1.1 Brazil
- 14.1.2 Argentina
- 14.1.3 Peru
- 14.1.4 Chile
- 14.1.5 Colombia
- 14.1.6 Ecuador
- 14.1.7 Venezuela
- 14.1.8 Rest of South America
- 15. North America Physical Security Software Market Analysis, Insights and Forecast, 2019-2031
- 15.1. Market Analysis, Insights and Forecast - By Country/Sub-region
- 15.1.1 United States
- 15.1.2 Canada
- 15.1.3 Mexico
- 16. MEA Physical Security Software Market Analysis, Insights and Forecast, 2019-2031
- 16.1. Market Analysis, Insights and Forecast - By Country/Sub-region
- 16.1.1 United Arab Emirates
- 16.1.2 Saudi Arabia
- 16.1.3 South Africa
- 16.1.4 Rest of Middle East and Africa
- 17. Competitive Analysis
- 17.1. Global Market Share Analysis 2024
- 17.2. Company Profiles
- 17.2.1 Milestone Systems A/S (Denmark)
- 17.2.1.1. Overview
- 17.2.1.2. Products
- 17.2.1.3. SWOT Analysis
- 17.2.1.4. Recent Developments
- 17.2.1.5. Financials (Based on Availability)
- 17.2.2 LenelS
- 17.2.2.1. Overview
- 17.2.2.2. Products
- 17.2.2.3. SWOT Analysis
- 17.2.2.4. Recent Developments
- 17.2.2.5. Financials (Based on Availability)
- 17.2.3 Qognify Inc
- 17.2.3.1. Overview
- 17.2.3.2. Products
- 17.2.3.3. SWOT Analysis
- 17.2.3.4. Recent Developments
- 17.2.3.5. Financials (Based on Availability)
- 17.2.4 Johnson Controls International PLC
- 17.2.4.1. Overview
- 17.2.4.2. Products
- 17.2.4.3. SWOT Analysis
- 17.2.4.4. Recent Developments
- 17.2.4.5. Financials (Based on Availability)
- 17.2.5 AxxonSoft Inc
- 17.2.5.1. Overview
- 17.2.5.2. Products
- 17.2.5.3. SWOT Analysis
- 17.2.5.4. Recent Developments
- 17.2.5.5. Financials (Based on Availability)
- 17.2.6 Advancis Software & Services GmbH
- 17.2.6.1. Overview
- 17.2.6.2. Products
- 17.2.6.3. SWOT Analysis
- 17.2.6.4. Recent Developments
- 17.2.6.5. Financials (Based on Availability)
- 17.2.7 Prysm Software
- 17.2.7.1. Overview
- 17.2.7.2. Products
- 17.2.7.3. SWOT Analysis
- 17.2.7.4. Recent Developments
- 17.2.7.5. Financials (Based on Availability)
- 17.2.8 Hexagon AB
- 17.2.8.1. Overview
- 17.2.8.2. Products
- 17.2.8.3. SWOT Analysis
- 17.2.8.4. Recent Developments
- 17.2.8.5. Financials (Based on Availability)
- 17.2.9 Vidsys Inc
- 17.2.9.1. Overview
- 17.2.9.2. Products
- 17.2.9.3. SWOT Analysis
- 17.2.9.4. Recent Developments
- 17.2.9.5. Financials (Based on Availability)
- 17.2.10 Genetec Inc
- 17.2.10.1. Overview
- 17.2.10.2. Products
- 17.2.10.3. SWOT Analysis
- 17.2.10.4. Recent Developments
- 17.2.10.5. Financials (Based on Availability)
- 17.2.11 Everbridge Inc
- 17.2.11.1. Overview
- 17.2.11.2. Products
- 17.2.11.3. SWOT Analysis
- 17.2.11.4. Recent Developments
- 17.2.11.5. Financials (Based on Availability)
- 17.2.12 Verint Systems Inc
- 17.2.12.1. Overview
- 17.2.12.2. Products
- 17.2.12.3. SWOT Analysis
- 17.2.12.4. Recent Developments
- 17.2.12.5. Financials (Based on Availability)
- 17.2.13 Ela-Soft GmbH
- 17.2.13.1. Overview
- 17.2.13.2. Products
- 17.2.13.3. SWOT Analysis
- 17.2.13.4. Recent Developments
- 17.2.13.5. Financials (Based on Availability)
- 17.2.14 Easypsim AG
- 17.2.14.1. Overview
- 17.2.14.2. Products
- 17.2.14.3. SWOT Analysis
- 17.2.14.4. Recent Developments
- 17.2.14.5. Financials (Based on Availability)
- 17.2.15 F A S T Systems Inc
- 17.2.15.1. Overview
- 17.2.15.2. Products
- 17.2.15.3. SWOT Analysis
- 17.2.15.4. Recent Developments
- 17.2.15.5. Financials (Based on Availability)
- 17.2.16 Octopus System
- 17.2.16.1. Overview
- 17.2.16.2. Products
- 17.2.16.3. SWOT Analysis
- 17.2.16.4. Recent Developments
- 17.2.16.5. Financials (Based on Availability)
- 17.2.17 VIDEONEXT Network Solutions
- 17.2.17.1. Overview
- 17.2.17.2. Products
- 17.2.17.3. SWOT Analysis
- 17.2.17.4. Recent Developments
- 17.2.17.5. Financials (Based on Availability)
- 17.2.1 Milestone Systems A/S (Denmark)
List of Figures
- Figure 1: Global Physical Security Software Market Revenue Breakdown (Million, %) by Region 2024 & 2032
- Figure 2: North America Physical Security Software Market Revenue (Million), by Country 2024 & 2032
- Figure 3: North America Physical Security Software Market Revenue Share (%), by Country 2024 & 2032
- Figure 4: Europe Physical Security Software Market Revenue (Million), by Country 2024 & 2032
- Figure 5: Europe Physical Security Software Market Revenue Share (%), by Country 2024 & 2032
- Figure 6: Asia Pacific Physical Security Software Market Revenue (Million), by Country 2024 & 2032
- Figure 7: Asia Pacific Physical Security Software Market Revenue Share (%), by Country 2024 & 2032
- Figure 8: South America Physical Security Software Market Revenue (Million), by Country 2024 & 2032
- Figure 9: South America Physical Security Software Market Revenue Share (%), by Country 2024 & 2032
- Figure 10: North America Physical Security Software Market Revenue (Million), by Country 2024 & 2032
- Figure 11: North America Physical Security Software Market Revenue Share (%), by Country 2024 & 2032
- Figure 12: MEA Physical Security Software Market Revenue (Million), by Country 2024 & 2032
- Figure 13: MEA Physical Security Software Market Revenue Share (%), by Country 2024 & 2032
- Figure 14: North America Physical Security Software Market Revenue (Million), by Type 2024 & 2032
- Figure 15: North America Physical Security Software Market Revenue Share (%), by Type 2024 & 2032
- Figure 16: North America Physical Security Software Market Revenue (Million), by Deployment 2024 & 2032
- Figure 17: North America Physical Security Software Market Revenue Share (%), by Deployment 2024 & 2032
- Figure 18: North America Physical Security Software Market Revenue (Million), by End-user Industry 2024 & 2032
- Figure 19: North America Physical Security Software Market Revenue Share (%), by End-user Industry 2024 & 2032
- Figure 20: North America Physical Security Software Market Revenue (Million), by Country 2024 & 2032
- Figure 21: North America Physical Security Software Market Revenue Share (%), by Country 2024 & 2032
- Figure 22: Europe Physical Security Software Market Revenue (Million), by Type 2024 & 2032
- Figure 23: Europe Physical Security Software Market Revenue Share (%), by Type 2024 & 2032
- Figure 24: Europe Physical Security Software Market Revenue (Million), by Deployment 2024 & 2032
- Figure 25: Europe Physical Security Software Market Revenue Share (%), by Deployment 2024 & 2032
- Figure 26: Europe Physical Security Software Market Revenue (Million), by End-user Industry 2024 & 2032
- Figure 27: Europe Physical Security Software Market Revenue Share (%), by End-user Industry 2024 & 2032
- Figure 28: Europe Physical Security Software Market Revenue (Million), by Country 2024 & 2032
- Figure 29: Europe Physical Security Software Market Revenue Share (%), by Country 2024 & 2032
- Figure 30: Asia Pacific Physical Security Software Market Revenue (Million), by Type 2024 & 2032
- Figure 31: Asia Pacific Physical Security Software Market Revenue Share (%), by Type 2024 & 2032
- Figure 32: Asia Pacific Physical Security Software Market Revenue (Million), by Deployment 2024 & 2032
- Figure 33: Asia Pacific Physical Security Software Market Revenue Share (%), by Deployment 2024 & 2032
- Figure 34: Asia Pacific Physical Security Software Market Revenue (Million), by End-user Industry 2024 & 2032
- Figure 35: Asia Pacific Physical Security Software Market Revenue Share (%), by End-user Industry 2024 & 2032
- Figure 36: Asia Pacific Physical Security Software Market Revenue (Million), by Country 2024 & 2032
- Figure 37: Asia Pacific Physical Security Software Market Revenue Share (%), by Country 2024 & 2032
- Figure 38: Latin America Physical Security Software Market Revenue (Million), by Type 2024 & 2032
- Figure 39: Latin America Physical Security Software Market Revenue Share (%), by Type 2024 & 2032
- Figure 40: Latin America Physical Security Software Market Revenue (Million), by Deployment 2024 & 2032
- Figure 41: Latin America Physical Security Software Market Revenue Share (%), by Deployment 2024 & 2032
- Figure 42: Latin America Physical Security Software Market Revenue (Million), by End-user Industry 2024 & 2032
- Figure 43: Latin America Physical Security Software Market Revenue Share (%), by End-user Industry 2024 & 2032
- Figure 44: Latin America Physical Security Software Market Revenue (Million), by Country 2024 & 2032
- Figure 45: Latin America Physical Security Software Market Revenue Share (%), by Country 2024 & 2032
- Figure 46: Middle East and Africa Physical Security Software Market Revenue (Million), by Type 2024 & 2032
- Figure 47: Middle East and Africa Physical Security Software Market Revenue Share (%), by Type 2024 & 2032
- Figure 48: Middle East and Africa Physical Security Software Market Revenue (Million), by Deployment 2024 & 2032
- Figure 49: Middle East and Africa Physical Security Software Market Revenue Share (%), by Deployment 2024 & 2032
- Figure 50: Middle East and Africa Physical Security Software Market Revenue (Million), by End-user Industry 2024 & 2032
- Figure 51: Middle East and Africa Physical Security Software Market Revenue Share (%), by End-user Industry 2024 & 2032
- Figure 52: Middle East and Africa Physical Security Software Market Revenue (Million), by Country 2024 & 2032
- Figure 53: Middle East and Africa Physical Security Software Market Revenue Share (%), by Country 2024 & 2032
List of Tables
- Table 1: Global Physical Security Software Market Revenue Million Forecast, by Region 2019 & 2032
- Table 2: Global Physical Security Software Market Revenue Million Forecast, by Type 2019 & 2032
- Table 3: Global Physical Security Software Market Revenue Million Forecast, by Deployment 2019 & 2032
- Table 4: Global Physical Security Software Market Revenue Million Forecast, by End-user Industry 2019 & 2032
- Table 5: Global Physical Security Software Market Revenue Million Forecast, by Region 2019 & 2032
- Table 6: Global Physical Security Software Market Revenue Million Forecast, by Country 2019 & 2032
- Table 7: United States Physical Security Software Market Revenue (Million) Forecast, by Application 2019 & 2032
- Table 8: Canada Physical Security Software Market Revenue (Million) Forecast, by Application 2019 & 2032
- Table 9: Mexico Physical Security Software Market Revenue (Million) Forecast, by Application 2019 & 2032
- Table 10: Global Physical Security Software Market Revenue Million Forecast, by Country 2019 & 2032
- Table 11: Germany Physical Security Software Market Revenue (Million) Forecast, by Application 2019 & 2032
- Table 12: United Kingdom Physical Security Software Market Revenue (Million) Forecast, by Application 2019 & 2032
- Table 13: France Physical Security Software Market Revenue (Million) Forecast, by Application 2019 & 2032
- Table 14: Spain Physical Security Software Market Revenue (Million) Forecast, by Application 2019 & 2032
- Table 15: Italy Physical Security Software Market Revenue (Million) Forecast, by Application 2019 & 2032
- Table 16: Spain Physical Security Software Market Revenue (Million) Forecast, by Application 2019 & 2032
- Table 17: Belgium Physical Security Software Market Revenue (Million) Forecast, by Application 2019 & 2032
- Table 18: Netherland Physical Security Software Market Revenue (Million) Forecast, by Application 2019 & 2032
- Table 19: Nordics Physical Security Software Market Revenue (Million) Forecast, by Application 2019 & 2032
- Table 20: Rest of Europe Physical Security Software Market Revenue (Million) Forecast, by Application 2019 & 2032
- Table 21: Global Physical Security Software Market Revenue Million Forecast, by Country 2019 & 2032
- Table 22: China Physical Security Software Market Revenue (Million) Forecast, by Application 2019 & 2032
- Table 23: Japan Physical Security Software Market Revenue (Million) Forecast, by Application 2019 & 2032
- Table 24: India Physical Security Software Market Revenue (Million) Forecast, by Application 2019 & 2032
- Table 25: South Korea Physical Security Software Market Revenue (Million) Forecast, by Application 2019 & 2032
- Table 26: Southeast Asia Physical Security Software Market Revenue (Million) Forecast, by Application 2019 & 2032
- Table 27: Australia Physical Security Software Market Revenue (Million) Forecast, by Application 2019 & 2032
- Table 28: Indonesia Physical Security Software Market Revenue (Million) Forecast, by Application 2019 & 2032
- Table 29: Phillipes Physical Security Software Market Revenue (Million) Forecast, by Application 2019 & 2032
- Table 30: Singapore Physical Security Software Market Revenue (Million) Forecast, by Application 2019 & 2032
- Table 31: Thailandc Physical Security Software Market Revenue (Million) Forecast, by Application 2019 & 2032
- Table 32: Rest of Asia Pacific Physical Security Software Market Revenue (Million) Forecast, by Application 2019 & 2032
- Table 33: Global Physical Security Software Market Revenue Million Forecast, by Country 2019 & 2032
- Table 34: Brazil Physical Security Software Market Revenue (Million) Forecast, by Application 2019 & 2032
- Table 35: Argentina Physical Security Software Market Revenue (Million) Forecast, by Application 2019 & 2032
- Table 36: Peru Physical Security Software Market Revenue (Million) Forecast, by Application 2019 & 2032
- Table 37: Chile Physical Security Software Market Revenue (Million) Forecast, by Application 2019 & 2032
- Table 38: Colombia Physical Security Software Market Revenue (Million) Forecast, by Application 2019 & 2032
- Table 39: Ecuador Physical Security Software Market Revenue (Million) Forecast, by Application 2019 & 2032
- Table 40: Venezuela Physical Security Software Market Revenue (Million) Forecast, by Application 2019 & 2032
- Table 41: Rest of South America Physical Security Software Market Revenue (Million) Forecast, by Application 2019 & 2032
- Table 42: Global Physical Security Software Market Revenue Million Forecast, by Country 2019 & 2032
- Table 43: United States Physical Security Software Market Revenue (Million) Forecast, by Application 2019 & 2032
- Table 44: Canada Physical Security Software Market Revenue (Million) Forecast, by Application 2019 & 2032
- Table 45: Mexico Physical Security Software Market Revenue (Million) Forecast, by Application 2019 & 2032
- Table 46: Global Physical Security Software Market Revenue Million Forecast, by Country 2019 & 2032
- Table 47: United Arab Emirates Physical Security Software Market Revenue (Million) Forecast, by Application 2019 & 2032
- Table 48: Saudi Arabia Physical Security Software Market Revenue (Million) Forecast, by Application 2019 & 2032
- Table 49: South Africa Physical Security Software Market Revenue (Million) Forecast, by Application 2019 & 2032
- Table 50: Rest of Middle East and Africa Physical Security Software Market Revenue (Million) Forecast, by Application 2019 & 2032
- Table 51: Global Physical Security Software Market Revenue Million Forecast, by Type 2019 & 2032
- Table 52: Global Physical Security Software Market Revenue Million Forecast, by Deployment 2019 & 2032
- Table 53: Global Physical Security Software Market Revenue Million Forecast, by End-user Industry 2019 & 2032
- Table 54: Global Physical Security Software Market Revenue Million Forecast, by Country 2019 & 2032
- Table 55: Unites States Physical Security Software Market Revenue (Million) Forecast, by Application 2019 & 2032
- Table 56: Canada Physical Security Software Market Revenue (Million) Forecast, by Application 2019 & 2032
- Table 57: Global Physical Security Software Market Revenue Million Forecast, by Type 2019 & 2032
- Table 58: Global Physical Security Software Market Revenue Million Forecast, by Deployment 2019 & 2032
- Table 59: Global Physical Security Software Market Revenue Million Forecast, by End-user Industry 2019 & 2032
- Table 60: Global Physical Security Software Market Revenue Million Forecast, by Country 2019 & 2032
- Table 61: Germany Physical Security Software Market Revenue (Million) Forecast, by Application 2019 & 2032
- Table 62: United Kingdom Physical Security Software Market Revenue (Million) Forecast, by Application 2019 & 2032
- Table 63: France Physical Security Software Market Revenue (Million) Forecast, by Application 2019 & 2032
- Table 64: Rest of Europe Physical Security Software Market Revenue (Million) Forecast, by Application 2019 & 2032
- Table 65: Global Physical Security Software Market Revenue Million Forecast, by Type 2019 & 2032
- Table 66: Global Physical Security Software Market Revenue Million Forecast, by Deployment 2019 & 2032
- Table 67: Global Physical Security Software Market Revenue Million Forecast, by End-user Industry 2019 & 2032
- Table 68: Global Physical Security Software Market Revenue Million Forecast, by Country 2019 & 2032
- Table 69: India Physical Security Software Market Revenue (Million) Forecast, by Application 2019 & 2032
- Table 70: China Physical Security Software Market Revenue (Million) Forecast, by Application 2019 & 2032
- Table 71: Japan Physical Security Software Market Revenue (Million) Forecast, by Application 2019 & 2032
- Table 72: Rest of Asia Pacific Physical Security Software Market Revenue (Million) Forecast, by Application 2019 & 2032
- Table 73: Global Physical Security Software Market Revenue Million Forecast, by Type 2019 & 2032
- Table 74: Global Physical Security Software Market Revenue Million Forecast, by Deployment 2019 & 2032
- Table 75: Global Physical Security Software Market Revenue Million Forecast, by End-user Industry 2019 & 2032
- Table 76: Global Physical Security Software Market Revenue Million Forecast, by Country 2019 & 2032
- Table 77: Global Physical Security Software Market Revenue Million Forecast, by Type 2019 & 2032
- Table 78: Global Physical Security Software Market Revenue Million Forecast, by Deployment 2019 & 2032
- Table 79: Global Physical Security Software Market Revenue Million Forecast, by End-user Industry 2019 & 2032
- Table 80: Global Physical Security Software Market Revenue Million Forecast, by Country 2019 & 2032
Frequently Asked Questions
1. What is the projected Compound Annual Growth Rate (CAGR) of the Physical Security Software Market?
The projected CAGR is approximately 16.24%.
2. Which companies are prominent players in the Physical Security Software Market?
Key companies in the market include Milestone Systems A/S (Denmark), LenelS, Qognify Inc, Johnson Controls International PLC, AxxonSoft Inc, Advancis Software & Services GmbH, Prysm Software, Hexagon AB, Vidsys Inc, Genetec Inc, Everbridge Inc, Verint Systems Inc, Ela-Soft GmbH, Easypsim AG, F A S T Systems Inc, Octopus System, VIDEONEXT Network Solutions.
3. What are the main segments of the Physical Security Software Market?
The market segments include Type, Deployment, End-user Industry.
4. Can you provide details about the market size?
The market size is estimated to be USD 1.66 Million as of 2022.
5. What are some drivers contributing to market growth?
Increasing Government Initiatives for Smart Cities; Surging Demand for Sophisticated Organizational Security.
6. What are the notable trends driving market growth?
Government and Defense Have Significant Shares in the Market.
7. Are there any restraints impacting market growth?
High Deployment and Integration Costs.
8. Can you provide examples of recent developments in the market?
May 2022 - SureView Systems, a provider of open response platforms, and ShotSpotter, a provider of police technology solutions, announced that SureView can interact with ShotSpotter. SureView and ShotSpotter demonstrate how combining their disparate technology may help law enforcement respond more swiftly to incidents. Furthermore, the existence of the things will help in crime prevention. The combination of ShotSpotter's gunshot alerts and SureView's PSIM provides security operations teams with the tactical information they require to respond and save people with a clear picture of events.
9. What pricing options are available for accessing the report?
Pricing options include single-user, multi-user, and enterprise licenses priced at USD 4750, USD 5250, and USD 8750 respectively.
10. Is the market size provided in terms of value or volume?
The market size is provided in terms of value, measured in Million.
11. Are there any specific market keywords associated with the report?
Yes, the market keyword associated with the report is "Physical Security Software Market," which aids in identifying and referencing the specific market segment covered.
12. How do I determine which pricing option suits my needs best?
The pricing options vary based on user requirements and access needs. Individual users may opt for single-user licenses, while businesses requiring broader access may choose multi-user or enterprise licenses for cost-effective access to the report.
13. Are there any additional resources or data provided in the Physical Security Software Market report?
While the report offers comprehensive insights, it's advisable to review the specific contents or supplementary materials provided to ascertain if additional resources or data are available.
14. How can I stay updated on further developments or reports in the Physical Security Software Market?
To stay informed about further developments, trends, and reports in the Physical Security Software Market, consider subscribing to industry newsletters, following relevant companies and organizations, or regularly checking reputable industry news sources and publications.
Methodology
Step 1 - Identification of Relevant Samples Size from Population Database


Step 2 - Approaches for Defining Global Market Size (Value, Volume* & Price*)

Note*: In applicable scenarios
Step 3 - Data Sources
Primary Research
- Web Analytics
- Survey Reports
- Research Institute
- Latest Research Reports
- Opinion Leaders
Secondary Research
- Annual Reports
- White Paper
- Latest Press Release
- Industry Association
- Paid Database
- Investor Presentations

Step 4 - Data Triangulation
Involves using different sources of information in order to increase the validity of a study
These sources are likely to be stakeholders in a program - participants, other researchers, program staff, other community members, and so on.
Then we put all data in single framework & apply various statistical tools to find out the dynamic on the market.
During the analysis stage, feedback from the stakeholder groups would be compared to determine areas of agreement as well as areas of divergence


