
Key Insights
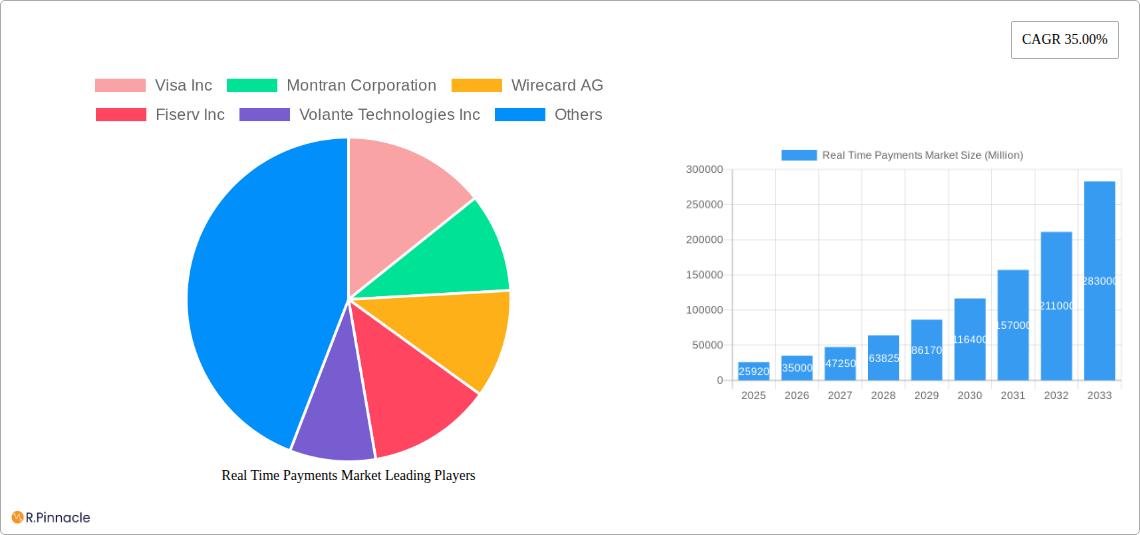
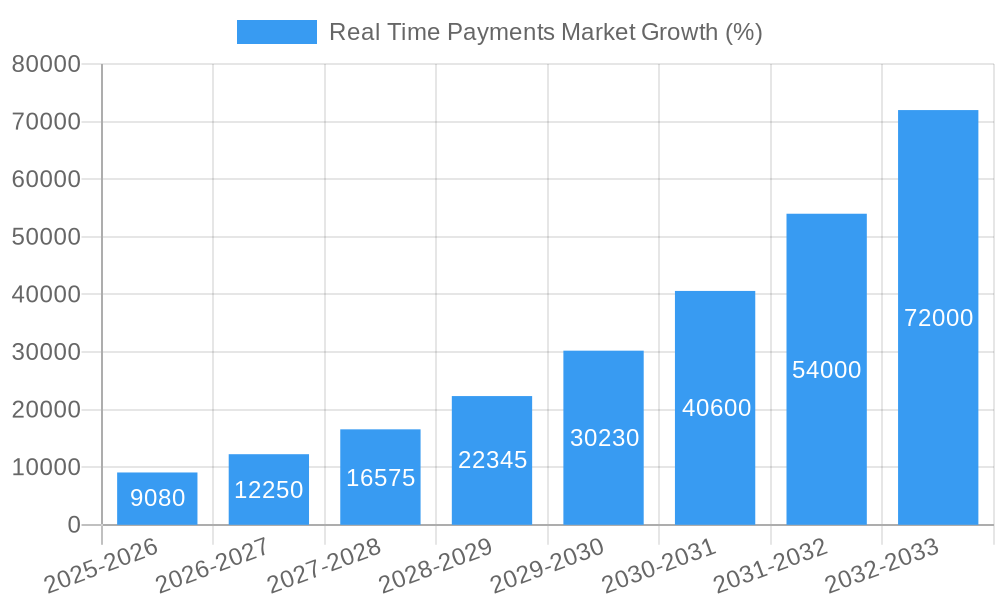
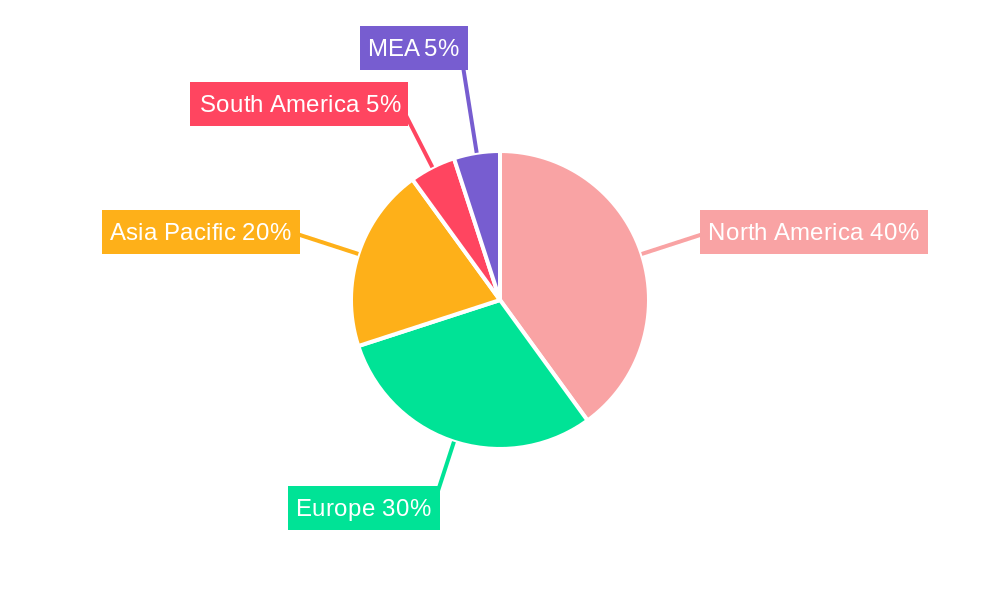
The real-time payments market is experiencing explosive growth, projected to reach $25.92 billion in 2025 and exhibiting a remarkable Compound Annual Growth Rate (CAGR) of 35% from 2019 to 2033. This surge is driven by several key factors. The increasing adoption of mobile banking and digital wallets fuels consumer demand for instant transactions. Businesses, too, are embracing real-time payments to streamline operations, improve cash flow, and enhance customer experience. Furthermore, regulatory initiatives globally are promoting the wider acceptance and integration of real-time payment systems, further accelerating market expansion. The dominance of P2P (person-to-person) payments is expected to continue, but P2B (person-to-business) transactions will show significant growth driven by increasing e-commerce and digital invoice payments. Competition is intense, with major players like Visa, Mastercard, PayPal, and numerous fintech companies vying for market share through innovative solutions and strategic partnerships. Geographic expansion is another significant factor; while North America and Europe currently hold a larger share, the Asia-Pacific region is projected to witness rapid growth, fueled by increasing smartphone penetration and a burgeoning digital economy.
The market segmentation reveals a clear preference for P2P transactions within the real-time payment landscape, however, the growth of P2B payments is quickly catching up. The leading companies in this dynamic sector are continually innovating to maintain their competitive edge. This involves focusing on enhanced security features, improved user interfaces, and global reach. Geographical variations in market penetration are apparent, with North America and Europe currently leading, however, emerging economies in the Asia-Pacific region are poised for substantial growth in the coming years due to increasing digital financial inclusion initiatives. The forecast period from 2025 to 2033 anticipates continued expansion, driven by ongoing technological advancements, increased consumer adoption, and favorable regulatory environments. This period of growth signifies a transformation of the global financial landscape with real-time payments playing a crucial role.
Real Time Payments Market Report: 2019-2033
This comprehensive report provides an in-depth analysis of the Real Time Payments market, offering invaluable insights for industry professionals, investors, and strategists. Covering the period from 2019 to 2033, with a focus on 2025, this report unveils market dynamics, key players, and future growth prospects. The report leverages extensive data and analysis to provide a clear understanding of this rapidly evolving sector. The total market size in 2025 is estimated at xx Million.
Real Time Payments Market Structure & Innovation Trends
The Real Time Payments market exhibits a moderately concentrated structure, with key players like Visa Inc, Mastercard Inc, and PayPal Holdings Inc holding significant market share. However, the landscape is dynamic, fueled by continuous innovation and strategic mergers and acquisitions (M&A). The market share of these top three players in 2025 is estimated to be approximately 45%, with Visa holding the largest individual share.
- Market Concentration: The Herfindahl-Hirschman Index (HHI) for 2025 is estimated to be xx, suggesting a moderately concentrated market.
- Innovation Drivers: Technological advancements such as improved APIs, cloud computing, and AI-powered fraud detection systems are driving innovation. Regulatory changes and increasing consumer demand for faster and more secure payment methods are also significant factors.
- Regulatory Frameworks: Varying regulatory landscapes across different regions impact market growth and adoption rates. Compliance with regulations like PSD2 (in Europe) and similar regional regulations is crucial for market players.
- Product Substitutes: Traditional payment methods like checks and wire transfers pose a degree of competitive pressure, but the speed and convenience of real-time payments are steadily eroding their market share.
- End-User Demographics: Growth is driven by a rise in digital adoption amongst younger generations and a preference for seamless, instant transactions. Businesses are also increasingly adopting real-time payments for enhanced operational efficiency.
- M&A Activities: The past five years have witnessed significant M&A activity, with deal values exceeding xx Million in total. These activities have resulted in increased market consolidation and technological integration. Examples include [insert specific M&A examples with estimated values if available, otherwise indicate "Data unavailable"].
Real Time Payments Market Dynamics & Trends
The Real Time Payments market is experiencing robust growth, driven by several key factors. The Compound Annual Growth Rate (CAGR) from 2025 to 2033 is projected to be xx%. Market penetration is increasing steadily, with a predicted xx% penetration rate by 2033 in developed economies and a lower but still significant rate in developing ones. Several significant trends are shaping the market:
- Growth Drivers: The increasing adoption of mobile banking, e-commerce transactions, and the rise of the gig economy are contributing to the market's expansion. The demand for faster, more convenient payment methods fuels this growth.
- Technological Disruptions: The introduction of new technologies such as blockchain and distributed ledger technologies (DLT) promises to further revolutionize real-time payments, adding further layers of security and efficiency.
- Consumer Preferences: Consumers prioritize speed, convenience, and security in their payment choices, creating a significant demand for real-time solutions.
- Competitive Dynamics: Intense competition among established players and fintech startups is driving innovation and affordability. This competitive landscape fuels the development of new features and the reduction of transaction fees.
Dominant Regions & Segments in Real Time Payments Market
The North American region currently dominates the real-time payments market, largely driven by mature digital infrastructure and high consumer adoption rates. Within this region, the United States holds the largest market share due to its advanced technological capabilities and robust regulatory frameworks supporting innovation.
- Key Drivers for North American Dominance:
- Strong digital infrastructure: A well-developed digital infrastructure enables seamless real-time payment transactions.
- High mobile penetration: High smartphone adoption rates facilitate widespread access to mobile payment apps.
- Favorable regulatory environment: A supportive regulatory environment encourages innovation and competition in the sector.
- High consumer adoption of digital payments: Consumers are highly receptive to digital payment methods, including real-time solutions.
Segment Analysis: The P2P segment is currently the fastest-growing segment, fueled by increased social media engagement and the rising popularity of peer-to-peer money transfer applications. The P2B segment is also showing robust growth, driven by businesses' adoption of real-time payment solutions for improved efficiency and reduced operational costs. Specific figures for market size and growth projections for both segments will be detailed in the full report. The relative market share of P2P and P2B segments will be further analyzed.
Real Time Payments Market Product Innovations
Recent innovations in the real time payments space focus on enhanced security features, improved user interfaces, and integration with other financial services. The industry is witnessing a trend towards the development of comprehensive payment platforms that offer a range of services, from peer-to-peer transfers to business-to-business payments, all within a single, unified system. This trend aims to enhance customer convenience and reduce fragmentation in the market.
Report Scope & Segmentation Analysis
This report segments the Real Time Payments market based on the type of payment:
P2P (Person-to-Person): This segment is characterized by high growth potential, driven by the increasing popularity of mobile payment apps and social media integration. Market size in 2025 is estimated at xx Million, expected to reach xx Million by 2033, with a CAGR of xx%.
P2B (Person-to-Business): This segment is gaining traction due to the efficiency advantages offered to businesses. Market size in 2025 is estimated at xx Million, projected to reach xx Million by 2033, with a CAGR of xx%. Competitive dynamics within both segments are fierce, with constant innovation in user experience and security features.
Key Drivers of Real Time Payments Market Growth
The rapid growth of the Real Time Payments market is fueled by a confluence of factors:
- Technological advancements: The development of faster and more secure payment technologies, including blockchain and AI, is a key driver.
- Regulatory support: Favorable government policies and initiatives encouraging the adoption of real-time payment systems in various countries are accelerating market expansion.
- Evolving consumer preferences: Consumers increasingly demand faster, more convenient, and secure payment options, leading to the high adoption rate of real-time systems.
- Increased e-commerce activity: The rise of e-commerce and mobile payments drives demand for real-time transaction processing.
Challenges in the Real Time Payments Market Sector
Despite significant growth potential, several challenges impede market expansion:
- Regulatory hurdles: Differing regulatory landscapes across regions create complexities for global market players and can limit cross-border transactions.
- Cybersecurity concerns: The increasing reliance on digital systems necessitates robust security measures to mitigate the risk of fraud and data breaches. The cost of implementing such measures is significant.
- Integration complexities: Integrating real-time payment systems with existing legacy systems can be costly and time-consuming.
- Interoperability issues: Lack of interoperability between different payment systems can limit the reach and efficiency of real-time transactions.
Emerging Opportunities in Real Time Payments Market
The Real Time Payments market presents several lucrative opportunities:
- Expansion into emerging markets: Untapped potential exists in developing economies with growing smartphone penetration and digital adoption rates.
- Integration with other financial services: Real-time payment systems can be integrated with other financial services, such as lending and investment platforms, creating new revenue streams.
- Development of innovative payment solutions: There is substantial scope for developing new payment products tailored to specific customer needs, like micro-payments and instant cross-border transactions.
Leading Players in the Real Time Payments Market Market
- Visa Inc
- Montran Corporation
- Wirecard AG
- Fiserv Inc
- Volante Technologies Inc
- Temenos AG
- FIS Global
- Finastra
- Mastercard Inc
- ACI Worldwide Inc
- Paypal Holdings Inc
Key Developments in Real Time Payments Market Industry
- April 2023: Visa announced a partnership with PayPal and Venmo to pilot Visa+, aiming to enable faster and more secure P2P money transfers between different apps. This significantly impacts market dynamics by fostering interoperability and enhancing the overall user experience.
- April 2023: CRED introduced UPI-based P2P payments, offering users a convenient new payment option. This development increases competition in the P2P segment and expands the accessibility of real-time payments.
Future Outlook for Real Time Payments Market Market
The future of the Real Time Payments market looks bright. Continued technological innovation, increasing consumer demand, and supportive regulatory environments will drive significant growth. Strategic partnerships and M&A activities will further shape the market landscape, leading to greater consolidation and the emergence of integrated payment platforms. The market is poised for exponential growth, offering significant opportunities for both established players and emerging fintech companies.
Real Time Payments Market Segmentation
-
1. Type of Payment
- 1.1. P2P
- 1.2. P2B
Real Time Payments Market Segmentation By Geography
-
1. North America
- 1.1. United States
- 1.2. Canada
-
2. Europe
- 2.1. United Kingdom
- 2.2. Germany
- 2.3. Spain
- 2.4. Sweden
- 2.5. Finland
- 2.6. Rest of Europe
-
3. Asia Pacific
- 3.1. China
- 3.2. India
- 3.3. South Korea
- 3.4. Thailand
- 3.5. Japan
- 3.6. Rest of Asia Pacific
-
4. Latin America
- 4.1. Brazil
- 4.2. Argentina
- 4.3. Colombia
- 4.4. Mexico
- 4.5. Rest of Latin America
-
5. Middle East and Africa
- 5.1. United Arab Emirates
- 5.2. South Africa
- 5.3. Nigeria
- 5.4. Rest of Middle East and Africa
Real Time Payments Market REPORT HIGHLIGHTS
| Aspects | Details |
|---|---|
| Study Period | 2019-2033 |
| Base Year | 2024 |
| Estimated Year | 2025 |
| Forecast Period | 2025-2033 |
| Historical Period | 2019-2024 |
| Growth Rate | CAGR of 35.00% from 2019-2033 |
| Segmentation |
|
Table of Contents
- 1. Introduction
- 1.1. Research Scope
- 1.2. Market Segmentation
- 1.3. Research Methodology
- 1.4. Definitions and Assumptions
- 2. Executive Summary
- 2.1. Introduction
- 3. Market Dynamics
- 3.1. Introduction
- 3.2. Market Drivers
- 3.2.1. Increased Smartphone Penetration; Ease of Convenience; Falling Reliance on Traditional Banking
- 3.3. Market Restrains
- 3.3.1. Operational Challenges Involving Cross-border Payments
- 3.4. Market Trends
- 3.4.1. P2B Segment Holds the Key to Drive the Market
- 4. Market Factor Analysis
- 4.1. Porters Five Forces
- 4.2. Supply/Value Chain
- 4.3. PESTEL analysis
- 4.4. Market Entropy
- 4.5. Patent/Trademark Analysis
- 5. Global Real Time Payments Market Analysis, Insights and Forecast, 2019-2031
- 5.1. Market Analysis, Insights and Forecast - by Type of Payment
- 5.1.1. P2P
- 5.1.2. P2B
- 5.2. Market Analysis, Insights and Forecast - by Region
- 5.2.1. North America
- 5.2.2. Europe
- 5.2.3. Asia Pacific
- 5.2.4. Latin America
- 5.2.5. Middle East and Africa
- 5.1. Market Analysis, Insights and Forecast - by Type of Payment
- 6. North America Real Time Payments Market Analysis, Insights and Forecast, 2019-2031
- 6.1. Market Analysis, Insights and Forecast - by Type of Payment
- 6.1.1. P2P
- 6.1.2. P2B
- 6.1. Market Analysis, Insights and Forecast - by Type of Payment
- 7. Europe Real Time Payments Market Analysis, Insights and Forecast, 2019-2031
- 7.1. Market Analysis, Insights and Forecast - by Type of Payment
- 7.1.1. P2P
- 7.1.2. P2B
- 7.1. Market Analysis, Insights and Forecast - by Type of Payment
- 8. Asia Pacific Real Time Payments Market Analysis, Insights and Forecast, 2019-2031
- 8.1. Market Analysis, Insights and Forecast - by Type of Payment
- 8.1.1. P2P
- 8.1.2. P2B
- 8.1. Market Analysis, Insights and Forecast - by Type of Payment
- 9. Latin America Real Time Payments Market Analysis, Insights and Forecast, 2019-2031
- 9.1. Market Analysis, Insights and Forecast - by Type of Payment
- 9.1.1. P2P
- 9.1.2. P2B
- 9.1. Market Analysis, Insights and Forecast - by Type of Payment
- 10. Middle East and Africa Real Time Payments Market Analysis, Insights and Forecast, 2019-2031
- 10.1. Market Analysis, Insights and Forecast - by Type of Payment
- 10.1.1. P2P
- 10.1.2. P2B
- 10.1. Market Analysis, Insights and Forecast - by Type of Payment
- 11. North America Real Time Payments Market Analysis, Insights and Forecast, 2019-2031
- 11.1. Market Analysis, Insights and Forecast - By Country/Sub-region
- 11.1.1. undefined
- 12. Europe Real Time Payments Market Analysis, Insights and Forecast, 2019-2031
- 12.1. Market Analysis, Insights and Forecast - By Country/Sub-region
- 12.1.1. undefined
- 13. Asia Pacific Real Time Payments Market Analysis, Insights and Forecast, 2019-2031
- 13.1. Market Analysis, Insights and Forecast - By Country/Sub-region
- 13.1.1. undefined
- 14. South America Real Time Payments Market Analysis, Insights and Forecast, 2019-2031
- 14.1. Market Analysis, Insights and Forecast - By Country/Sub-region
- 14.1.1. undefined
- 15. North America Real Time Payments Market Analysis, Insights and Forecast, 2019-2031
- 15.1. Market Analysis, Insights and Forecast - By Country/Sub-region
- 15.1.1. undefined
- 16. MEA Real Time Payments Market Analysis, Insights and Forecast, 2019-2031
- 16.1. Market Analysis, Insights and Forecast - By Country/Sub-region
- 16.1.1. undefined
- 17. Competitive Analysis
- 17.1. Global Market Share Analysis 2024
- 17.2. Company Profiles
- 17.2.1 Visa Inc
- 17.2.1.1. Overview
- 17.2.1.2. Products
- 17.2.1.3. SWOT Analysis
- 17.2.1.4. Recent Developments
- 17.2.1.5. Financials (Based on Availability)
- 17.2.2 Montran Corporation
- 17.2.2.1. Overview
- 17.2.2.2. Products
- 17.2.2.3. SWOT Analysis
- 17.2.2.4. Recent Developments
- 17.2.2.5. Financials (Based on Availability)
- 17.2.3 Wirecard AG
- 17.2.3.1. Overview
- 17.2.3.2. Products
- 17.2.3.3. SWOT Analysis
- 17.2.3.4. Recent Developments
- 17.2.3.5. Financials (Based on Availability)
- 17.2.4 Fiserv Inc
- 17.2.4.1. Overview
- 17.2.4.2. Products
- 17.2.4.3. SWOT Analysis
- 17.2.4.4. Recent Developments
- 17.2.4.5. Financials (Based on Availability)
- 17.2.5 Volante Technologies Inc
- 17.2.5.1. Overview
- 17.2.5.2. Products
- 17.2.5.3. SWOT Analysis
- 17.2.5.4. Recent Developments
- 17.2.5.5. Financials (Based on Availability)
- 17.2.6 Temenos AG
- 17.2.6.1. Overview
- 17.2.6.2. Products
- 17.2.6.3. SWOT Analysis
- 17.2.6.4. Recent Developments
- 17.2.6.5. Financials (Based on Availability)
- 17.2.7 FIS Global
- 17.2.7.1. Overview
- 17.2.7.2. Products
- 17.2.7.3. SWOT Analysis
- 17.2.7.4. Recent Developments
- 17.2.7.5. Financials (Based on Availability)
- 17.2.8 Finastra
- 17.2.8.1. Overview
- 17.2.8.2. Products
- 17.2.8.3. SWOT Analysis
- 17.2.8.4. Recent Developments
- 17.2.8.5. Financials (Based on Availability)
- 17.2.9 Mastercard Inc
- 17.2.9.1. Overview
- 17.2.9.2. Products
- 17.2.9.3. SWOT Analysis
- 17.2.9.4. Recent Developments
- 17.2.9.5. Financials (Based on Availability)
- 17.2.10 ACI Worldwide Inc
- 17.2.10.1. Overview
- 17.2.10.2. Products
- 17.2.10.3. SWOT Analysis
- 17.2.10.4. Recent Developments
- 17.2.10.5. Financials (Based on Availability)
- 17.2.11 Paypal Holdings Inc
- 17.2.11.1. Overview
- 17.2.11.2. Products
- 17.2.11.3. SWOT Analysis
- 17.2.11.4. Recent Developments
- 17.2.11.5. Financials (Based on Availability)
- 17.2.1 Visa Inc
List of Figures
- Figure 1: Global Real Time Payments Market Revenue Breakdown (Million, %) by Region 2024 & 2032
- Figure 2: Global Real Time Payments Market Volume Breakdown (K Unit, %) by Region 2024 & 2032
- Figure 3: North America Real Time Payments Market Revenue (Million), by Country 2024 & 2032
- Figure 4: North America Real Time Payments Market Volume (K Unit), by Country 2024 & 2032
- Figure 5: North America Real Time Payments Market Revenue Share (%), by Country 2024 & 2032
- Figure 6: North America Real Time Payments Market Volume Share (%), by Country 2024 & 2032
- Figure 7: Europe Real Time Payments Market Revenue (Million), by Country 2024 & 2032
- Figure 8: Europe Real Time Payments Market Volume (K Unit), by Country 2024 & 2032
- Figure 9: Europe Real Time Payments Market Revenue Share (%), by Country 2024 & 2032
- Figure 10: Europe Real Time Payments Market Volume Share (%), by Country 2024 & 2032
- Figure 11: Asia Pacific Real Time Payments Market Revenue (Million), by Country 2024 & 2032
- Figure 12: Asia Pacific Real Time Payments Market Volume (K Unit), by Country 2024 & 2032
- Figure 13: Asia Pacific Real Time Payments Market Revenue Share (%), by Country 2024 & 2032
- Figure 14: Asia Pacific Real Time Payments Market Volume Share (%), by Country 2024 & 2032
- Figure 15: South America Real Time Payments Market Revenue (Million), by Country 2024 & 2032
- Figure 16: South America Real Time Payments Market Volume (K Unit), by Country 2024 & 2032
- Figure 17: South America Real Time Payments Market Revenue Share (%), by Country 2024 & 2032
- Figure 18: South America Real Time Payments Market Volume Share (%), by Country 2024 & 2032
- Figure 19: North America Real Time Payments Market Revenue (Million), by Country 2024 & 2032
- Figure 20: North America Real Time Payments Market Volume (K Unit), by Country 2024 & 2032
- Figure 21: North America Real Time Payments Market Revenue Share (%), by Country 2024 & 2032
- Figure 22: North America Real Time Payments Market Volume Share (%), by Country 2024 & 2032
- Figure 23: MEA Real Time Payments Market Revenue (Million), by Country 2024 & 2032
- Figure 24: MEA Real Time Payments Market Volume (K Unit), by Country 2024 & 2032
- Figure 25: MEA Real Time Payments Market Revenue Share (%), by Country 2024 & 2032
- Figure 26: MEA Real Time Payments Market Volume Share (%), by Country 2024 & 2032
- Figure 27: North America Real Time Payments Market Revenue (Million), by Type of Payment 2024 & 2032
- Figure 28: North America Real Time Payments Market Volume (K Unit), by Type of Payment 2024 & 2032
- Figure 29: North America Real Time Payments Market Revenue Share (%), by Type of Payment 2024 & 2032
- Figure 30: North America Real Time Payments Market Volume Share (%), by Type of Payment 2024 & 2032
- Figure 31: North America Real Time Payments Market Revenue (Million), by Country 2024 & 2032
- Figure 32: North America Real Time Payments Market Volume (K Unit), by Country 2024 & 2032
- Figure 33: North America Real Time Payments Market Revenue Share (%), by Country 2024 & 2032
- Figure 34: North America Real Time Payments Market Volume Share (%), by Country 2024 & 2032
- Figure 35: Europe Real Time Payments Market Revenue (Million), by Type of Payment 2024 & 2032
- Figure 36: Europe Real Time Payments Market Volume (K Unit), by Type of Payment 2024 & 2032
- Figure 37: Europe Real Time Payments Market Revenue Share (%), by Type of Payment 2024 & 2032
- Figure 38: Europe Real Time Payments Market Volume Share (%), by Type of Payment 2024 & 2032
- Figure 39: Europe Real Time Payments Market Revenue (Million), by Country 2024 & 2032
- Figure 40: Europe Real Time Payments Market Volume (K Unit), by Country 2024 & 2032
- Figure 41: Europe Real Time Payments Market Revenue Share (%), by Country 2024 & 2032
- Figure 42: Europe Real Time Payments Market Volume Share (%), by Country 2024 & 2032
- Figure 43: Asia Pacific Real Time Payments Market Revenue (Million), by Type of Payment 2024 & 2032
- Figure 44: Asia Pacific Real Time Payments Market Volume (K Unit), by Type of Payment 2024 & 2032
- Figure 45: Asia Pacific Real Time Payments Market Revenue Share (%), by Type of Payment 2024 & 2032
- Figure 46: Asia Pacific Real Time Payments Market Volume Share (%), by Type of Payment 2024 & 2032
- Figure 47: Asia Pacific Real Time Payments Market Revenue (Million), by Country 2024 & 2032
- Figure 48: Asia Pacific Real Time Payments Market Volume (K Unit), by Country 2024 & 2032
- Figure 49: Asia Pacific Real Time Payments Market Revenue Share (%), by Country 2024 & 2032
- Figure 50: Asia Pacific Real Time Payments Market Volume Share (%), by Country 2024 & 2032
- Figure 51: Latin America Real Time Payments Market Revenue (Million), by Type of Payment 2024 & 2032
- Figure 52: Latin America Real Time Payments Market Volume (K Unit), by Type of Payment 2024 & 2032
- Figure 53: Latin America Real Time Payments Market Revenue Share (%), by Type of Payment 2024 & 2032
- Figure 54: Latin America Real Time Payments Market Volume Share (%), by Type of Payment 2024 & 2032
- Figure 55: Latin America Real Time Payments Market Revenue (Million), by Country 2024 & 2032
- Figure 56: Latin America Real Time Payments Market Volume (K Unit), by Country 2024 & 2032
- Figure 57: Latin America Real Time Payments Market Revenue Share (%), by Country 2024 & 2032
- Figure 58: Latin America Real Time Payments Market Volume Share (%), by Country 2024 & 2032
- Figure 59: Middle East and Africa Real Time Payments Market Revenue (Million), by Type of Payment 2024 & 2032
- Figure 60: Middle East and Africa Real Time Payments Market Volume (K Unit), by Type of Payment 2024 & 2032
- Figure 61: Middle East and Africa Real Time Payments Market Revenue Share (%), by Type of Payment 2024 & 2032
- Figure 62: Middle East and Africa Real Time Payments Market Volume Share (%), by Type of Payment 2024 & 2032
- Figure 63: Middle East and Africa Real Time Payments Market Revenue (Million), by Country 2024 & 2032
- Figure 64: Middle East and Africa Real Time Payments Market Volume (K Unit), by Country 2024 & 2032
- Figure 65: Middle East and Africa Real Time Payments Market Revenue Share (%), by Country 2024 & 2032
- Figure 66: Middle East and Africa Real Time Payments Market Volume Share (%), by Country 2024 & 2032
List of Tables
- Table 1: Global Real Time Payments Market Revenue Million Forecast, by Region 2019 & 2032
- Table 2: Global Real Time Payments Market Volume K Unit Forecast, by Region 2019 & 2032
- Table 3: Global Real Time Payments Market Revenue Million Forecast, by Type of Payment 2019 & 2032
- Table 4: Global Real Time Payments Market Volume K Unit Forecast, by Type of Payment 2019 & 2032
- Table 5: Global Real Time Payments Market Revenue Million Forecast, by Region 2019 & 2032
- Table 6: Global Real Time Payments Market Volume K Unit Forecast, by Region 2019 & 2032
- Table 7: Global Real Time Payments Market Revenue Million Forecast, by Country 2019 & 2032
- Table 8: Global Real Time Payments Market Volume K Unit Forecast, by Country 2019 & 2032
- Table 9: Global Real Time Payments Market Revenue Million Forecast, by Country 2019 & 2032
- Table 10: Global Real Time Payments Market Volume K Unit Forecast, by Country 2019 & 2032
- Table 11: Global Real Time Payments Market Revenue Million Forecast, by Country 2019 & 2032
- Table 12: Global Real Time Payments Market Volume K Unit Forecast, by Country 2019 & 2032
- Table 13: Global Real Time Payments Market Revenue Million Forecast, by Country 2019 & 2032
- Table 14: Global Real Time Payments Market Volume K Unit Forecast, by Country 2019 & 2032
- Table 15: Global Real Time Payments Market Revenue Million Forecast, by Country 2019 & 2032
- Table 16: Global Real Time Payments Market Volume K Unit Forecast, by Country 2019 & 2032
- Table 17: Global Real Time Payments Market Revenue Million Forecast, by Country 2019 & 2032
- Table 18: Global Real Time Payments Market Volume K Unit Forecast, by Country 2019 & 2032
- Table 19: Global Real Time Payments Market Revenue Million Forecast, by Type of Payment 2019 & 2032
- Table 20: Global Real Time Payments Market Volume K Unit Forecast, by Type of Payment 2019 & 2032
- Table 21: Global Real Time Payments Market Revenue Million Forecast, by Country 2019 & 2032
- Table 22: Global Real Time Payments Market Volume K Unit Forecast, by Country 2019 & 2032
- Table 23: United States Real Time Payments Market Revenue (Million) Forecast, by Application 2019 & 2032
- Table 24: United States Real Time Payments Market Volume (K Unit) Forecast, by Application 2019 & 2032
- Table 25: Canada Real Time Payments Market Revenue (Million) Forecast, by Application 2019 & 2032
- Table 26: Canada Real Time Payments Market Volume (K Unit) Forecast, by Application 2019 & 2032
- Table 27: Global Real Time Payments Market Revenue Million Forecast, by Type of Payment 2019 & 2032
- Table 28: Global Real Time Payments Market Volume K Unit Forecast, by Type of Payment 2019 & 2032
- Table 29: Global Real Time Payments Market Revenue Million Forecast, by Country 2019 & 2032
- Table 30: Global Real Time Payments Market Volume K Unit Forecast, by Country 2019 & 2032
- Table 31: United Kingdom Real Time Payments Market Revenue (Million) Forecast, by Application 2019 & 2032
- Table 32: United Kingdom Real Time Payments Market Volume (K Unit) Forecast, by Application 2019 & 2032
- Table 33: Germany Real Time Payments Market Revenue (Million) Forecast, by Application 2019 & 2032
- Table 34: Germany Real Time Payments Market Volume (K Unit) Forecast, by Application 2019 & 2032
- Table 35: Spain Real Time Payments Market Revenue (Million) Forecast, by Application 2019 & 2032
- Table 36: Spain Real Time Payments Market Volume (K Unit) Forecast, by Application 2019 & 2032
- Table 37: Sweden Real Time Payments Market Revenue (Million) Forecast, by Application 2019 & 2032
- Table 38: Sweden Real Time Payments Market Volume (K Unit) Forecast, by Application 2019 & 2032
- Table 39: Finland Real Time Payments Market Revenue (Million) Forecast, by Application 2019 & 2032
- Table 40: Finland Real Time Payments Market Volume (K Unit) Forecast, by Application 2019 & 2032
- Table 41: Rest of Europe Real Time Payments Market Revenue (Million) Forecast, by Application 2019 & 2032
- Table 42: Rest of Europe Real Time Payments Market Volume (K Unit) Forecast, by Application 2019 & 2032
- Table 43: Global Real Time Payments Market Revenue Million Forecast, by Type of Payment 2019 & 2032
- Table 44: Global Real Time Payments Market Volume K Unit Forecast, by Type of Payment 2019 & 2032
- Table 45: Global Real Time Payments Market Revenue Million Forecast, by Country 2019 & 2032
- Table 46: Global Real Time Payments Market Volume K Unit Forecast, by Country 2019 & 2032
- Table 47: China Real Time Payments Market Revenue (Million) Forecast, by Application 2019 & 2032
- Table 48: China Real Time Payments Market Volume (K Unit) Forecast, by Application 2019 & 2032
- Table 49: India Real Time Payments Market Revenue (Million) Forecast, by Application 2019 & 2032
- Table 50: India Real Time Payments Market Volume (K Unit) Forecast, by Application 2019 & 2032
- Table 51: South Korea Real Time Payments Market Revenue (Million) Forecast, by Application 2019 & 2032
- Table 52: South Korea Real Time Payments Market Volume (K Unit) Forecast, by Application 2019 & 2032
- Table 53: Thailand Real Time Payments Market Revenue (Million) Forecast, by Application 2019 & 2032
- Table 54: Thailand Real Time Payments Market Volume (K Unit) Forecast, by Application 2019 & 2032
- Table 55: Japan Real Time Payments Market Revenue (Million) Forecast, by Application 2019 & 2032
- Table 56: Japan Real Time Payments Market Volume (K Unit) Forecast, by Application 2019 & 2032
- Table 57: Rest of Asia Pacific Real Time Payments Market Revenue (Million) Forecast, by Application 2019 & 2032
- Table 58: Rest of Asia Pacific Real Time Payments Market Volume (K Unit) Forecast, by Application 2019 & 2032
- Table 59: Global Real Time Payments Market Revenue Million Forecast, by Type of Payment 2019 & 2032
- Table 60: Global Real Time Payments Market Volume K Unit Forecast, by Type of Payment 2019 & 2032
- Table 61: Global Real Time Payments Market Revenue Million Forecast, by Country 2019 & 2032
- Table 62: Global Real Time Payments Market Volume K Unit Forecast, by Country 2019 & 2032
- Table 63: Brazil Real Time Payments Market Revenue (Million) Forecast, by Application 2019 & 2032
- Table 64: Brazil Real Time Payments Market Volume (K Unit) Forecast, by Application 2019 & 2032
- Table 65: Argentina Real Time Payments Market Revenue (Million) Forecast, by Application 2019 & 2032
- Table 66: Argentina Real Time Payments Market Volume (K Unit) Forecast, by Application 2019 & 2032
- Table 67: Colombia Real Time Payments Market Revenue (Million) Forecast, by Application 2019 & 2032
- Table 68: Colombia Real Time Payments Market Volume (K Unit) Forecast, by Application 2019 & 2032
- Table 69: Mexico Real Time Payments Market Revenue (Million) Forecast, by Application 2019 & 2032
- Table 70: Mexico Real Time Payments Market Volume (K Unit) Forecast, by Application 2019 & 2032
- Table 71: Rest of Latin America Real Time Payments Market Revenue (Million) Forecast, by Application 2019 & 2032
- Table 72: Rest of Latin America Real Time Payments Market Volume (K Unit) Forecast, by Application 2019 & 2032
- Table 73: Global Real Time Payments Market Revenue Million Forecast, by Type of Payment 2019 & 2032
- Table 74: Global Real Time Payments Market Volume K Unit Forecast, by Type of Payment 2019 & 2032
- Table 75: Global Real Time Payments Market Revenue Million Forecast, by Country 2019 & 2032
- Table 76: Global Real Time Payments Market Volume K Unit Forecast, by Country 2019 & 2032
- Table 77: United Arab Emirates Real Time Payments Market Revenue (Million) Forecast, by Application 2019 & 2032
- Table 78: United Arab Emirates Real Time Payments Market Volume (K Unit) Forecast, by Application 2019 & 2032
- Table 79: South Africa Real Time Payments Market Revenue (Million) Forecast, by Application 2019 & 2032
- Table 80: South Africa Real Time Payments Market Volume (K Unit) Forecast, by Application 2019 & 2032
- Table 81: Nigeria Real Time Payments Market Revenue (Million) Forecast, by Application 2019 & 2032
- Table 82: Nigeria Real Time Payments Market Volume (K Unit) Forecast, by Application 2019 & 2032
- Table 83: Rest of Middle East and Africa Real Time Payments Market Revenue (Million) Forecast, by Application 2019 & 2032
- Table 84: Rest of Middle East and Africa Real Time Payments Market Volume (K Unit) Forecast, by Application 2019 & 2032
Frequently Asked Questions
1. What is the projected Compound Annual Growth Rate (CAGR) of the Real Time Payments Market?
The projected CAGR is approximately 35.00%.
2. Which companies are prominent players in the Real Time Payments Market?
Key companies in the market include Visa Inc, Montran Corporation, Wirecard AG, Fiserv Inc, Volante Technologies Inc, Temenos AG, FIS Global, Finastra, Mastercard Inc, ACI Worldwide Inc, Paypal Holdings Inc.
3. What are the main segments of the Real Time Payments Market?
The market segments include Type of Payment.
4. Can you provide details about the market size?
The market size is estimated to be USD 25.92 Million as of 2022.
5. What are some drivers contributing to market growth?
Increased Smartphone Penetration; Ease of Convenience; Falling Reliance on Traditional Banking.
6. What are the notable trends driving market growth?
P2B Segment Holds the Key to Drive the Market.
7. Are there any restraints impacting market growth?
Operational Challenges Involving Cross-border Payments.
8. Can you provide examples of recent developments in the market?
Apr 2023: Visa announced a partnership with PayPal and Venmo to pilot Visa+, an innovative service that aims to enable individuals to move money quickly and securely between different person-to-person (P2P) digital payment apps. Later in 2023, Venmo and PayPal users in the United States will be able to start moving money seamlessly between the two platforms.
9. What pricing options are available for accessing the report?
Pricing options include single-user, multi-user, and enterprise licenses priced at USD 4750, USD 5250, and USD 8750 respectively.
10. Is the market size provided in terms of value or volume?
The market size is provided in terms of value, measured in Million and volume, measured in K Unit.
11. Are there any specific market keywords associated with the report?
Yes, the market keyword associated with the report is "Real Time Payments Market," which aids in identifying and referencing the specific market segment covered.
12. How do I determine which pricing option suits my needs best?
The pricing options vary based on user requirements and access needs. Individual users may opt for single-user licenses, while businesses requiring broader access may choose multi-user or enterprise licenses for cost-effective access to the report.
13. Are there any additional resources or data provided in the Real Time Payments Market report?
While the report offers comprehensive insights, it's advisable to review the specific contents or supplementary materials provided to ascertain if additional resources or data are available.
14. How can I stay updated on further developments or reports in the Real Time Payments Market?
To stay informed about further developments, trends, and reports in the Real Time Payments Market, consider subscribing to industry newsletters, following relevant companies and organizations, or regularly checking reputable industry news sources and publications.
Methodology
Step 1 - Identification of Relevant Samples Size from Population Database


Step 2 - Approaches for Defining Global Market Size (Value, Volume* & Price*)

Note*: In applicable scenarios
Step 3 - Data Sources
Primary Research
- Web Analytics
- Survey Reports
- Research Institute
- Latest Research Reports
- Opinion Leaders
Secondary Research
- Annual Reports
- White Paper
- Latest Press Release
- Industry Association
- Paid Database
- Investor Presentations

Step 4 - Data Triangulation
Involves using different sources of information in order to increase the validity of a study
These sources are likely to be stakeholders in a program - participants, other researchers, program staff, other community members, and so on.
Then we put all data in single framework & apply various statistical tools to find out the dynamic on the market.
During the analysis stage, feedback from the stakeholder groups would be compared to determine areas of agreement as well as areas of divergence


