
Key Insights
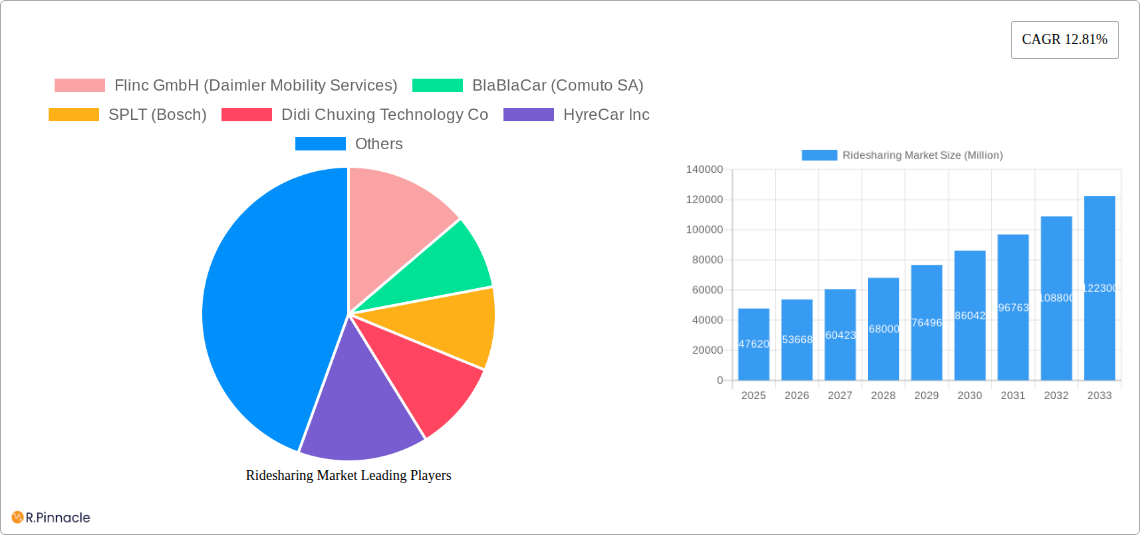
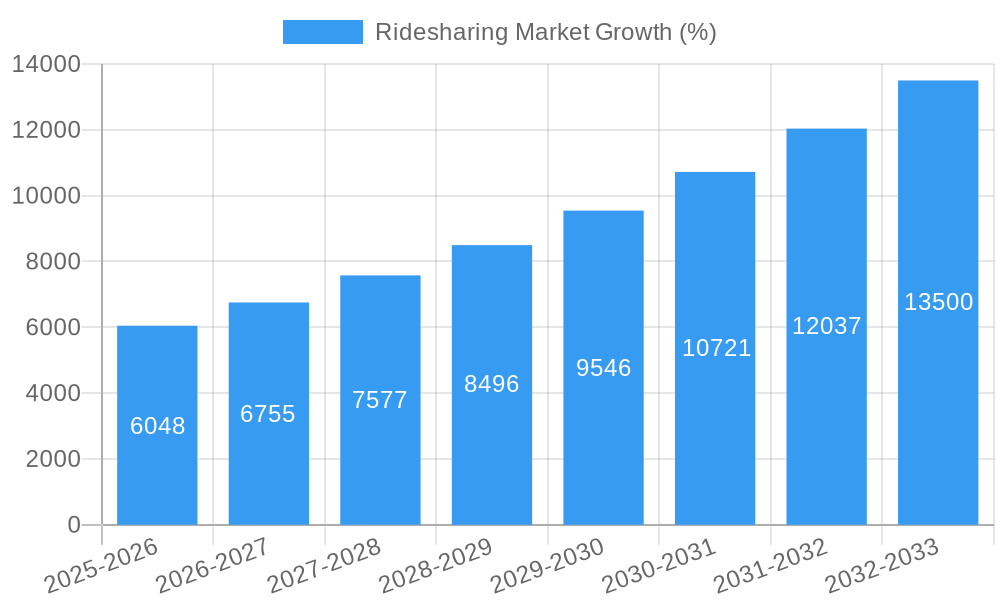
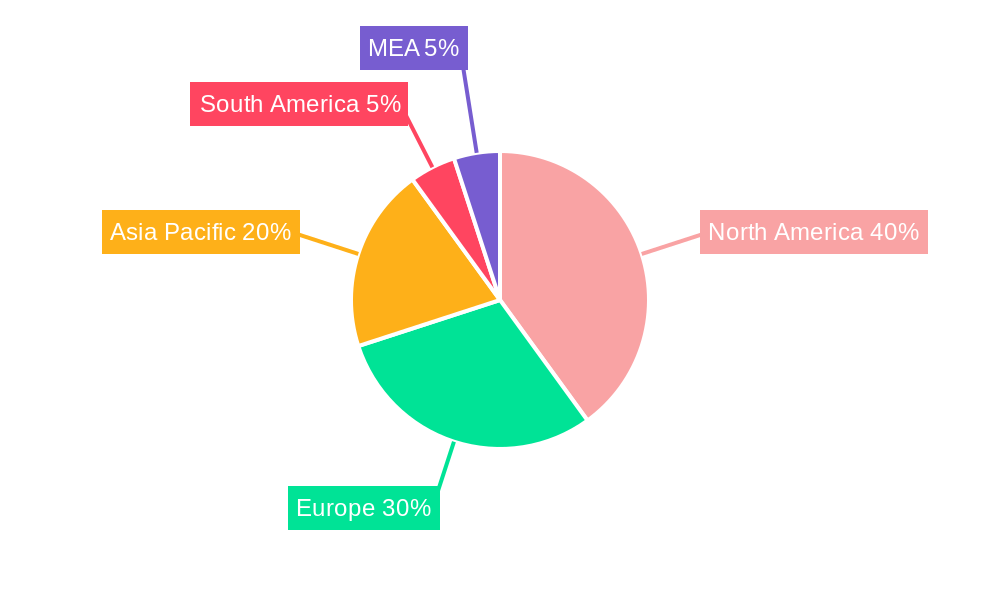
The ridesharing market, valued at $47.62 billion in 2025, is projected to experience robust growth, driven by increasing urbanization, rising fuel prices, and growing environmental concerns. The market's Compound Annual Growth Rate (CAGR) of 12.81% from 2025 to 2033 signifies a significant expansion, with the market size exceeding $150 billion by 2033 (this projection is based on the provided CAGR and 2025 market size). Key drivers include the convenience and affordability offered by ridesharing services, particularly for urban commuters and those in areas with limited public transportation. The shift towards app-based services continues to dominate the market, facilitated by smartphone penetration and technological advancements. However, regulatory hurdles, concerns about driver safety and compensation, and intense competition among existing players pose significant challenges to market growth. Segmentation reveals strong growth in dynamic ridesharing, reflecting the flexibility and on-demand nature of the service. Corporate ridesharing is also expected to expand significantly as businesses seek cost-effective transportation solutions for employees. Geographical analysis indicates that North America and Europe currently hold the largest market share, but Asia-Pacific is poised for rapid expansion due to its burgeoning population and rising middle class.
The competitive landscape is characterized by a mix of established players like Didi Chuxing and newer entrants. Strategic partnerships, technological innovations, and aggressive expansion into new markets are key strategies employed by companies to gain market share. The market's future trajectory will depend heavily on the resolution of regulatory issues, adoption of sustainable practices, and continuous innovation in areas such as autonomous vehicle technology and integrated transportation solutions. Successful players will need to adapt to evolving consumer preferences, prioritize driver well-being, and maintain a balance between profitability and affordability. The increasing integration of ridesharing with other mobility services will also shape the market’s future, creating opportunities for interconnected and multimodal transportation ecosystems. Furthermore, factors like the increasing adoption of electric vehicles and the rise of micro-mobility options will also impact growth in the coming years.
Ridesharing Market Report: 2019-2033
This comprehensive report provides an in-depth analysis of the Ridesharing Market, offering invaluable insights for industry professionals, investors, and strategic decision-makers. With a study period spanning 2019-2033, a base year of 2025, and a forecast period of 2025-2033, this report delivers a complete picture of the market's past performance, present state, and future trajectory. The report analyzes key segments, dominant players, and emerging trends, providing actionable intelligence to navigate the dynamic landscape of the ridesharing industry. The market is projected to reach xx Million by 2033, presenting significant growth opportunities.
Ridesharing Market Structure & Innovation Trends
The ridesharing market is characterized by a complex interplay of established giants and emerging players. Market concentration is moderate, with a few dominant players holding significant market share, while numerous smaller companies compete in niche segments. Innovation is driven by advancements in technology, including AI-powered route optimization, autonomous vehicle development, and the integration of various mobility services. Regulatory frameworks vary widely across different regions, impacting market entry and operations. Key product substitutes include traditional taxis, public transportation, and personal vehicle ownership. The end-user demographic is broad, ranging from individual commuters to corporate clients. The market has witnessed considerable M&A activity in recent years, with deals reaching values of xx Million.
- Market Share: Didi Chuxing holds a significant share in Asia, while Uber and Lyft dominate in North America. Other players like BlaBlaCar and Via Transportation hold regional strongholds.
- M&A Activity: Recent mergers and acquisitions have included Vride Inc's acquisition by Enterprise Holdings Inc., demonstrating consolidation trends within the sector. Total M&A deal value during the historical period (2019-2024) is estimated at xx Million.
Ridesharing Market Dynamics & Trends
The ridesharing market is experiencing robust growth, driven by several factors. Increasing urbanization and traffic congestion are propelling the demand for convenient and efficient transportation solutions. Technological advancements, such as the development of ride-hailing apps and autonomous vehicles, are enhancing the user experience and expanding market reach. Changing consumer preferences toward on-demand services and shared mobility are significantly impacting market growth. Competitive dynamics are intense, with companies constantly innovating to attract and retain customers, offering diverse service options and loyalty programs. The Compound Annual Growth Rate (CAGR) from 2025-2033 is projected to be xx%, and market penetration is expected to increase by xx% in major urban areas by 2033.
Dominant Regions & Segments in Ridesharing Market
The North American and Asian markets currently lead the global ridesharing industry, exhibiting high adoption rates and substantial market sizes.
- By Membership Type:
- Dynamic Ridesharing: This segment dominates due to its flexibility and convenience, accounting for xx Million in 2025. Key drivers include the ease of access, affordability, and widespread app availability.
- Fixed Ridesharing: This segment shows steady growth, driven by corporate partnerships and increasing awareness of its benefits. The market size for this segment in 2025 is estimated at xx Million.
- Corporate Ridesharing: This sector experiences growth as companies seek cost-effective and efficient employee transportation solutions. The 2025 market size is predicted to be xx Million.
- By Service Type:
- App-Based Ridesharing: This segment accounts for the largest market share (xx Million in 2025) due to its user-friendliness and widespread adoption of smartphones.
- Web-Based and App-Based Ridesharing: This segment shows significant growth potential due to its expanded reach and combined benefits of web and app platforms. The market size is expected to reach xx Million by 2025.
Ridesharing Market Product Innovations
Recent innovations include the integration of AI for optimized routes and pricing, the development of electric vehicle fleets to reduce environmental impact, and the expansion of service offerings beyond passenger transportation to include goods delivery and other mobility solutions. These innovations aim to enhance user experience, improve efficiency, and address sustainability concerns, aligning with evolving market demands and enhancing competitiveness.
Report Scope & Segmentation Analysis
This report offers a comprehensive segmentation analysis, categorizing the ridesharing market by membership type (Fixed, Dynamic, Corporate) and service type (Web-Based, App-Based, Web and App-Based). Each segment is analyzed for its size, growth projections, and competitive dynamics. For example, the Dynamic Ridesharing segment is expected to experience significant growth driven by increasing smartphone penetration and the convenience of on-demand services. The App-Based segment is currently the dominant service type due to its ease of use and accessibility.
Key Drivers of Ridesharing Market Growth
Several key factors contribute to the ridesharing market's growth: increasing urbanization and traffic congestion, rising disposable incomes, advancements in mobile technology, the growing popularity of on-demand services, and supportive government regulations in certain regions. The development of electric vehicle fleets and autonomous driving technologies further fuels market expansion by addressing environmental concerns and improving operational efficiency.
Challenges in the Ridesharing Market Sector
The ridesharing market faces significant challenges including stringent regulatory environments in some regions, intense competition leading to price wars and margin compression, concerns regarding driver compensation and employment status, and safety and security issues. These factors can impact market growth and profitability, requiring companies to adopt innovative strategies for sustainable operations.
Emerging Opportunities in Ridesharing Market
The ridesharing market presents significant opportunities in emerging markets with growing populations and increasing smartphone penetration. The integration of ridesharing with public transport, the development of micro-mobility solutions (e-scooters, e-bikes), and the expansion into specialized niche markets (e.g., corporate transportation, elderly care) offer lucrative growth potential. Furthermore, the adoption of autonomous vehicle technology presents a transformative opportunity to enhance efficiency and reduce costs.
Leading Players in the Ridesharing Market Market
- Flinc GmbH (Daimler Mobility Services)
- BlaBlaCar (Comuto SA)
- SPLT (Bosch)
- Didi Chuxing Technology Co
- HyreCar Inc
- KINTO Join Limited
- Wunder Mobility Solutions GmbH
- Kangaride Canada Co
- GoMore
- Klaxit SAS (formerly Wayzup)
- Scoop Technologies Inc
- Vride Inc (Acquired by Enterprise Holdings Inc)
- CarpoolWorld (Datasphere Corporation)
- Via Transportation Inc
- Zimride Inc
Key Developments in Ridesharing Market Industry
- June 2022: Uber launches UberX Share, offering a 20% discount for sharing rides, stimulating market competition and potentially increasing ridership.
- February 2022: Avolon and AirAsia partner to develop a ridesharing platform using eVTOL aircraft in Southeast Asia, signaling a shift towards advanced air mobility and potentially disrupting existing ground-based ridesharing models.
Future Outlook for Ridesharing Market Market
The ridesharing market is poised for continued growth, driven by technological advancements, expanding urban populations, and evolving consumer preferences. Strategic opportunities lie in expanding into underserved markets, investing in sustainable transportation solutions, and leveraging data analytics to optimize operations and enhance customer experience. The integration of autonomous vehicles and the development of advanced air mobility services will further reshape the industry's landscape and unlock new market potential.
Ridesharing Market Segmentation
-
1. Membership Type
- 1.1. Fixed Ridesharing
- 1.2. Dynamic Ridesharing
- 1.3. Corporate Ridesharing
-
2. Service Type
- 2.1. Web-Based
- 2.2. App-Based
- 2.3. Web and App Based
Ridesharing Market Segmentation By Geography
- 1. North America
- 2. Europe
- 3. Asia
- 4. Australia and New Zealand
- 5. Latin America
- 6. Middle East and Africa
Ridesharing Market REPORT HIGHLIGHTS
| Aspects | Details |
|---|---|
| Study Period | 2019-2033 |
| Base Year | 2024 |
| Estimated Year | 2025 |
| Forecast Period | 2025-2033 |
| Historical Period | 2019-2024 |
| Growth Rate | CAGR of 12.81% from 2019-2033 |
| Segmentation |
|
Table of Contents
- 1. Introduction
- 1.1. Research Scope
- 1.2. Market Segmentation
- 1.3. Research Methodology
- 1.4. Definitions and Assumptions
- 2. Executive Summary
- 2.1. Introduction
- 3. Market Dynamics
- 3.1. Introduction
- 3.2. Market Drivers
- 3.2.1 Cost Advantage and Increasing Availability of Carpooling/Corporate Pooling Services; Incentives and Rebates Provided by Governments in Major Markets
- 3.2.2 such as France; Increasing Cost of Vehicle Ownership and Environmental Benefits
- 3.3. Market Restrains
- 3.3.1. Technical Challenges Pertaining to CMP Technique
- 3.4. Market Trends
- 3.4.1. COVID-19 Has Posed Significant Threat to the Market
- 4. Market Factor Analysis
- 4.1. Porters Five Forces
- 4.2. Supply/Value Chain
- 4.3. PESTEL analysis
- 4.4. Market Entropy
- 4.5. Patent/Trademark Analysis
- 5. Global Ridesharing Market Analysis, Insights and Forecast, 2019-2031
- 5.1. Market Analysis, Insights and Forecast - by Membership Type
- 5.1.1. Fixed Ridesharing
- 5.1.2. Dynamic Ridesharing
- 5.1.3. Corporate Ridesharing
- 5.2. Market Analysis, Insights and Forecast - by Service Type
- 5.2.1. Web-Based
- 5.2.2. App-Based
- 5.2.3. Web and App Based
- 5.3. Market Analysis, Insights and Forecast - by Region
- 5.3.1. North America
- 5.3.2. Europe
- 5.3.3. Asia
- 5.3.4. Australia and New Zealand
- 5.3.5. Latin America
- 5.3.6. Middle East and Africa
- 5.1. Market Analysis, Insights and Forecast - by Membership Type
- 6. North America Ridesharing Market Analysis, Insights and Forecast, 2019-2031
- 6.1. Market Analysis, Insights and Forecast - by Membership Type
- 6.1.1. Fixed Ridesharing
- 6.1.2. Dynamic Ridesharing
- 6.1.3. Corporate Ridesharing
- 6.2. Market Analysis, Insights and Forecast - by Service Type
- 6.2.1. Web-Based
- 6.2.2. App-Based
- 6.2.3. Web and App Based
- 6.1. Market Analysis, Insights and Forecast - by Membership Type
- 7. Europe Ridesharing Market Analysis, Insights and Forecast, 2019-2031
- 7.1. Market Analysis, Insights and Forecast - by Membership Type
- 7.1.1. Fixed Ridesharing
- 7.1.2. Dynamic Ridesharing
- 7.1.3. Corporate Ridesharing
- 7.2. Market Analysis, Insights and Forecast - by Service Type
- 7.2.1. Web-Based
- 7.2.2. App-Based
- 7.2.3. Web and App Based
- 7.1. Market Analysis, Insights and Forecast - by Membership Type
- 8. Asia Ridesharing Market Analysis, Insights and Forecast, 2019-2031
- 8.1. Market Analysis, Insights and Forecast - by Membership Type
- 8.1.1. Fixed Ridesharing
- 8.1.2. Dynamic Ridesharing
- 8.1.3. Corporate Ridesharing
- 8.2. Market Analysis, Insights and Forecast - by Service Type
- 8.2.1. Web-Based
- 8.2.2. App-Based
- 8.2.3. Web and App Based
- 8.1. Market Analysis, Insights and Forecast - by Membership Type
- 9. Australia and New Zealand Ridesharing Market Analysis, Insights and Forecast, 2019-2031
- 9.1. Market Analysis, Insights and Forecast - by Membership Type
- 9.1.1. Fixed Ridesharing
- 9.1.2. Dynamic Ridesharing
- 9.1.3. Corporate Ridesharing
- 9.2. Market Analysis, Insights and Forecast - by Service Type
- 9.2.1. Web-Based
- 9.2.2. App-Based
- 9.2.3. Web and App Based
- 9.1. Market Analysis, Insights and Forecast - by Membership Type
- 10. Latin America Ridesharing Market Analysis, Insights and Forecast, 2019-2031
- 10.1. Market Analysis, Insights and Forecast - by Membership Type
- 10.1.1. Fixed Ridesharing
- 10.1.2. Dynamic Ridesharing
- 10.1.3. Corporate Ridesharing
- 10.2. Market Analysis, Insights and Forecast - by Service Type
- 10.2.1. Web-Based
- 10.2.2. App-Based
- 10.2.3. Web and App Based
- 10.1. Market Analysis, Insights and Forecast - by Membership Type
- 11. Middle East and Africa Ridesharing Market Analysis, Insights and Forecast, 2019-2031
- 11.1. Market Analysis, Insights and Forecast - by Membership Type
- 11.1.1. Fixed Ridesharing
- 11.1.2. Dynamic Ridesharing
- 11.1.3. Corporate Ridesharing
- 11.2. Market Analysis, Insights and Forecast - by Service Type
- 11.2.1. Web-Based
- 11.2.2. App-Based
- 11.2.3. Web and App Based
- 11.1. Market Analysis, Insights and Forecast - by Membership Type
- 12. North America Ridesharing Market Analysis, Insights and Forecast, 2019-2031
- 12.1. Market Analysis, Insights and Forecast - By Country/Sub-region
- 12.1.1 United States
- 12.1.2 Canada
- 12.1.3 Mexico
- 13. Europe Ridesharing Market Analysis, Insights and Forecast, 2019-2031
- 13.1. Market Analysis, Insights and Forecast - By Country/Sub-region
- 13.1.1 Germany
- 13.1.2 United Kingdom
- 13.1.3 France
- 13.1.4 Spain
- 13.1.5 Italy
- 13.1.6 Spain
- 13.1.7 Belgium
- 13.1.8 Netherland
- 13.1.9 Nordics
- 13.1.10 Rest of Europe
- 14. Asia Pacific Ridesharing Market Analysis, Insights and Forecast, 2019-2031
- 14.1. Market Analysis, Insights and Forecast - By Country/Sub-region
- 14.1.1 China
- 14.1.2 Japan
- 14.1.3 India
- 14.1.4 South Korea
- 14.1.5 Southeast Asia
- 14.1.6 Australia
- 14.1.7 Indonesia
- 14.1.8 Phillipes
- 14.1.9 Singapore
- 14.1.10 Thailandc
- 14.1.11 Rest of Asia Pacific
- 15. South America Ridesharing Market Analysis, Insights and Forecast, 2019-2031
- 15.1. Market Analysis, Insights and Forecast - By Country/Sub-region
- 15.1.1 Brazil
- 15.1.2 Argentina
- 15.1.3 Peru
- 15.1.4 Chile
- 15.1.5 Colombia
- 15.1.6 Ecuador
- 15.1.7 Venezuela
- 15.1.8 Rest of South America
- 16. North America Ridesharing Market Analysis, Insights and Forecast, 2019-2031
- 16.1. Market Analysis, Insights and Forecast - By Country/Sub-region
- 16.1.1 United States
- 16.1.2 Canada
- 16.1.3 Mexico
- 17. MEA Ridesharing Market Analysis, Insights and Forecast, 2019-2031
- 17.1. Market Analysis, Insights and Forecast - By Country/Sub-region
- 17.1.1 United Arab Emirates
- 17.1.2 Saudi Arabia
- 17.1.3 South Africa
- 17.1.4 Rest of Middle East and Africa
- 18. Competitive Analysis
- 18.1. Global Market Share Analysis 2024
- 18.2. Company Profiles
- 18.2.1 Flinc GmbH (Daimler Mobility Services)
- 18.2.1.1. Overview
- 18.2.1.2. Products
- 18.2.1.3. SWOT Analysis
- 18.2.1.4. Recent Developments
- 18.2.1.5. Financials (Based on Availability)
- 18.2.2 BlaBlaCar (Comuto SA)
- 18.2.2.1. Overview
- 18.2.2.2. Products
- 18.2.2.3. SWOT Analysis
- 18.2.2.4. Recent Developments
- 18.2.2.5. Financials (Based on Availability)
- 18.2.3 SPLT (Bosch)
- 18.2.3.1. Overview
- 18.2.3.2. Products
- 18.2.3.3. SWOT Analysis
- 18.2.3.4. Recent Developments
- 18.2.3.5. Financials (Based on Availability)
- 18.2.4 Didi Chuxing Technology Co
- 18.2.4.1. Overview
- 18.2.4.2. Products
- 18.2.4.3. SWOT Analysis
- 18.2.4.4. Recent Developments
- 18.2.4.5. Financials (Based on Availability)
- 18.2.5 HyreCar Inc
- 18.2.5.1. Overview
- 18.2.5.2. Products
- 18.2.5.3. SWOT Analysis
- 18.2.5.4. Recent Developments
- 18.2.5.5. Financials (Based on Availability)
- 18.2.6 KINTO Join Limited
- 18.2.6.1. Overview
- 18.2.6.2. Products
- 18.2.6.3. SWOT Analysis
- 18.2.6.4. Recent Developments
- 18.2.6.5. Financials (Based on Availability)
- 18.2.7 Wunder Mobility Solutions GmbH
- 18.2.7.1. Overview
- 18.2.7.2. Products
- 18.2.7.3. SWOT Analysis
- 18.2.7.4. Recent Developments
- 18.2.7.5. Financials (Based on Availability)
- 18.2.8 Kangaride Canada Co
- 18.2.8.1. Overview
- 18.2.8.2. Products
- 18.2.8.3. SWOT Analysis
- 18.2.8.4. Recent Developments
- 18.2.8.5. Financials (Based on Availability)
- 18.2.9 GoMore
- 18.2.9.1. Overview
- 18.2.9.2. Products
- 18.2.9.3. SWOT Analysis
- 18.2.9.4. Recent Developments
- 18.2.9.5. Financials (Based on Availability)
- 18.2.10 Klaxit SAS (formerly Wayzup)
- 18.2.10.1. Overview
- 18.2.10.2. Products
- 18.2.10.3. SWOT Analysis
- 18.2.10.4. Recent Developments
- 18.2.10.5. Financials (Based on Availability)
- 18.2.11 Scoop Technologies Inc
- 18.2.11.1. Overview
- 18.2.11.2. Products
- 18.2.11.3. SWOT Analysis
- 18.2.11.4. Recent Developments
- 18.2.11.5. Financials (Based on Availability)
- 18.2.12 Vride Inc (Acquired by Enterprise Holdings Inc
- 18.2.12.1. Overview
- 18.2.12.2. Products
- 18.2.12.3. SWOT Analysis
- 18.2.12.4. Recent Developments
- 18.2.12.5. Financials (Based on Availability)
- 18.2.13 CarpoolWorld (Datasphere Corporation)
- 18.2.13.1. Overview
- 18.2.13.2. Products
- 18.2.13.3. SWOT Analysis
- 18.2.13.4. Recent Developments
- 18.2.13.5. Financials (Based on Availability)
- 18.2.14 Via Transportation Inc
- 18.2.14.1. Overview
- 18.2.14.2. Products
- 18.2.14.3. SWOT Analysis
- 18.2.14.4. Recent Developments
- 18.2.14.5. Financials (Based on Availability)
- 18.2.15 Zimride Inc
- 18.2.15.1. Overview
- 18.2.15.2. Products
- 18.2.15.3. SWOT Analysis
- 18.2.15.4. Recent Developments
- 18.2.15.5. Financials (Based on Availability)
- 18.2.1 Flinc GmbH (Daimler Mobility Services)
List of Figures
- Figure 1: Global Ridesharing Market Revenue Breakdown (Million, %) by Region 2024 & 2032
- Figure 2: North America Ridesharing Market Revenue (Million), by Country 2024 & 2032
- Figure 3: North America Ridesharing Market Revenue Share (%), by Country 2024 & 2032
- Figure 4: Europe Ridesharing Market Revenue (Million), by Country 2024 & 2032
- Figure 5: Europe Ridesharing Market Revenue Share (%), by Country 2024 & 2032
- Figure 6: Asia Pacific Ridesharing Market Revenue (Million), by Country 2024 & 2032
- Figure 7: Asia Pacific Ridesharing Market Revenue Share (%), by Country 2024 & 2032
- Figure 8: South America Ridesharing Market Revenue (Million), by Country 2024 & 2032
- Figure 9: South America Ridesharing Market Revenue Share (%), by Country 2024 & 2032
- Figure 10: North America Ridesharing Market Revenue (Million), by Country 2024 & 2032
- Figure 11: North America Ridesharing Market Revenue Share (%), by Country 2024 & 2032
- Figure 12: MEA Ridesharing Market Revenue (Million), by Country 2024 & 2032
- Figure 13: MEA Ridesharing Market Revenue Share (%), by Country 2024 & 2032
- Figure 14: North America Ridesharing Market Revenue (Million), by Membership Type 2024 & 2032
- Figure 15: North America Ridesharing Market Revenue Share (%), by Membership Type 2024 & 2032
- Figure 16: North America Ridesharing Market Revenue (Million), by Service Type 2024 & 2032
- Figure 17: North America Ridesharing Market Revenue Share (%), by Service Type 2024 & 2032
- Figure 18: North America Ridesharing Market Revenue (Million), by Country 2024 & 2032
- Figure 19: North America Ridesharing Market Revenue Share (%), by Country 2024 & 2032
- Figure 20: Europe Ridesharing Market Revenue (Million), by Membership Type 2024 & 2032
- Figure 21: Europe Ridesharing Market Revenue Share (%), by Membership Type 2024 & 2032
- Figure 22: Europe Ridesharing Market Revenue (Million), by Service Type 2024 & 2032
- Figure 23: Europe Ridesharing Market Revenue Share (%), by Service Type 2024 & 2032
- Figure 24: Europe Ridesharing Market Revenue (Million), by Country 2024 & 2032
- Figure 25: Europe Ridesharing Market Revenue Share (%), by Country 2024 & 2032
- Figure 26: Asia Ridesharing Market Revenue (Million), by Membership Type 2024 & 2032
- Figure 27: Asia Ridesharing Market Revenue Share (%), by Membership Type 2024 & 2032
- Figure 28: Asia Ridesharing Market Revenue (Million), by Service Type 2024 & 2032
- Figure 29: Asia Ridesharing Market Revenue Share (%), by Service Type 2024 & 2032
- Figure 30: Asia Ridesharing Market Revenue (Million), by Country 2024 & 2032
- Figure 31: Asia Ridesharing Market Revenue Share (%), by Country 2024 & 2032
- Figure 32: Australia and New Zealand Ridesharing Market Revenue (Million), by Membership Type 2024 & 2032
- Figure 33: Australia and New Zealand Ridesharing Market Revenue Share (%), by Membership Type 2024 & 2032
- Figure 34: Australia and New Zealand Ridesharing Market Revenue (Million), by Service Type 2024 & 2032
- Figure 35: Australia and New Zealand Ridesharing Market Revenue Share (%), by Service Type 2024 & 2032
- Figure 36: Australia and New Zealand Ridesharing Market Revenue (Million), by Country 2024 & 2032
- Figure 37: Australia and New Zealand Ridesharing Market Revenue Share (%), by Country 2024 & 2032
- Figure 38: Latin America Ridesharing Market Revenue (Million), by Membership Type 2024 & 2032
- Figure 39: Latin America Ridesharing Market Revenue Share (%), by Membership Type 2024 & 2032
- Figure 40: Latin America Ridesharing Market Revenue (Million), by Service Type 2024 & 2032
- Figure 41: Latin America Ridesharing Market Revenue Share (%), by Service Type 2024 & 2032
- Figure 42: Latin America Ridesharing Market Revenue (Million), by Country 2024 & 2032
- Figure 43: Latin America Ridesharing Market Revenue Share (%), by Country 2024 & 2032
- Figure 44: Middle East and Africa Ridesharing Market Revenue (Million), by Membership Type 2024 & 2032
- Figure 45: Middle East and Africa Ridesharing Market Revenue Share (%), by Membership Type 2024 & 2032
- Figure 46: Middle East and Africa Ridesharing Market Revenue (Million), by Service Type 2024 & 2032
- Figure 47: Middle East and Africa Ridesharing Market Revenue Share (%), by Service Type 2024 & 2032
- Figure 48: Middle East and Africa Ridesharing Market Revenue (Million), by Country 2024 & 2032
- Figure 49: Middle East and Africa Ridesharing Market Revenue Share (%), by Country 2024 & 2032
List of Tables
- Table 1: Global Ridesharing Market Revenue Million Forecast, by Region 2019 & 2032
- Table 2: Global Ridesharing Market Revenue Million Forecast, by Membership Type 2019 & 2032
- Table 3: Global Ridesharing Market Revenue Million Forecast, by Service Type 2019 & 2032
- Table 4: Global Ridesharing Market Revenue Million Forecast, by Region 2019 & 2032
- Table 5: Global Ridesharing Market Revenue Million Forecast, by Country 2019 & 2032
- Table 6: United States Ridesharing Market Revenue (Million) Forecast, by Application 2019 & 2032
- Table 7: Canada Ridesharing Market Revenue (Million) Forecast, by Application 2019 & 2032
- Table 8: Mexico Ridesharing Market Revenue (Million) Forecast, by Application 2019 & 2032
- Table 9: Global Ridesharing Market Revenue Million Forecast, by Country 2019 & 2032
- Table 10: Germany Ridesharing Market Revenue (Million) Forecast, by Application 2019 & 2032
- Table 11: United Kingdom Ridesharing Market Revenue (Million) Forecast, by Application 2019 & 2032
- Table 12: France Ridesharing Market Revenue (Million) Forecast, by Application 2019 & 2032
- Table 13: Spain Ridesharing Market Revenue (Million) Forecast, by Application 2019 & 2032
- Table 14: Italy Ridesharing Market Revenue (Million) Forecast, by Application 2019 & 2032
- Table 15: Spain Ridesharing Market Revenue (Million) Forecast, by Application 2019 & 2032
- Table 16: Belgium Ridesharing Market Revenue (Million) Forecast, by Application 2019 & 2032
- Table 17: Netherland Ridesharing Market Revenue (Million) Forecast, by Application 2019 & 2032
- Table 18: Nordics Ridesharing Market Revenue (Million) Forecast, by Application 2019 & 2032
- Table 19: Rest of Europe Ridesharing Market Revenue (Million) Forecast, by Application 2019 & 2032
- Table 20: Global Ridesharing Market Revenue Million Forecast, by Country 2019 & 2032
- Table 21: China Ridesharing Market Revenue (Million) Forecast, by Application 2019 & 2032
- Table 22: Japan Ridesharing Market Revenue (Million) Forecast, by Application 2019 & 2032
- Table 23: India Ridesharing Market Revenue (Million) Forecast, by Application 2019 & 2032
- Table 24: South Korea Ridesharing Market Revenue (Million) Forecast, by Application 2019 & 2032
- Table 25: Southeast Asia Ridesharing Market Revenue (Million) Forecast, by Application 2019 & 2032
- Table 26: Australia Ridesharing Market Revenue (Million) Forecast, by Application 2019 & 2032
- Table 27: Indonesia Ridesharing Market Revenue (Million) Forecast, by Application 2019 & 2032
- Table 28: Phillipes Ridesharing Market Revenue (Million) Forecast, by Application 2019 & 2032
- Table 29: Singapore Ridesharing Market Revenue (Million) Forecast, by Application 2019 & 2032
- Table 30: Thailandc Ridesharing Market Revenue (Million) Forecast, by Application 2019 & 2032
- Table 31: Rest of Asia Pacific Ridesharing Market Revenue (Million) Forecast, by Application 2019 & 2032
- Table 32: Global Ridesharing Market Revenue Million Forecast, by Country 2019 & 2032
- Table 33: Brazil Ridesharing Market Revenue (Million) Forecast, by Application 2019 & 2032
- Table 34: Argentina Ridesharing Market Revenue (Million) Forecast, by Application 2019 & 2032
- Table 35: Peru Ridesharing Market Revenue (Million) Forecast, by Application 2019 & 2032
- Table 36: Chile Ridesharing Market Revenue (Million) Forecast, by Application 2019 & 2032
- Table 37: Colombia Ridesharing Market Revenue (Million) Forecast, by Application 2019 & 2032
- Table 38: Ecuador Ridesharing Market Revenue (Million) Forecast, by Application 2019 & 2032
- Table 39: Venezuela Ridesharing Market Revenue (Million) Forecast, by Application 2019 & 2032
- Table 40: Rest of South America Ridesharing Market Revenue (Million) Forecast, by Application 2019 & 2032
- Table 41: Global Ridesharing Market Revenue Million Forecast, by Country 2019 & 2032
- Table 42: United States Ridesharing Market Revenue (Million) Forecast, by Application 2019 & 2032
- Table 43: Canada Ridesharing Market Revenue (Million) Forecast, by Application 2019 & 2032
- Table 44: Mexico Ridesharing Market Revenue (Million) Forecast, by Application 2019 & 2032
- Table 45: Global Ridesharing Market Revenue Million Forecast, by Country 2019 & 2032
- Table 46: United Arab Emirates Ridesharing Market Revenue (Million) Forecast, by Application 2019 & 2032
- Table 47: Saudi Arabia Ridesharing Market Revenue (Million) Forecast, by Application 2019 & 2032
- Table 48: South Africa Ridesharing Market Revenue (Million) Forecast, by Application 2019 & 2032
- Table 49: Rest of Middle East and Africa Ridesharing Market Revenue (Million) Forecast, by Application 2019 & 2032
- Table 50: Global Ridesharing Market Revenue Million Forecast, by Membership Type 2019 & 2032
- Table 51: Global Ridesharing Market Revenue Million Forecast, by Service Type 2019 & 2032
- Table 52: Global Ridesharing Market Revenue Million Forecast, by Country 2019 & 2032
- Table 53: Global Ridesharing Market Revenue Million Forecast, by Membership Type 2019 & 2032
- Table 54: Global Ridesharing Market Revenue Million Forecast, by Service Type 2019 & 2032
- Table 55: Global Ridesharing Market Revenue Million Forecast, by Country 2019 & 2032
- Table 56: Global Ridesharing Market Revenue Million Forecast, by Membership Type 2019 & 2032
- Table 57: Global Ridesharing Market Revenue Million Forecast, by Service Type 2019 & 2032
- Table 58: Global Ridesharing Market Revenue Million Forecast, by Country 2019 & 2032
- Table 59: Global Ridesharing Market Revenue Million Forecast, by Membership Type 2019 & 2032
- Table 60: Global Ridesharing Market Revenue Million Forecast, by Service Type 2019 & 2032
- Table 61: Global Ridesharing Market Revenue Million Forecast, by Country 2019 & 2032
- Table 62: Global Ridesharing Market Revenue Million Forecast, by Membership Type 2019 & 2032
- Table 63: Global Ridesharing Market Revenue Million Forecast, by Service Type 2019 & 2032
- Table 64: Global Ridesharing Market Revenue Million Forecast, by Country 2019 & 2032
- Table 65: Global Ridesharing Market Revenue Million Forecast, by Membership Type 2019 & 2032
- Table 66: Global Ridesharing Market Revenue Million Forecast, by Service Type 2019 & 2032
- Table 67: Global Ridesharing Market Revenue Million Forecast, by Country 2019 & 2032
Frequently Asked Questions
1. What is the projected Compound Annual Growth Rate (CAGR) of the Ridesharing Market?
The projected CAGR is approximately 12.81%.
2. Which companies are prominent players in the Ridesharing Market?
Key companies in the market include Flinc GmbH (Daimler Mobility Services), BlaBlaCar (Comuto SA), SPLT (Bosch), Didi Chuxing Technology Co, HyreCar Inc, KINTO Join Limited, Wunder Mobility Solutions GmbH, Kangaride Canada Co, GoMore, Klaxit SAS (formerly Wayzup), Scoop Technologies Inc, Vride Inc (Acquired by Enterprise Holdings Inc, CarpoolWorld (Datasphere Corporation), Via Transportation Inc, Zimride Inc.
3. What are the main segments of the Ridesharing Market?
The market segments include Membership Type, Service Type.
4. Can you provide details about the market size?
The market size is estimated to be USD 47.62 Million as of 2022.
5. What are some drivers contributing to market growth?
Cost Advantage and Increasing Availability of Carpooling/Corporate Pooling Services; Incentives and Rebates Provided by Governments in Major Markets. such as France; Increasing Cost of Vehicle Ownership and Environmental Benefits.
6. What are the notable trends driving market growth?
COVID-19 Has Posed Significant Threat to the Market.
7. Are there any restraints impacting market growth?
Technical Challenges Pertaining to CMP Technique.
8. Can you provide examples of recent developments in the market?
June 2022 - Uber has launched a new UberX Share service to share rides, which is remarkably similar to Uber's pre-pandemic carpooling feature, but with a monetary incentive. Riders who choose UberX Share will be paired with another co-rider traveling in the same direction. Uber will give riders a 20% reduction on the overall fee in exchange for the inconvenience and extra time spent on the road. Even if riders are not matched with a co-rider, they will receive an up-front discount on their ride.
9. What pricing options are available for accessing the report?
Pricing options include single-user, multi-user, and enterprise licenses priced at USD 4750, USD 5250, and USD 8750 respectively.
10. Is the market size provided in terms of value or volume?
The market size is provided in terms of value, measured in Million.
11. Are there any specific market keywords associated with the report?
Yes, the market keyword associated with the report is "Ridesharing Market," which aids in identifying and referencing the specific market segment covered.
12. How do I determine which pricing option suits my needs best?
The pricing options vary based on user requirements and access needs. Individual users may opt for single-user licenses, while businesses requiring broader access may choose multi-user or enterprise licenses for cost-effective access to the report.
13. Are there any additional resources or data provided in the Ridesharing Market report?
While the report offers comprehensive insights, it's advisable to review the specific contents or supplementary materials provided to ascertain if additional resources or data are available.
14. How can I stay updated on further developments or reports in the Ridesharing Market?
To stay informed about further developments, trends, and reports in the Ridesharing Market, consider subscribing to industry newsletters, following relevant companies and organizations, or regularly checking reputable industry news sources and publications.
Methodology
Step 1 - Identification of Relevant Samples Size from Population Database


Step 2 - Approaches for Defining Global Market Size (Value, Volume* & Price*)

Note*: In applicable scenarios
Step 3 - Data Sources
Primary Research
- Web Analytics
- Survey Reports
- Research Institute
- Latest Research Reports
- Opinion Leaders
Secondary Research
- Annual Reports
- White Paper
- Latest Press Release
- Industry Association
- Paid Database
- Investor Presentations

Step 4 - Data Triangulation
Involves using different sources of information in order to increase the validity of a study
These sources are likely to be stakeholders in a program - participants, other researchers, program staff, other community members, and so on.
Then we put all data in single framework & apply various statistical tools to find out the dynamic on the market.
During the analysis stage, feedback from the stakeholder groups would be compared to determine areas of agreement as well as areas of divergence


