
Key Insights
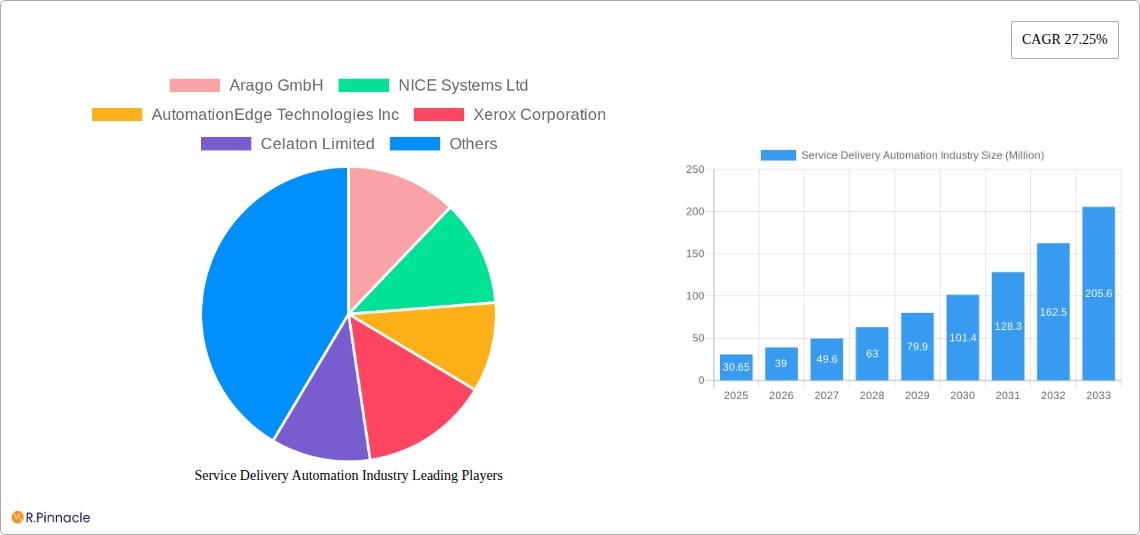
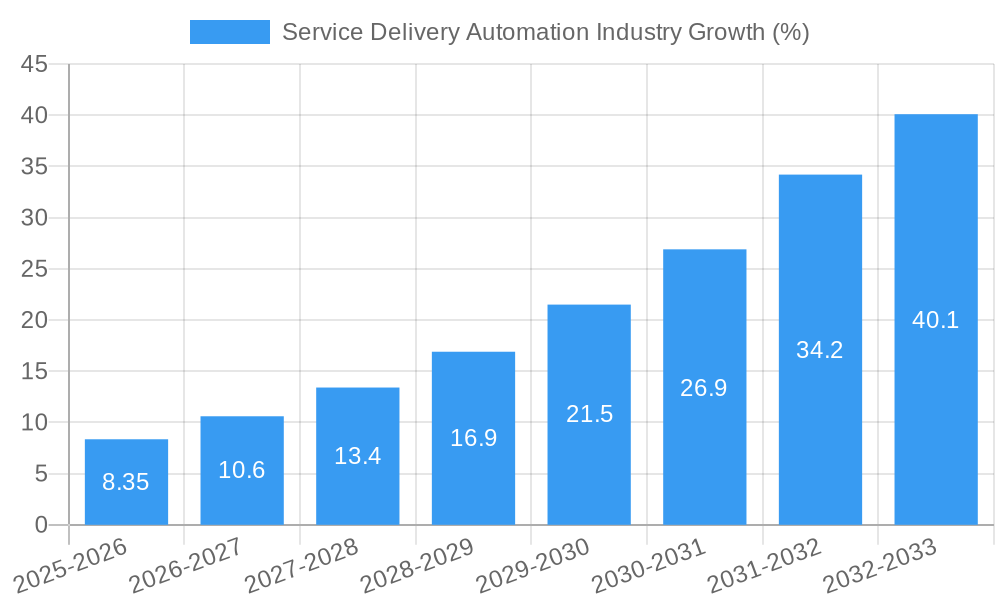
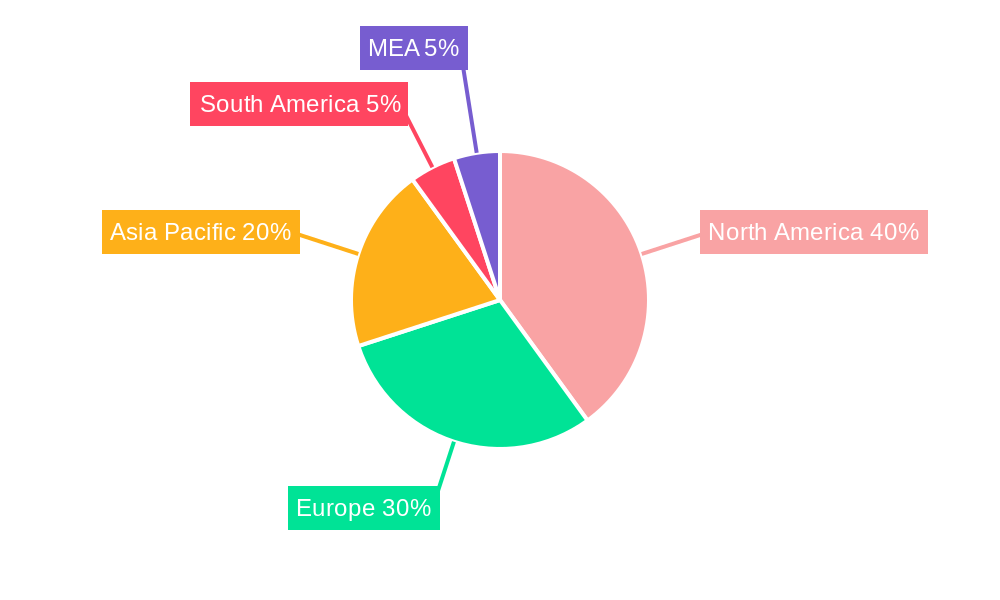
The Service Delivery Automation (SDA) market is experiencing robust growth, projected to reach \$30.65 million in 2025 and maintain a Compound Annual Growth Rate (CAGR) of 27.25% from 2025 to 2033. This expansion is driven by several key factors. Increasing operational efficiency and cost reduction are primary motivators for businesses across diverse sectors, including BFSI (Banking, Financial Services, and Insurance), IT, telecommunications, and healthcare. The rising adoption of cloud-based solutions and the increasing prevalence of big data analytics further fuel market growth by enabling more sophisticated automation strategies and better informed decision-making. Furthermore, the growing demand for improved customer experience pushes organizations towards automating service delivery processes to enhance responsiveness and satisfaction. The market segmentation reveals a significant contribution from large enterprises, but SMEs are increasingly adopting SDA solutions to bridge the efficiency gap and compete effectively. Specific automation types like IT Process Automation and Business Process Automation are both showing strong growth, reflecting a broad need for optimization across IT infrastructure and core business operations. Geographic growth is distributed, with North America and Europe currently holding significant market share, but the Asia-Pacific region demonstrates substantial potential for future expansion given the rapid technological advancements and digital transformation initiatives underway.
The competitive landscape is dynamic, featuring both established players like Xerox and Accenture alongside innovative startups. This competitive pressure fosters innovation, driving down costs and increasing the accessibility of SDA solutions for a wider range of businesses. While challenges such as high initial investment costs and the need for skilled professionals to implement and maintain these systems exist, the long-term benefits of improved efficiency, reduced operational costs, and enhanced customer experience are overcoming these hurdles. Future growth will likely be shaped by advancements in artificial intelligence (AI) and machine learning (ML), enabling even more sophisticated and intelligent automation capabilities. The integration of SDA with other emerging technologies will further expand its applications and enhance its value proposition across a broader spectrum of industries. The continuous evolution of business processes and technological advancements will necessitate ongoing adaptation and innovation within the SDA market to maintain its trajectory of growth and relevance.
Service Delivery Automation Industry Report: 2019-2033
This comprehensive report provides an in-depth analysis of the Service Delivery Automation industry, projecting a market value exceeding $XX Million by 2033. Targeting industry professionals, investors, and strategic planners, this report offers actionable insights into market trends, competitive landscapes, and future growth potential. The study period covers 2019-2033, with 2025 as the base and estimated year. The forecast period spans 2025-2033, and the historical period covers 2019-2024. Key players analyzed include Arago GmbH, NICE Systems Ltd, AutomationEdge Technologies Inc, Xerox Corporation, Celaton Limited, Automation Anywhere Inc, UiPath SRL, IPSoft Inc, Blue Prism, and Accenture Inc.
Service Delivery Automation Industry Market Structure & Innovation Trends
The Service Delivery Automation market is moderately concentrated, with several major players commanding significant market share. The top 10 companies collectively hold an estimated xx% of the market in 2025. Innovation is driven by advancements in AI, machine learning, and cloud computing, leading to increased automation capabilities and improved efficiency. Regulatory frameworks, particularly concerning data privacy and security, significantly influence industry practices. Product substitutes, such as traditional manual processes, face increasing pressure due to the cost-effectiveness and efficiency gains offered by automation. End-user demographics show a strong preference for automation solutions across various industries. M&A activities have been robust, with several significant deals exceeding $XX Million in value over the past five years, indicating a trend towards consolidation and expansion.
- Market Share (2025 Estimate): Top 10 companies hold xx%
- M&A Deal Value (2019-2024): Total value exceeding $XX Million.
Service Delivery Automation Industry Market Dynamics & Trends
The Service Delivery Automation market exhibits a strong growth trajectory, with a projected CAGR of xx% during the forecast period (2025-2033). Key growth drivers include the rising adoption of cloud-based solutions, increasing demand for improved operational efficiency, and the growing need to reduce operational costs across various industries. Technological disruptions, such as the proliferation of AI and RPA (Robotic Process Automation) technologies, are reshaping the industry landscape. Consumer preferences are increasingly focused on faster, more accurate, and cost-effective service delivery, bolstering the demand for automation solutions. Competitive dynamics are characterized by intense innovation and strategic partnerships, with companies striving to differentiate their offerings through enhanced functionalities and superior customer support. Market penetration is expected to reach xx% by 2033.
Dominant Regions & Segments in Service Delivery Automation Industry
The BFSI (Banking, Financial Services, and Insurance) sector currently represents the largest segment in the Service Delivery Automation market, driven by stringent regulatory compliance needs and the substantial volume of transactions handled. North America currently holds the largest regional market share due to high technological adoption rates and the presence of key industry players.
Key Drivers by Segment:
- BFSI: Stringent regulatory compliance, high transaction volumes.
- IT: Need for optimized IT operations and reduced infrastructure costs.
- Telecommunication & Media: Growing customer base and need for personalized services.
- Large Enterprises: Higher budgets and complex processes requiring automation.
Regional Dominance Analysis:
North America's dominance is attributed to early adoption of automation technologies, robust digital infrastructure, and the presence of several large-scale technology companies. However, the Asia-Pacific region is expected to exhibit the highest growth rate during the forecast period, fueled by increasing digitalization initiatives and a growing demand for enhanced operational efficiency.
Service Delivery Automation Industry Product Innovations
Recent product innovations focus on integrating AI, machine learning, and cloud technologies to create more sophisticated and adaptable automation solutions. This includes intelligent automation platforms capable of handling complex, unstructured data and self-learning capabilities that improve accuracy and efficiency over time. These innovations enhance user experience and reduce implementation costs, driving wider adoption across diverse industries. The market is witnessing a shift towards solutions that provide a seamless integration with existing business systems and offer robust security features to address data privacy concerns.
Report Scope & Segmentation Analysis
This report segments the Service Delivery Automation market across three key aspects: end-user industry, automation type, and organization size.
By End-user Industry: BFSI, IT, Telecommunication and Media, Hospitality and Transportation, Retail and Consumer Goods, Healthcare and Pharmaceuticals, Manufacturing and Logistics, Other End-User Industries. Each segment showcases varied growth projections based on industry-specific adoption rates and technological maturity.
By Type: IT Process Automation and Business Process Automation. The market size and growth rate differ significantly between these two types due to the varying complexity and implementation requirements.
By Organization Size: Large Enterprises and Small & Medium Enterprises (SMEs). Large enterprises dominate the market due to their higher investment capacity, but the SME segment is projected to show considerable growth as cloud-based solutions lower the barrier to entry.
Key Drivers of Service Delivery Automation Industry Growth
Technological advancements, particularly in AI, machine learning, and cloud computing, are primary growth drivers. The increasing need for operational efficiency and cost reduction across various industries further fuels market growth. Favorable government regulations and policies promoting digital transformation also contribute. Examples include tax incentives for businesses adopting automation technologies and initiatives to develop a skilled workforce in this field.
Challenges in the Service Delivery Automation Industry Sector
Integration complexities with legacy systems and the high initial investment costs represent major challenges for widespread adoption. Skill shortages in automation-related fields and the need for ongoing maintenance and support also pose hurdles. Data security and privacy concerns remain significant, particularly as more sensitive data is processed through automated systems. These factors can lead to project delays, cost overruns and impede wider market penetration.
Emerging Opportunities in Service Delivery Automation Industry
Hyperautomation, the combination of multiple automation technologies to streamline complex processes, presents a significant opportunity. The growing adoption of cloud-based solutions offers scalability and cost-effectiveness. Industry-specific solutions tailored to unique business needs will attract increasing attention. Finally, the expansion of automation into new industries, especially those with complex and manual processes, will unlock substantial market potential.
Leading Players in the Service Delivery Automation Industry Market
- Arago GmbH
- NICE Systems Ltd
- AutomationEdge Technologies Inc
- Xerox Corporation
- Celaton Limited
- Automation Anywhere Inc
- UiPath SRL
- IPsoft Inc
- Blue Prism
- Accenture Inc
Key Developments in Service Delivery Automation Industry
- March 2023: UiPath's integration with Amazon SageMaker streamlines the deployment of machine learning models into business processes, accelerating innovation and reducing costs.
- January 2023: The NICE and Cognizant partnership expands opportunities in CX, WFM, and digital transformation, offering a unified CCaaS suite to enhance customer and agent experiences.
Future Outlook for Service Delivery Automation Industry Market
The Service Delivery Automation market is poised for substantial growth, driven by continuous technological advancements, increasing demand for efficient operations, and the growing adoption of cloud-based solutions. Strategic partnerships, acquisitions, and investments in research and development will play a pivotal role in shaping the future market landscape. The industry will increasingly focus on providing customized and secure automation solutions tailored to diverse industry requirements, promising a bright future for the market's continued expansion and evolution.
Service Delivery Automation Industry Segmentation
-
1. Type
- 1.1. IT Process Automation
- 1.2. Business Process Automation
-
2. Organization Size
- 2.1. Large Enterprises
- 2.2. Small & Medium Enterprises (SMEs)
-
3. End-user Industry
- 3.1. BFSI
- 3.2. IT
- 3.3. Telecommunication and Media
- 3.4. Hospitality and Transportation
- 3.5. Retail and Consumer Goods
- 3.6. Healthcare and Pharmaceuticals
- 3.7. Manufacturing and Logistics
- 3.8. Other End-User Industries
Service Delivery Automation Industry Segmentation By Geography
- 1. North America
- 2. Europe
- 3. Asia Pacific
- 4. Latin America
- 5. Middle East and Africa
Service Delivery Automation Industry REPORT HIGHLIGHTS
| Aspects | Details |
|---|---|
| Study Period | 2019-2033 |
| Base Year | 2024 |
| Estimated Year | 2025 |
| Forecast Period | 2025-2033 |
| Historical Period | 2019-2024 |
| Growth Rate | CAGR of 27.25% from 2019-2033 |
| Segmentation |
|
Table of Contents
- 1. Introduction
- 1.1. Research Scope
- 1.2. Market Segmentation
- 1.3. Research Methodology
- 1.4. Definitions and Assumptions
- 2. Executive Summary
- 2.1. Introduction
- 3. Market Dynamics
- 3.1. Introduction
- 3.2. Market Drivers
- 3.2.1. Need for Operational Efficiency; Cost-cutting Across Industries
- 3.3. Market Restrains
- 3.3.1. Lack of Skilled Personnel
- 3.4. Market Trends
- 3.4.1. Retail and Consumer Goods to Dominate the Market
- 4. Market Factor Analysis
- 4.1. Porters Five Forces
- 4.2. Supply/Value Chain
- 4.3. PESTEL analysis
- 4.4. Market Entropy
- 4.5. Patent/Trademark Analysis
- 5. Global Service Delivery Automation Industry Analysis, Insights and Forecast, 2019-2031
- 5.1. Market Analysis, Insights and Forecast - by Type
- 5.1.1. IT Process Automation
- 5.1.2. Business Process Automation
- 5.2. Market Analysis, Insights and Forecast - by Organization Size
- 5.2.1. Large Enterprises
- 5.2.2. Small & Medium Enterprises (SMEs)
- 5.3. Market Analysis, Insights and Forecast - by End-user Industry
- 5.3.1. BFSI
- 5.3.2. IT
- 5.3.3. Telecommunication and Media
- 5.3.4. Hospitality and Transportation
- 5.3.5. Retail and Consumer Goods
- 5.3.6. Healthcare and Pharmaceuticals
- 5.3.7. Manufacturing and Logistics
- 5.3.8. Other End-User Industries
- 5.4. Market Analysis, Insights and Forecast - by Region
- 5.4.1. North America
- 5.4.2. Europe
- 5.4.3. Asia Pacific
- 5.4.4. Latin America
- 5.4.5. Middle East and Africa
- 5.1. Market Analysis, Insights and Forecast - by Type
- 6. North America Service Delivery Automation Industry Analysis, Insights and Forecast, 2019-2031
- 6.1. Market Analysis, Insights and Forecast - by Type
- 6.1.1. IT Process Automation
- 6.1.2. Business Process Automation
- 6.2. Market Analysis, Insights and Forecast - by Organization Size
- 6.2.1. Large Enterprises
- 6.2.2. Small & Medium Enterprises (SMEs)
- 6.3. Market Analysis, Insights and Forecast - by End-user Industry
- 6.3.1. BFSI
- 6.3.2. IT
- 6.3.3. Telecommunication and Media
- 6.3.4. Hospitality and Transportation
- 6.3.5. Retail and Consumer Goods
- 6.3.6. Healthcare and Pharmaceuticals
- 6.3.7. Manufacturing and Logistics
- 6.3.8. Other End-User Industries
- 6.1. Market Analysis, Insights and Forecast - by Type
- 7. Europe Service Delivery Automation Industry Analysis, Insights and Forecast, 2019-2031
- 7.1. Market Analysis, Insights and Forecast - by Type
- 7.1.1. IT Process Automation
- 7.1.2. Business Process Automation
- 7.2. Market Analysis, Insights and Forecast - by Organization Size
- 7.2.1. Large Enterprises
- 7.2.2. Small & Medium Enterprises (SMEs)
- 7.3. Market Analysis, Insights and Forecast - by End-user Industry
- 7.3.1. BFSI
- 7.3.2. IT
- 7.3.3. Telecommunication and Media
- 7.3.4. Hospitality and Transportation
- 7.3.5. Retail and Consumer Goods
- 7.3.6. Healthcare and Pharmaceuticals
- 7.3.7. Manufacturing and Logistics
- 7.3.8. Other End-User Industries
- 7.1. Market Analysis, Insights and Forecast - by Type
- 8. Asia Pacific Service Delivery Automation Industry Analysis, Insights and Forecast, 2019-2031
- 8.1. Market Analysis, Insights and Forecast - by Type
- 8.1.1. IT Process Automation
- 8.1.2. Business Process Automation
- 8.2. Market Analysis, Insights and Forecast - by Organization Size
- 8.2.1. Large Enterprises
- 8.2.2. Small & Medium Enterprises (SMEs)
- 8.3. Market Analysis, Insights and Forecast - by End-user Industry
- 8.3.1. BFSI
- 8.3.2. IT
- 8.3.3. Telecommunication and Media
- 8.3.4. Hospitality and Transportation
- 8.3.5. Retail and Consumer Goods
- 8.3.6. Healthcare and Pharmaceuticals
- 8.3.7. Manufacturing and Logistics
- 8.3.8. Other End-User Industries
- 8.1. Market Analysis, Insights and Forecast - by Type
- 9. Latin America Service Delivery Automation Industry Analysis, Insights and Forecast, 2019-2031
- 9.1. Market Analysis, Insights and Forecast - by Type
- 9.1.1. IT Process Automation
- 9.1.2. Business Process Automation
- 9.2. Market Analysis, Insights and Forecast - by Organization Size
- 9.2.1. Large Enterprises
- 9.2.2. Small & Medium Enterprises (SMEs)
- 9.3. Market Analysis, Insights and Forecast - by End-user Industry
- 9.3.1. BFSI
- 9.3.2. IT
- 9.3.3. Telecommunication and Media
- 9.3.4. Hospitality and Transportation
- 9.3.5. Retail and Consumer Goods
- 9.3.6. Healthcare and Pharmaceuticals
- 9.3.7. Manufacturing and Logistics
- 9.3.8. Other End-User Industries
- 9.1. Market Analysis, Insights and Forecast - by Type
- 10. Middle East and Africa Service Delivery Automation Industry Analysis, Insights and Forecast, 2019-2031
- 10.1. Market Analysis, Insights and Forecast - by Type
- 10.1.1. IT Process Automation
- 10.1.2. Business Process Automation
- 10.2. Market Analysis, Insights and Forecast - by Organization Size
- 10.2.1. Large Enterprises
- 10.2.2. Small & Medium Enterprises (SMEs)
- 10.3. Market Analysis, Insights and Forecast - by End-user Industry
- 10.3.1. BFSI
- 10.3.2. IT
- 10.3.3. Telecommunication and Media
- 10.3.4. Hospitality and Transportation
- 10.3.5. Retail and Consumer Goods
- 10.3.6. Healthcare and Pharmaceuticals
- 10.3.7. Manufacturing and Logistics
- 10.3.8. Other End-User Industries
- 10.1. Market Analysis, Insights and Forecast - by Type
- 11. North America Service Delivery Automation Industry Analysis, Insights and Forecast, 2019-2031
- 11.1. Market Analysis, Insights and Forecast - By Country/Sub-region
- 11.1.1 United States
- 11.1.2 Canada
- 11.1.3 Mexico
- 12. Europe Service Delivery Automation Industry Analysis, Insights and Forecast, 2019-2031
- 12.1. Market Analysis, Insights and Forecast - By Country/Sub-region
- 12.1.1 Germany
- 12.1.2 United Kingdom
- 12.1.3 France
- 12.1.4 Spain
- 12.1.5 Italy
- 12.1.6 Spain
- 12.1.7 Belgium
- 12.1.8 Netherland
- 12.1.9 Nordics
- 12.1.10 Rest of Europe
- 13. Asia Pacific Service Delivery Automation Industry Analysis, Insights and Forecast, 2019-2031
- 13.1. Market Analysis, Insights and Forecast - By Country/Sub-region
- 13.1.1 China
- 13.1.2 Japan
- 13.1.3 India
- 13.1.4 South Korea
- 13.1.5 Southeast Asia
- 13.1.6 Australia
- 13.1.7 Indonesia
- 13.1.8 Phillipes
- 13.1.9 Singapore
- 13.1.10 Thailandc
- 13.1.11 Rest of Asia Pacific
- 14. South America Service Delivery Automation Industry Analysis, Insights and Forecast, 2019-2031
- 14.1. Market Analysis, Insights and Forecast - By Country/Sub-region
- 14.1.1 Brazil
- 14.1.2 Argentina
- 14.1.3 Peru
- 14.1.4 Chile
- 14.1.5 Colombia
- 14.1.6 Ecuador
- 14.1.7 Venezuela
- 14.1.8 Rest of South America
- 15. North America Service Delivery Automation Industry Analysis, Insights and Forecast, 2019-2031
- 15.1. Market Analysis, Insights and Forecast - By Country/Sub-region
- 15.1.1 United States
- 15.1.2 Canada
- 15.1.3 Mexico
- 16. MEA Service Delivery Automation Industry Analysis, Insights and Forecast, 2019-2031
- 16.1. Market Analysis, Insights and Forecast - By Country/Sub-region
- 16.1.1 United Arab Emirates
- 16.1.2 Saudi Arabia
- 16.1.3 South Africa
- 16.1.4 Rest of Middle East and Africa
- 17. Competitive Analysis
- 17.1. Global Market Share Analysis 2024
- 17.2. Company Profiles
- 17.2.1 Arago GmbH
- 17.2.1.1. Overview
- 17.2.1.2. Products
- 17.2.1.3. SWOT Analysis
- 17.2.1.4. Recent Developments
- 17.2.1.5. Financials (Based on Availability)
- 17.2.2 NICE Systems Ltd
- 17.2.2.1. Overview
- 17.2.2.2. Products
- 17.2.2.3. SWOT Analysis
- 17.2.2.4. Recent Developments
- 17.2.2.5. Financials (Based on Availability)
- 17.2.3 AutomationEdge Technologies Inc
- 17.2.3.1. Overview
- 17.2.3.2. Products
- 17.2.3.3. SWOT Analysis
- 17.2.3.4. Recent Developments
- 17.2.3.5. Financials (Based on Availability)
- 17.2.4 Xerox Corporation
- 17.2.4.1. Overview
- 17.2.4.2. Products
- 17.2.4.3. SWOT Analysis
- 17.2.4.4. Recent Developments
- 17.2.4.5. Financials (Based on Availability)
- 17.2.5 Celaton Limited
- 17.2.5.1. Overview
- 17.2.5.2. Products
- 17.2.5.3. SWOT Analysis
- 17.2.5.4. Recent Developments
- 17.2.5.5. Financials (Based on Availability)
- 17.2.6 Automation Anywhere Inc
- 17.2.6.1. Overview
- 17.2.6.2. Products
- 17.2.6.3. SWOT Analysis
- 17.2.6.4. Recent Developments
- 17.2.6.5. Financials (Based on Availability)
- 17.2.7 Uipath SRL
- 17.2.7.1. Overview
- 17.2.7.2. Products
- 17.2.7.3. SWOT Analysis
- 17.2.7.4. Recent Developments
- 17.2.7.5. Financials (Based on Availability)
- 17.2.8 IPsoft Inc
- 17.2.8.1. Overview
- 17.2.8.2. Products
- 17.2.8.3. SWOT Analysis
- 17.2.8.4. Recent Developments
- 17.2.8.5. Financials (Based on Availability)
- 17.2.9 Blue Prism
- 17.2.9.1. Overview
- 17.2.9.2. Products
- 17.2.9.3. SWOT Analysis
- 17.2.9.4. Recent Developments
- 17.2.9.5. Financials (Based on Availability)
- 17.2.10 Accenture Inc
- 17.2.10.1. Overview
- 17.2.10.2. Products
- 17.2.10.3. SWOT Analysis
- 17.2.10.4. Recent Developments
- 17.2.10.5. Financials (Based on Availability)
- 17.2.1 Arago GmbH
List of Figures
- Figure 1: Global Service Delivery Automation Industry Revenue Breakdown (Million, %) by Region 2024 & 2032
- Figure 2: Global Service Delivery Automation Industry Volume Breakdown (K Unit, %) by Region 2024 & 2032
- Figure 3: North America Service Delivery Automation Industry Revenue (Million), by Country 2024 & 2032
- Figure 4: North America Service Delivery Automation Industry Volume (K Unit), by Country 2024 & 2032
- Figure 5: North America Service Delivery Automation Industry Revenue Share (%), by Country 2024 & 2032
- Figure 6: North America Service Delivery Automation Industry Volume Share (%), by Country 2024 & 2032
- Figure 7: Europe Service Delivery Automation Industry Revenue (Million), by Country 2024 & 2032
- Figure 8: Europe Service Delivery Automation Industry Volume (K Unit), by Country 2024 & 2032
- Figure 9: Europe Service Delivery Automation Industry Revenue Share (%), by Country 2024 & 2032
- Figure 10: Europe Service Delivery Automation Industry Volume Share (%), by Country 2024 & 2032
- Figure 11: Asia Pacific Service Delivery Automation Industry Revenue (Million), by Country 2024 & 2032
- Figure 12: Asia Pacific Service Delivery Automation Industry Volume (K Unit), by Country 2024 & 2032
- Figure 13: Asia Pacific Service Delivery Automation Industry Revenue Share (%), by Country 2024 & 2032
- Figure 14: Asia Pacific Service Delivery Automation Industry Volume Share (%), by Country 2024 & 2032
- Figure 15: South America Service Delivery Automation Industry Revenue (Million), by Country 2024 & 2032
- Figure 16: South America Service Delivery Automation Industry Volume (K Unit), by Country 2024 & 2032
- Figure 17: South America Service Delivery Automation Industry Revenue Share (%), by Country 2024 & 2032
- Figure 18: South America Service Delivery Automation Industry Volume Share (%), by Country 2024 & 2032
- Figure 19: North America Service Delivery Automation Industry Revenue (Million), by Country 2024 & 2032
- Figure 20: North America Service Delivery Automation Industry Volume (K Unit), by Country 2024 & 2032
- Figure 21: North America Service Delivery Automation Industry Revenue Share (%), by Country 2024 & 2032
- Figure 22: North America Service Delivery Automation Industry Volume Share (%), by Country 2024 & 2032
- Figure 23: MEA Service Delivery Automation Industry Revenue (Million), by Country 2024 & 2032
- Figure 24: MEA Service Delivery Automation Industry Volume (K Unit), by Country 2024 & 2032
- Figure 25: MEA Service Delivery Automation Industry Revenue Share (%), by Country 2024 & 2032
- Figure 26: MEA Service Delivery Automation Industry Volume Share (%), by Country 2024 & 2032
- Figure 27: North America Service Delivery Automation Industry Revenue (Million), by Type 2024 & 2032
- Figure 28: North America Service Delivery Automation Industry Volume (K Unit), by Type 2024 & 2032
- Figure 29: North America Service Delivery Automation Industry Revenue Share (%), by Type 2024 & 2032
- Figure 30: North America Service Delivery Automation Industry Volume Share (%), by Type 2024 & 2032
- Figure 31: North America Service Delivery Automation Industry Revenue (Million), by Organization Size 2024 & 2032
- Figure 32: North America Service Delivery Automation Industry Volume (K Unit), by Organization Size 2024 & 2032
- Figure 33: North America Service Delivery Automation Industry Revenue Share (%), by Organization Size 2024 & 2032
- Figure 34: North America Service Delivery Automation Industry Volume Share (%), by Organization Size 2024 & 2032
- Figure 35: North America Service Delivery Automation Industry Revenue (Million), by End-user Industry 2024 & 2032
- Figure 36: North America Service Delivery Automation Industry Volume (K Unit), by End-user Industry 2024 & 2032
- Figure 37: North America Service Delivery Automation Industry Revenue Share (%), by End-user Industry 2024 & 2032
- Figure 38: North America Service Delivery Automation Industry Volume Share (%), by End-user Industry 2024 & 2032
- Figure 39: North America Service Delivery Automation Industry Revenue (Million), by Country 2024 & 2032
- Figure 40: North America Service Delivery Automation Industry Volume (K Unit), by Country 2024 & 2032
- Figure 41: North America Service Delivery Automation Industry Revenue Share (%), by Country 2024 & 2032
- Figure 42: North America Service Delivery Automation Industry Volume Share (%), by Country 2024 & 2032
- Figure 43: Europe Service Delivery Automation Industry Revenue (Million), by Type 2024 & 2032
- Figure 44: Europe Service Delivery Automation Industry Volume (K Unit), by Type 2024 & 2032
- Figure 45: Europe Service Delivery Automation Industry Revenue Share (%), by Type 2024 & 2032
- Figure 46: Europe Service Delivery Automation Industry Volume Share (%), by Type 2024 & 2032
- Figure 47: Europe Service Delivery Automation Industry Revenue (Million), by Organization Size 2024 & 2032
- Figure 48: Europe Service Delivery Automation Industry Volume (K Unit), by Organization Size 2024 & 2032
- Figure 49: Europe Service Delivery Automation Industry Revenue Share (%), by Organization Size 2024 & 2032
- Figure 50: Europe Service Delivery Automation Industry Volume Share (%), by Organization Size 2024 & 2032
- Figure 51: Europe Service Delivery Automation Industry Revenue (Million), by End-user Industry 2024 & 2032
- Figure 52: Europe Service Delivery Automation Industry Volume (K Unit), by End-user Industry 2024 & 2032
- Figure 53: Europe Service Delivery Automation Industry Revenue Share (%), by End-user Industry 2024 & 2032
- Figure 54: Europe Service Delivery Automation Industry Volume Share (%), by End-user Industry 2024 & 2032
- Figure 55: Europe Service Delivery Automation Industry Revenue (Million), by Country 2024 & 2032
- Figure 56: Europe Service Delivery Automation Industry Volume (K Unit), by Country 2024 & 2032
- Figure 57: Europe Service Delivery Automation Industry Revenue Share (%), by Country 2024 & 2032
- Figure 58: Europe Service Delivery Automation Industry Volume Share (%), by Country 2024 & 2032
- Figure 59: Asia Pacific Service Delivery Automation Industry Revenue (Million), by Type 2024 & 2032
- Figure 60: Asia Pacific Service Delivery Automation Industry Volume (K Unit), by Type 2024 & 2032
- Figure 61: Asia Pacific Service Delivery Automation Industry Revenue Share (%), by Type 2024 & 2032
- Figure 62: Asia Pacific Service Delivery Automation Industry Volume Share (%), by Type 2024 & 2032
- Figure 63: Asia Pacific Service Delivery Automation Industry Revenue (Million), by Organization Size 2024 & 2032
- Figure 64: Asia Pacific Service Delivery Automation Industry Volume (K Unit), by Organization Size 2024 & 2032
- Figure 65: Asia Pacific Service Delivery Automation Industry Revenue Share (%), by Organization Size 2024 & 2032
- Figure 66: Asia Pacific Service Delivery Automation Industry Volume Share (%), by Organization Size 2024 & 2032
- Figure 67: Asia Pacific Service Delivery Automation Industry Revenue (Million), by End-user Industry 2024 & 2032
- Figure 68: Asia Pacific Service Delivery Automation Industry Volume (K Unit), by End-user Industry 2024 & 2032
- Figure 69: Asia Pacific Service Delivery Automation Industry Revenue Share (%), by End-user Industry 2024 & 2032
- Figure 70: Asia Pacific Service Delivery Automation Industry Volume Share (%), by End-user Industry 2024 & 2032
- Figure 71: Asia Pacific Service Delivery Automation Industry Revenue (Million), by Country 2024 & 2032
- Figure 72: Asia Pacific Service Delivery Automation Industry Volume (K Unit), by Country 2024 & 2032
- Figure 73: Asia Pacific Service Delivery Automation Industry Revenue Share (%), by Country 2024 & 2032
- Figure 74: Asia Pacific Service Delivery Automation Industry Volume Share (%), by Country 2024 & 2032
- Figure 75: Latin America Service Delivery Automation Industry Revenue (Million), by Type 2024 & 2032
- Figure 76: Latin America Service Delivery Automation Industry Volume (K Unit), by Type 2024 & 2032
- Figure 77: Latin America Service Delivery Automation Industry Revenue Share (%), by Type 2024 & 2032
- Figure 78: Latin America Service Delivery Automation Industry Volume Share (%), by Type 2024 & 2032
- Figure 79: Latin America Service Delivery Automation Industry Revenue (Million), by Organization Size 2024 & 2032
- Figure 80: Latin America Service Delivery Automation Industry Volume (K Unit), by Organization Size 2024 & 2032
- Figure 81: Latin America Service Delivery Automation Industry Revenue Share (%), by Organization Size 2024 & 2032
- Figure 82: Latin America Service Delivery Automation Industry Volume Share (%), by Organization Size 2024 & 2032
- Figure 83: Latin America Service Delivery Automation Industry Revenue (Million), by End-user Industry 2024 & 2032
- Figure 84: Latin America Service Delivery Automation Industry Volume (K Unit), by End-user Industry 2024 & 2032
- Figure 85: Latin America Service Delivery Automation Industry Revenue Share (%), by End-user Industry 2024 & 2032
- Figure 86: Latin America Service Delivery Automation Industry Volume Share (%), by End-user Industry 2024 & 2032
- Figure 87: Latin America Service Delivery Automation Industry Revenue (Million), by Country 2024 & 2032
- Figure 88: Latin America Service Delivery Automation Industry Volume (K Unit), by Country 2024 & 2032
- Figure 89: Latin America Service Delivery Automation Industry Revenue Share (%), by Country 2024 & 2032
- Figure 90: Latin America Service Delivery Automation Industry Volume Share (%), by Country 2024 & 2032
- Figure 91: Middle East and Africa Service Delivery Automation Industry Revenue (Million), by Type 2024 & 2032
- Figure 92: Middle East and Africa Service Delivery Automation Industry Volume (K Unit), by Type 2024 & 2032
- Figure 93: Middle East and Africa Service Delivery Automation Industry Revenue Share (%), by Type 2024 & 2032
- Figure 94: Middle East and Africa Service Delivery Automation Industry Volume Share (%), by Type 2024 & 2032
- Figure 95: Middle East and Africa Service Delivery Automation Industry Revenue (Million), by Organization Size 2024 & 2032
- Figure 96: Middle East and Africa Service Delivery Automation Industry Volume (K Unit), by Organization Size 2024 & 2032
- Figure 97: Middle East and Africa Service Delivery Automation Industry Revenue Share (%), by Organization Size 2024 & 2032
- Figure 98: Middle East and Africa Service Delivery Automation Industry Volume Share (%), by Organization Size 2024 & 2032
- Figure 99: Middle East and Africa Service Delivery Automation Industry Revenue (Million), by End-user Industry 2024 & 2032
- Figure 100: Middle East and Africa Service Delivery Automation Industry Volume (K Unit), by End-user Industry 2024 & 2032
- Figure 101: Middle East and Africa Service Delivery Automation Industry Revenue Share (%), by End-user Industry 2024 & 2032
- Figure 102: Middle East and Africa Service Delivery Automation Industry Volume Share (%), by End-user Industry 2024 & 2032
- Figure 103: Middle East and Africa Service Delivery Automation Industry Revenue (Million), by Country 2024 & 2032
- Figure 104: Middle East and Africa Service Delivery Automation Industry Volume (K Unit), by Country 2024 & 2032
- Figure 105: Middle East and Africa Service Delivery Automation Industry Revenue Share (%), by Country 2024 & 2032
- Figure 106: Middle East and Africa Service Delivery Automation Industry Volume Share (%), by Country 2024 & 2032
List of Tables
- Table 1: Global Service Delivery Automation Industry Revenue Million Forecast, by Region 2019 & 2032
- Table 2: Global Service Delivery Automation Industry Volume K Unit Forecast, by Region 2019 & 2032
- Table 3: Global Service Delivery Automation Industry Revenue Million Forecast, by Type 2019 & 2032
- Table 4: Global Service Delivery Automation Industry Volume K Unit Forecast, by Type 2019 & 2032
- Table 5: Global Service Delivery Automation Industry Revenue Million Forecast, by Organization Size 2019 & 2032
- Table 6: Global Service Delivery Automation Industry Volume K Unit Forecast, by Organization Size 2019 & 2032
- Table 7: Global Service Delivery Automation Industry Revenue Million Forecast, by End-user Industry 2019 & 2032
- Table 8: Global Service Delivery Automation Industry Volume K Unit Forecast, by End-user Industry 2019 & 2032
- Table 9: Global Service Delivery Automation Industry Revenue Million Forecast, by Region 2019 & 2032
- Table 10: Global Service Delivery Automation Industry Volume K Unit Forecast, by Region 2019 & 2032
- Table 11: Global Service Delivery Automation Industry Revenue Million Forecast, by Country 2019 & 2032
- Table 12: Global Service Delivery Automation Industry Volume K Unit Forecast, by Country 2019 & 2032
- Table 13: United States Service Delivery Automation Industry Revenue (Million) Forecast, by Application 2019 & 2032
- Table 14: United States Service Delivery Automation Industry Volume (K Unit) Forecast, by Application 2019 & 2032
- Table 15: Canada Service Delivery Automation Industry Revenue (Million) Forecast, by Application 2019 & 2032
- Table 16: Canada Service Delivery Automation Industry Volume (K Unit) Forecast, by Application 2019 & 2032
- Table 17: Mexico Service Delivery Automation Industry Revenue (Million) Forecast, by Application 2019 & 2032
- Table 18: Mexico Service Delivery Automation Industry Volume (K Unit) Forecast, by Application 2019 & 2032
- Table 19: Global Service Delivery Automation Industry Revenue Million Forecast, by Country 2019 & 2032
- Table 20: Global Service Delivery Automation Industry Volume K Unit Forecast, by Country 2019 & 2032
- Table 21: Germany Service Delivery Automation Industry Revenue (Million) Forecast, by Application 2019 & 2032
- Table 22: Germany Service Delivery Automation Industry Volume (K Unit) Forecast, by Application 2019 & 2032
- Table 23: United Kingdom Service Delivery Automation Industry Revenue (Million) Forecast, by Application 2019 & 2032
- Table 24: United Kingdom Service Delivery Automation Industry Volume (K Unit) Forecast, by Application 2019 & 2032
- Table 25: France Service Delivery Automation Industry Revenue (Million) Forecast, by Application 2019 & 2032
- Table 26: France Service Delivery Automation Industry Volume (K Unit) Forecast, by Application 2019 & 2032
- Table 27: Spain Service Delivery Automation Industry Revenue (Million) Forecast, by Application 2019 & 2032
- Table 28: Spain Service Delivery Automation Industry Volume (K Unit) Forecast, by Application 2019 & 2032
- Table 29: Italy Service Delivery Automation Industry Revenue (Million) Forecast, by Application 2019 & 2032
- Table 30: Italy Service Delivery Automation Industry Volume (K Unit) Forecast, by Application 2019 & 2032
- Table 31: Spain Service Delivery Automation Industry Revenue (Million) Forecast, by Application 2019 & 2032
- Table 32: Spain Service Delivery Automation Industry Volume (K Unit) Forecast, by Application 2019 & 2032
- Table 33: Belgium Service Delivery Automation Industry Revenue (Million) Forecast, by Application 2019 & 2032
- Table 34: Belgium Service Delivery Automation Industry Volume (K Unit) Forecast, by Application 2019 & 2032
- Table 35: Netherland Service Delivery Automation Industry Revenue (Million) Forecast, by Application 2019 & 2032
- Table 36: Netherland Service Delivery Automation Industry Volume (K Unit) Forecast, by Application 2019 & 2032
- Table 37: Nordics Service Delivery Automation Industry Revenue (Million) Forecast, by Application 2019 & 2032
- Table 38: Nordics Service Delivery Automation Industry Volume (K Unit) Forecast, by Application 2019 & 2032
- Table 39: Rest of Europe Service Delivery Automation Industry Revenue (Million) Forecast, by Application 2019 & 2032
- Table 40: Rest of Europe Service Delivery Automation Industry Volume (K Unit) Forecast, by Application 2019 & 2032
- Table 41: Global Service Delivery Automation Industry Revenue Million Forecast, by Country 2019 & 2032
- Table 42: Global Service Delivery Automation Industry Volume K Unit Forecast, by Country 2019 & 2032
- Table 43: China Service Delivery Automation Industry Revenue (Million) Forecast, by Application 2019 & 2032
- Table 44: China Service Delivery Automation Industry Volume (K Unit) Forecast, by Application 2019 & 2032
- Table 45: Japan Service Delivery Automation Industry Revenue (Million) Forecast, by Application 2019 & 2032
- Table 46: Japan Service Delivery Automation Industry Volume (K Unit) Forecast, by Application 2019 & 2032
- Table 47: India Service Delivery Automation Industry Revenue (Million) Forecast, by Application 2019 & 2032
- Table 48: India Service Delivery Automation Industry Volume (K Unit) Forecast, by Application 2019 & 2032
- Table 49: South Korea Service Delivery Automation Industry Revenue (Million) Forecast, by Application 2019 & 2032
- Table 50: South Korea Service Delivery Automation Industry Volume (K Unit) Forecast, by Application 2019 & 2032
- Table 51: Southeast Asia Service Delivery Automation Industry Revenue (Million) Forecast, by Application 2019 & 2032
- Table 52: Southeast Asia Service Delivery Automation Industry Volume (K Unit) Forecast, by Application 2019 & 2032
- Table 53: Australia Service Delivery Automation Industry Revenue (Million) Forecast, by Application 2019 & 2032
- Table 54: Australia Service Delivery Automation Industry Volume (K Unit) Forecast, by Application 2019 & 2032
- Table 55: Indonesia Service Delivery Automation Industry Revenue (Million) Forecast, by Application 2019 & 2032
- Table 56: Indonesia Service Delivery Automation Industry Volume (K Unit) Forecast, by Application 2019 & 2032
- Table 57: Phillipes Service Delivery Automation Industry Revenue (Million) Forecast, by Application 2019 & 2032
- Table 58: Phillipes Service Delivery Automation Industry Volume (K Unit) Forecast, by Application 2019 & 2032
- Table 59: Singapore Service Delivery Automation Industry Revenue (Million) Forecast, by Application 2019 & 2032
- Table 60: Singapore Service Delivery Automation Industry Volume (K Unit) Forecast, by Application 2019 & 2032
- Table 61: Thailandc Service Delivery Automation Industry Revenue (Million) Forecast, by Application 2019 & 2032
- Table 62: Thailandc Service Delivery Automation Industry Volume (K Unit) Forecast, by Application 2019 & 2032
- Table 63: Rest of Asia Pacific Service Delivery Automation Industry Revenue (Million) Forecast, by Application 2019 & 2032
- Table 64: Rest of Asia Pacific Service Delivery Automation Industry Volume (K Unit) Forecast, by Application 2019 & 2032
- Table 65: Global Service Delivery Automation Industry Revenue Million Forecast, by Country 2019 & 2032
- Table 66: Global Service Delivery Automation Industry Volume K Unit Forecast, by Country 2019 & 2032
- Table 67: Brazil Service Delivery Automation Industry Revenue (Million) Forecast, by Application 2019 & 2032
- Table 68: Brazil Service Delivery Automation Industry Volume (K Unit) Forecast, by Application 2019 & 2032
- Table 69: Argentina Service Delivery Automation Industry Revenue (Million) Forecast, by Application 2019 & 2032
- Table 70: Argentina Service Delivery Automation Industry Volume (K Unit) Forecast, by Application 2019 & 2032
- Table 71: Peru Service Delivery Automation Industry Revenue (Million) Forecast, by Application 2019 & 2032
- Table 72: Peru Service Delivery Automation Industry Volume (K Unit) Forecast, by Application 2019 & 2032
- Table 73: Chile Service Delivery Automation Industry Revenue (Million) Forecast, by Application 2019 & 2032
- Table 74: Chile Service Delivery Automation Industry Volume (K Unit) Forecast, by Application 2019 & 2032
- Table 75: Colombia Service Delivery Automation Industry Revenue (Million) Forecast, by Application 2019 & 2032
- Table 76: Colombia Service Delivery Automation Industry Volume (K Unit) Forecast, by Application 2019 & 2032
- Table 77: Ecuador Service Delivery Automation Industry Revenue (Million) Forecast, by Application 2019 & 2032
- Table 78: Ecuador Service Delivery Automation Industry Volume (K Unit) Forecast, by Application 2019 & 2032
- Table 79: Venezuela Service Delivery Automation Industry Revenue (Million) Forecast, by Application 2019 & 2032
- Table 80: Venezuela Service Delivery Automation Industry Volume (K Unit) Forecast, by Application 2019 & 2032
- Table 81: Rest of South America Service Delivery Automation Industry Revenue (Million) Forecast, by Application 2019 & 2032
- Table 82: Rest of South America Service Delivery Automation Industry Volume (K Unit) Forecast, by Application 2019 & 2032
- Table 83: Global Service Delivery Automation Industry Revenue Million Forecast, by Country 2019 & 2032
- Table 84: Global Service Delivery Automation Industry Volume K Unit Forecast, by Country 2019 & 2032
- Table 85: United States Service Delivery Automation Industry Revenue (Million) Forecast, by Application 2019 & 2032
- Table 86: United States Service Delivery Automation Industry Volume (K Unit) Forecast, by Application 2019 & 2032
- Table 87: Canada Service Delivery Automation Industry Revenue (Million) Forecast, by Application 2019 & 2032
- Table 88: Canada Service Delivery Automation Industry Volume (K Unit) Forecast, by Application 2019 & 2032
- Table 89: Mexico Service Delivery Automation Industry Revenue (Million) Forecast, by Application 2019 & 2032
- Table 90: Mexico Service Delivery Automation Industry Volume (K Unit) Forecast, by Application 2019 & 2032
- Table 91: Global Service Delivery Automation Industry Revenue Million Forecast, by Country 2019 & 2032
- Table 92: Global Service Delivery Automation Industry Volume K Unit Forecast, by Country 2019 & 2032
- Table 93: United Arab Emirates Service Delivery Automation Industry Revenue (Million) Forecast, by Application 2019 & 2032
- Table 94: United Arab Emirates Service Delivery Automation Industry Volume (K Unit) Forecast, by Application 2019 & 2032
- Table 95: Saudi Arabia Service Delivery Automation Industry Revenue (Million) Forecast, by Application 2019 & 2032
- Table 96: Saudi Arabia Service Delivery Automation Industry Volume (K Unit) Forecast, by Application 2019 & 2032
- Table 97: South Africa Service Delivery Automation Industry Revenue (Million) Forecast, by Application 2019 & 2032
- Table 98: South Africa Service Delivery Automation Industry Volume (K Unit) Forecast, by Application 2019 & 2032
- Table 99: Rest of Middle East and Africa Service Delivery Automation Industry Revenue (Million) Forecast, by Application 2019 & 2032
- Table 100: Rest of Middle East and Africa Service Delivery Automation Industry Volume (K Unit) Forecast, by Application 2019 & 2032
- Table 101: Global Service Delivery Automation Industry Revenue Million Forecast, by Type 2019 & 2032
- Table 102: Global Service Delivery Automation Industry Volume K Unit Forecast, by Type 2019 & 2032
- Table 103: Global Service Delivery Automation Industry Revenue Million Forecast, by Organization Size 2019 & 2032
- Table 104: Global Service Delivery Automation Industry Volume K Unit Forecast, by Organization Size 2019 & 2032
- Table 105: Global Service Delivery Automation Industry Revenue Million Forecast, by End-user Industry 2019 & 2032
- Table 106: Global Service Delivery Automation Industry Volume K Unit Forecast, by End-user Industry 2019 & 2032
- Table 107: Global Service Delivery Automation Industry Revenue Million Forecast, by Country 2019 & 2032
- Table 108: Global Service Delivery Automation Industry Volume K Unit Forecast, by Country 2019 & 2032
- Table 109: Global Service Delivery Automation Industry Revenue Million Forecast, by Type 2019 & 2032
- Table 110: Global Service Delivery Automation Industry Volume K Unit Forecast, by Type 2019 & 2032
- Table 111: Global Service Delivery Automation Industry Revenue Million Forecast, by Organization Size 2019 & 2032
- Table 112: Global Service Delivery Automation Industry Volume K Unit Forecast, by Organization Size 2019 & 2032
- Table 113: Global Service Delivery Automation Industry Revenue Million Forecast, by End-user Industry 2019 & 2032
- Table 114: Global Service Delivery Automation Industry Volume K Unit Forecast, by End-user Industry 2019 & 2032
- Table 115: Global Service Delivery Automation Industry Revenue Million Forecast, by Country 2019 & 2032
- Table 116: Global Service Delivery Automation Industry Volume K Unit Forecast, by Country 2019 & 2032
- Table 117: Global Service Delivery Automation Industry Revenue Million Forecast, by Type 2019 & 2032
- Table 118: Global Service Delivery Automation Industry Volume K Unit Forecast, by Type 2019 & 2032
- Table 119: Global Service Delivery Automation Industry Revenue Million Forecast, by Organization Size 2019 & 2032
- Table 120: Global Service Delivery Automation Industry Volume K Unit Forecast, by Organization Size 2019 & 2032
- Table 121: Global Service Delivery Automation Industry Revenue Million Forecast, by End-user Industry 2019 & 2032
- Table 122: Global Service Delivery Automation Industry Volume K Unit Forecast, by End-user Industry 2019 & 2032
- Table 123: Global Service Delivery Automation Industry Revenue Million Forecast, by Country 2019 & 2032
- Table 124: Global Service Delivery Automation Industry Volume K Unit Forecast, by Country 2019 & 2032
- Table 125: Global Service Delivery Automation Industry Revenue Million Forecast, by Type 2019 & 2032
- Table 126: Global Service Delivery Automation Industry Volume K Unit Forecast, by Type 2019 & 2032
- Table 127: Global Service Delivery Automation Industry Revenue Million Forecast, by Organization Size 2019 & 2032
- Table 128: Global Service Delivery Automation Industry Volume K Unit Forecast, by Organization Size 2019 & 2032
- Table 129: Global Service Delivery Automation Industry Revenue Million Forecast, by End-user Industry 2019 & 2032
- Table 130: Global Service Delivery Automation Industry Volume K Unit Forecast, by End-user Industry 2019 & 2032
- Table 131: Global Service Delivery Automation Industry Revenue Million Forecast, by Country 2019 & 2032
- Table 132: Global Service Delivery Automation Industry Volume K Unit Forecast, by Country 2019 & 2032
- Table 133: Global Service Delivery Automation Industry Revenue Million Forecast, by Type 2019 & 2032
- Table 134: Global Service Delivery Automation Industry Volume K Unit Forecast, by Type 2019 & 2032
- Table 135: Global Service Delivery Automation Industry Revenue Million Forecast, by Organization Size 2019 & 2032
- Table 136: Global Service Delivery Automation Industry Volume K Unit Forecast, by Organization Size 2019 & 2032
- Table 137: Global Service Delivery Automation Industry Revenue Million Forecast, by End-user Industry 2019 & 2032
- Table 138: Global Service Delivery Automation Industry Volume K Unit Forecast, by End-user Industry 2019 & 2032
- Table 139: Global Service Delivery Automation Industry Revenue Million Forecast, by Country 2019 & 2032
- Table 140: Global Service Delivery Automation Industry Volume K Unit Forecast, by Country 2019 & 2032
Frequently Asked Questions
1. What is the projected Compound Annual Growth Rate (CAGR) of the Service Delivery Automation Industry?
The projected CAGR is approximately 27.25%.
2. Which companies are prominent players in the Service Delivery Automation Industry?
Key companies in the market include Arago GmbH, NICE Systems Ltd, AutomationEdge Technologies Inc, Xerox Corporation, Celaton Limited, Automation Anywhere Inc, Uipath SRL, IPsoft Inc, Blue Prism, Accenture Inc.
3. What are the main segments of the Service Delivery Automation Industry?
The market segments include Type, Organization Size, End-user Industry.
4. Can you provide details about the market size?
The market size is estimated to be USD 30.65 Million as of 2022.
5. What are some drivers contributing to market growth?
Need for Operational Efficiency; Cost-cutting Across Industries.
6. What are the notable trends driving market growth?
Retail and Consumer Goods to Dominate the Market.
7. Are there any restraints impacting market growth?
Lack of Skilled Personnel.
8. Can you provide examples of recent developments in the market?
March 2023: UiPath announced that data science teams who use Amazon SageMaker, an end-to-end machine learning (ML) service, can now integrate new machine learning models into business processes seamlessly and quickly with UiPath without intricate coding or manual labor. By automating deployment pipelines, data scientists, ML engineers, and business analysts can decrease the cost of experimentation and speed up innovation.
9. What pricing options are available for accessing the report?
Pricing options include single-user, multi-user, and enterprise licenses priced at USD 4750, USD 5250, and USD 8750 respectively.
10. Is the market size provided in terms of value or volume?
The market size is provided in terms of value, measured in Million and volume, measured in K Unit.
11. Are there any specific market keywords associated with the report?
Yes, the market keyword associated with the report is "Service Delivery Automation Industry," which aids in identifying and referencing the specific market segment covered.
12. How do I determine which pricing option suits my needs best?
The pricing options vary based on user requirements and access needs. Individual users may opt for single-user licenses, while businesses requiring broader access may choose multi-user or enterprise licenses for cost-effective access to the report.
13. Are there any additional resources or data provided in the Service Delivery Automation Industry report?
While the report offers comprehensive insights, it's advisable to review the specific contents or supplementary materials provided to ascertain if additional resources or data are available.
14. How can I stay updated on further developments or reports in the Service Delivery Automation Industry?
To stay informed about further developments, trends, and reports in the Service Delivery Automation Industry, consider subscribing to industry newsletters, following relevant companies and organizations, or regularly checking reputable industry news sources and publications.
Methodology
Step 1 - Identification of Relevant Samples Size from Population Database


Step 2 - Approaches for Defining Global Market Size (Value, Volume* & Price*)

Note*: In applicable scenarios
Step 3 - Data Sources
Primary Research
- Web Analytics
- Survey Reports
- Research Institute
- Latest Research Reports
- Opinion Leaders
Secondary Research
- Annual Reports
- White Paper
- Latest Press Release
- Industry Association
- Paid Database
- Investor Presentations

Step 4 - Data Triangulation
Involves using different sources of information in order to increase the validity of a study
These sources are likely to be stakeholders in a program - participants, other researchers, program staff, other community members, and so on.
Then we put all data in single framework & apply various statistical tools to find out the dynamic on the market.
During the analysis stage, feedback from the stakeholder groups would be compared to determine areas of agreement as well as areas of divergence


