
Key Insights
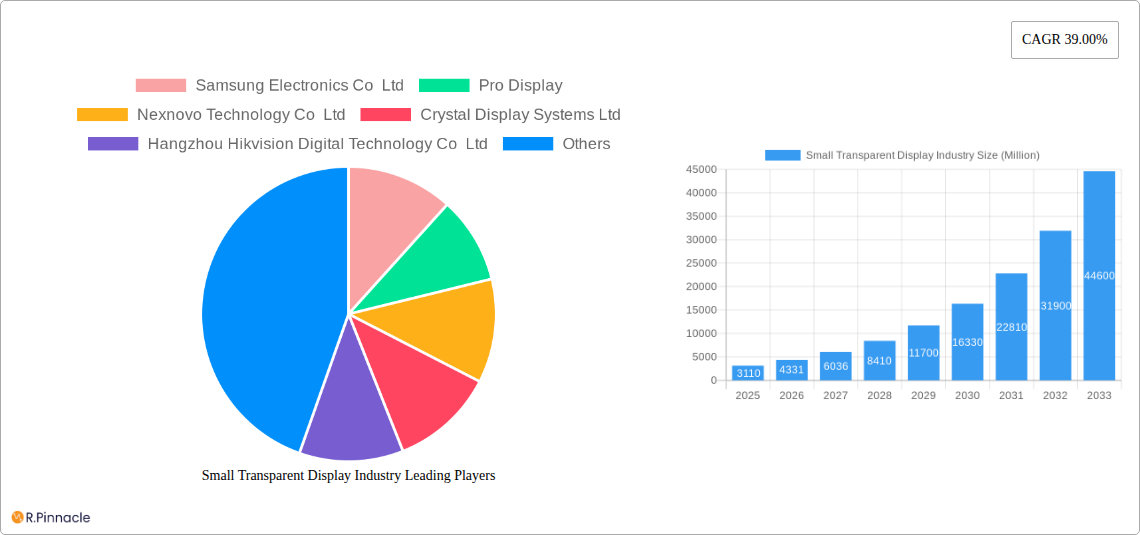
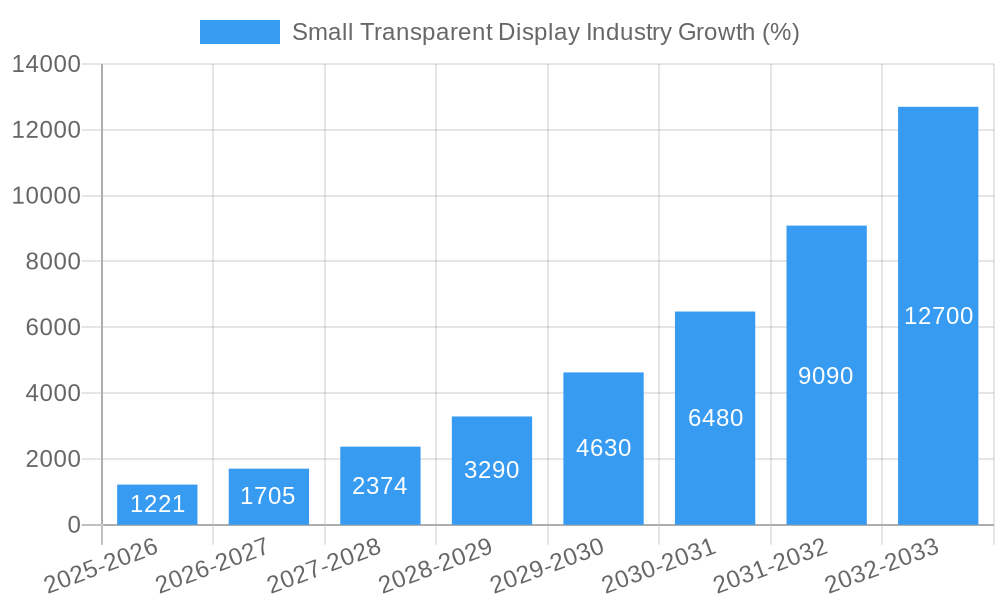
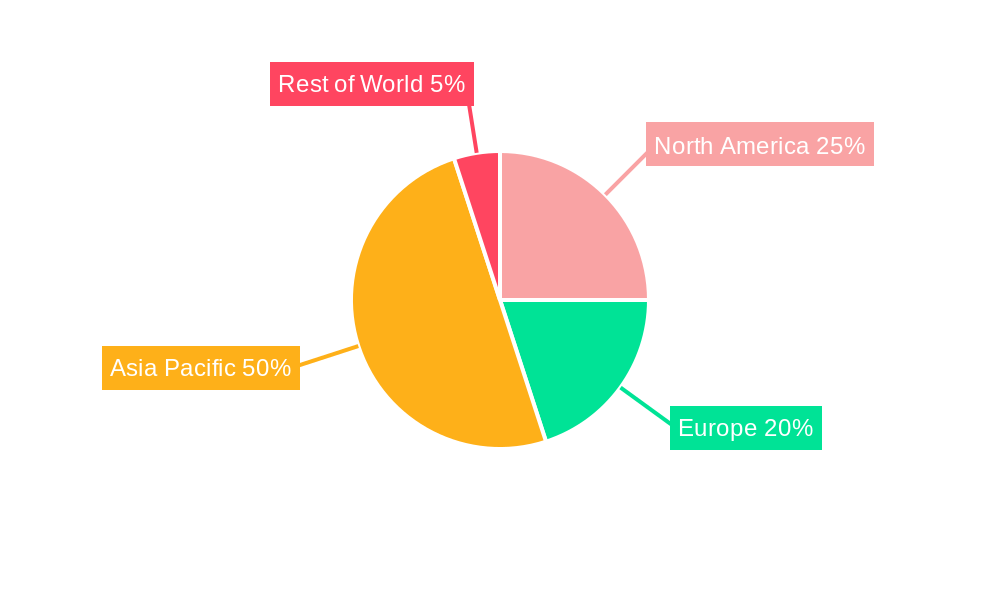
The small transparent display market is experiencing robust growth, projected to reach \$3.11 billion in 2025 and exhibiting a remarkable Compound Annual Growth Rate (CAGR) of 39% from 2025 to 2033. This expansion is fueled by several key drivers. Increasing demand from the consumer electronics sector, particularly in smartphones and wearables featuring advanced augmented reality (AR) and heads-up displays (HUD), is a significant factor. The automotive industry's adoption of transparent displays for advanced driver-assistance systems (ADAS) and in-car entertainment further propels market growth. Technological advancements, such as improved display resolution, brightness, and power efficiency, are also contributing to wider adoption. The retail sector's use of interactive and dynamic displays is another contributing factor. While higher production costs and limited availability of specialized materials currently pose challenges, ongoing research and development efforts aimed at cost reduction and material optimization promise to mitigate these restraints in the coming years. The market is segmented by technology (LCD, OLED, others) and end-user industry (retail, consumer electronics, automotive, aerospace & defense, others), with consumer electronics and automotive currently representing the largest segments. Competition is intensifying, with key players like Samsung, LG, and BOE actively investing in R&D and expanding their product portfolios to capture market share. The Asia-Pacific region, particularly China and South Korea, is expected to dominate the market due to strong manufacturing capabilities and high consumer demand. North America and Europe are also expected to witness significant growth due to the increasing adoption of advanced technologies across various industries.
The forecast period (2025-2033) anticipates continued strong growth, driven by ongoing technological advancements, new applications in emerging sectors (e.g., healthcare, smart homes), and increasing consumer preference for innovative and user-friendly interfaces. However, maintaining the current CAGR will depend on factors such as overcoming supply chain challenges, further reducing production costs, and ensuring the development of reliable and durable transparent display technologies that meet the varied demands of different end-user applications. The market's future trajectory is significantly influenced by the continuous innovation in materials science, display technologies, and the rate of adoption across diverse industries. A successful strategy for industry players involves strategic partnerships, focused R&D efforts, and a clear understanding of evolving market dynamics and consumer trends.
Small Transparent Display Industry Market Report: 2019-2033
This comprehensive report provides a detailed analysis of the small transparent display industry, offering invaluable insights for industry professionals, investors, and strategic decision-makers. The report covers market size, growth projections, leading companies, technological advancements, and future trends, focusing on the period 2019-2033, with 2025 as the base and estimated year. The market is segmented by technology (LCD, OLED, Other Technologies) and end-user industry (Retail, Consumer Electronics, Automotive, Aerospace & Defense, Other End-User Industries). Expect detailed analysis of market dynamics, including a forecast reaching xx Million by 2033.
Small Transparent Display Industry Market Structure & Innovation Trends
The small transparent display market is characterized by a moderately concentrated landscape, with key players such as Samsung Electronics Co Ltd, LG Electronics Co Ltd, and BOE Technology Group holding significant market share (estimated at xx% collectively in 2025). However, the emergence of innovative smaller companies like Nexnovo Technology Co Ltd and Shenzhen AuroLED Technology Co Ltd is increasing competition. Market share dynamics are significantly influenced by continuous technological advancements, particularly in OLED and microLED technologies. Regulatory frameworks, while not overly restrictive currently, are evolving and could impact the adoption of certain materials and manufacturing processes. Product substitutes, such as projected displays, present a competitive challenge, but the unique aesthetic and functional advantages of transparent displays maintain their market relevance. Mergers and acquisitions (M&A) activity in this sector has been moderate in recent years (xx Million in total deal value between 2019-2024), reflecting strategic consolidation and technological integration efforts.
- Market Concentration: Moderately concentrated, with key players holding xx% of market share in 2025.
- Innovation Drivers: Advancements in OLED and microLED technologies; rising demand for aesthetically pleasing and functional displays.
- Regulatory Frameworks: Evolving, with potential future impact on material usage and manufacturing.
- Product Substitutes: Projected displays pose a moderate competitive threat.
- M&A Activity: Moderate, with a total deal value of xx Million between 2019-2024.
Small Transparent Display Industry Market Dynamics & Trends
The small transparent display market is witnessing robust growth, driven by increasing demand across diverse sectors. The Compound Annual Growth Rate (CAGR) is projected to be xx% from 2025 to 2033, propelled by technological advancements in OLED and microLED, leading to improved brightness, transparency, and durability. Consumer preference for innovative and visually appealing displays is boosting market penetration, particularly in retail and consumer electronics applications. However, high manufacturing costs and supply chain complexities represent challenges. Competitive dynamics are characterized by both established players and emerging startups vying for market dominance. The market penetration rate is expected to reach xx% by 2033. The automotive sector is showing particularly strong growth, as showcased by recent developments such as Tianma's transparent microLED prototypes.
Dominant Regions & Segments in Small Transparent Display Industry
The Asia-Pacific region, particularly China and South Korea, currently dominates the small transparent display market, driven by strong manufacturing capabilities, a large consumer base, and supportive government policies. Within the technology segment, OLED is currently the leading technology, while the automotive sector stands out as the fastest-growing end-user industry.
Key Drivers in Asia-Pacific:
- Robust manufacturing infrastructure.
- High consumer demand for advanced technology.
- Government support for technological innovation.
Dominance Analysis: Asia-Pacific's dominance stems from a combination of strong manufacturing capabilities, economies of scale, and early adoption of cutting-edge technologies. The automotive sector's emergence is fueled by the increasing integration of advanced displays into vehicles' interior designs. The OLED technology segment is driven by its superior image quality and power efficiency compared to LCD.
Small Transparent Display Industry Product Innovations
Recent innovations focus on enhancing brightness, transparency, resolution, and durability in small transparent displays. MicroLED technology is emerging as a key driver of innovation, offering superior performance characteristics. The development of flexible and transparent displays is expanding applications into wearables and other niche sectors. These innovations are improving the market fit of transparent displays, leading to wider adoption across various end-user industries.
Report Scope & Segmentation Analysis
This report provides a comprehensive analysis of the small transparent display market, segmented by technology (LCD, OLED, Other Technologies) and end-user industry (Retail, Consumer Electronics, Automotive, Aerospace & Defense, Other End-User Industries). Each segment is analyzed based on growth projections, market size, and competitive dynamics. The OLED segment is expected to witness the highest growth due to its superior performance attributes. The automotive industry is poised for significant growth owing to the increasing demand for advanced in-vehicle displays.
Key Drivers of Small Transparent Display Industry Growth
Several factors drive the growth of this sector. Technological advancements, notably in OLED and microLED technologies, are improving display quality and reducing costs. Increasing consumer demand for aesthetically pleasing and functional displays in various sectors, coupled with supportive government policies promoting technological innovation in some regions (e.g., Asia-Pacific), accelerate market expansion. Furthermore, the growing adoption of transparent displays in new applications within the automotive and aerospace industries is contributing to the market's momentum.
Challenges in the Small Transparent Display Industry Sector
Despite its growth potential, the small transparent display industry faces certain challenges. High manufacturing costs, particularly for advanced technologies like microLED, impact profitability and limit wider adoption. Supply chain complexities and the availability of raw materials can disrupt production and lead to price fluctuations. Moreover, intense competition among established players and new entrants adds to pressure on pricing and margins.
Emerging Opportunities in Small Transparent Display Industry
Several emerging opportunities exist. The expansion of applications into new sectors, such as smart homes and medical devices, presents significant growth potential. Technological advancements, particularly in flexible and foldable transparent displays, are opening up new possibilities. Moreover, the increasing consumer preference for personalized and interactive displays creates a favorable market environment for innovative product development.
Leading Players in the Small Transparent Display Industry Market
- Samsung Electronics Co Ltd
- Pro Display
- Nexnovo Technology Co Ltd
- Crystal Display Systems Ltd
- Hangzhou Hikvision Digital Technology Co Ltd
- Planar Systems Inc (Leyard Optoelectronic Co )
- Shenzhen AuroLED Technology Co Ltd
- BOE Technology Group
- LG Electronics Co Ltd
- Panasonic Corporation
- 2Point0 Concepts
Key Developments in Small Transparent Display Industry Industry
July 2023: Tianma unveiled transparent microLED display prototypes at Display Week 2023, targeting the automotive sector. The 8.75” panel boasts 880x480 resolution, 800 nits brightness, and >70% transparency. This signifies a significant advancement in microLED technology for automotive applications.
June 2023: LG Business Solutions USA showcased its transparent digital displays at InfoComm 2023, including LED films, a 55-inch OLED panel, and 50/30-inch transparent OLED touch displays. This demonstrates growing diversification within transparent display technology and its applicability across various sectors.
Future Outlook for Small Transparent Display Industry Market
The future of the small transparent display market looks promising. Continued technological advancements, particularly in microLED and other emerging technologies, will drive further miniaturization, improved performance, and cost reduction. Expanding applications across various sectors, coupled with increasing consumer demand for innovative displays, will fuel market growth. Strategic partnerships and M&A activity will further shape the market landscape, promoting innovation and expansion.
Small Transparent Display Industry Segmentation
-
1. Technology
- 1.1. LCD
- 1.2. OLED
- 1.3. Other Technologies
-
2. End-user Industry
- 2.1. Retail
- 2.2. Consumer Electronics
- 2.3. Automotive
- 2.4. Aerospace and Defense
- 2.5. Other End-user Industries
Small Transparent Display Industry Segmentation By Geography
-
1. North America
- 1.1. United States
- 1.2. Canada
-
2. Europe
- 2.1. Germany
- 2.2. United Kingdom
- 2.3. France
-
3. Asia
- 3.1. China
- 3.2. Japan
- 3.3. India
- 3.4. South Korea
- 3.5. Australia and New Zealand
- 4. Latin America
- 5. Middle East and Africa
Small Transparent Display Industry REPORT HIGHLIGHTS
| Aspects | Details |
|---|---|
| Study Period | 2019-2033 |
| Base Year | 2024 |
| Estimated Year | 2025 |
| Forecast Period | 2025-2033 |
| Historical Period | 2019-2024 |
| Growth Rate | CAGR of 39.00% from 2019-2033 |
| Segmentation |
|
Table of Contents
- 1. Introduction
- 1.1. Research Scope
- 1.2. Market Segmentation
- 1.3. Research Methodology
- 1.4. Definitions and Assumptions
- 2. Executive Summary
- 2.1. Introduction
- 3. Market Dynamics
- 3.1. Introduction
- 3.2. Market Drivers
- 3.2.1. Increasing Demand for Advanced Displays in the Automotive Market; Growth of Augmented and Virtual Reality
- 3.3. Market Restrains
- 3.3.1. Complex Manufacturing Process and Expensive to Deploy in Consumer Products
- 3.4. Market Trends
- 3.4.1. Retail Sector to Hold a Significant Market Share
- 4. Market Factor Analysis
- 4.1. Porters Five Forces
- 4.2. Supply/Value Chain
- 4.3. PESTEL analysis
- 4.4. Market Entropy
- 4.5. Patent/Trademark Analysis
- 5. Global Small Transparent Display Industry Analysis, Insights and Forecast, 2019-2031
- 5.1. Market Analysis, Insights and Forecast - by Technology
- 5.1.1. LCD
- 5.1.2. OLED
- 5.1.3. Other Technologies
- 5.2. Market Analysis, Insights and Forecast - by End-user Industry
- 5.2.1. Retail
- 5.2.2. Consumer Electronics
- 5.2.3. Automotive
- 5.2.4. Aerospace and Defense
- 5.2.5. Other End-user Industries
- 5.3. Market Analysis, Insights and Forecast - by Region
- 5.3.1. North America
- 5.3.2. Europe
- 5.3.3. Asia
- 5.3.4. Latin America
- 5.3.5. Middle East and Africa
- 5.1. Market Analysis, Insights and Forecast - by Technology
- 6. North America Small Transparent Display Industry Analysis, Insights and Forecast, 2019-2031
- 6.1. Market Analysis, Insights and Forecast - by Technology
- 6.1.1. LCD
- 6.1.2. OLED
- 6.1.3. Other Technologies
- 6.2. Market Analysis, Insights and Forecast - by End-user Industry
- 6.2.1. Retail
- 6.2.2. Consumer Electronics
- 6.2.3. Automotive
- 6.2.4. Aerospace and Defense
- 6.2.5. Other End-user Industries
- 6.1. Market Analysis, Insights and Forecast - by Technology
- 7. Europe Small Transparent Display Industry Analysis, Insights and Forecast, 2019-2031
- 7.1. Market Analysis, Insights and Forecast - by Technology
- 7.1.1. LCD
- 7.1.2. OLED
- 7.1.3. Other Technologies
- 7.2. Market Analysis, Insights and Forecast - by End-user Industry
- 7.2.1. Retail
- 7.2.2. Consumer Electronics
- 7.2.3. Automotive
- 7.2.4. Aerospace and Defense
- 7.2.5. Other End-user Industries
- 7.1. Market Analysis, Insights and Forecast - by Technology
- 8. Asia Small Transparent Display Industry Analysis, Insights and Forecast, 2019-2031
- 8.1. Market Analysis, Insights and Forecast - by Technology
- 8.1.1. LCD
- 8.1.2. OLED
- 8.1.3. Other Technologies
- 8.2. Market Analysis, Insights and Forecast - by End-user Industry
- 8.2.1. Retail
- 8.2.2. Consumer Electronics
- 8.2.3. Automotive
- 8.2.4. Aerospace and Defense
- 8.2.5. Other End-user Industries
- 8.1. Market Analysis, Insights and Forecast - by Technology
- 9. Latin America Small Transparent Display Industry Analysis, Insights and Forecast, 2019-2031
- 9.1. Market Analysis, Insights and Forecast - by Technology
- 9.1.1. LCD
- 9.1.2. OLED
- 9.1.3. Other Technologies
- 9.2. Market Analysis, Insights and Forecast - by End-user Industry
- 9.2.1. Retail
- 9.2.2. Consumer Electronics
- 9.2.3. Automotive
- 9.2.4. Aerospace and Defense
- 9.2.5. Other End-user Industries
- 9.1. Market Analysis, Insights and Forecast - by Technology
- 10. Middle East and Africa Small Transparent Display Industry Analysis, Insights and Forecast, 2019-2031
- 10.1. Market Analysis, Insights and Forecast - by Technology
- 10.1.1. LCD
- 10.1.2. OLED
- 10.1.3. Other Technologies
- 10.2. Market Analysis, Insights and Forecast - by End-user Industry
- 10.2.1. Retail
- 10.2.2. Consumer Electronics
- 10.2.3. Automotive
- 10.2.4. Aerospace and Defense
- 10.2.5. Other End-user Industries
- 10.1. Market Analysis, Insights and Forecast - by Technology
- 11. North America Small Transparent Display Industry Analysis, Insights and Forecast, 2019-2031
- 11.1. Market Analysis, Insights and Forecast - By Country/Sub-region
- 11.1.1 United States
- 11.1.2 Canada
- 12. Europe Small Transparent Display Industry Analysis, Insights and Forecast, 2019-2031
- 12.1. Market Analysis, Insights and Forecast - By Country/Sub-region
- 12.1.1 Germany
- 12.1.2 United Kingdom
- 12.1.3 France
- 12.1.4 Rest of Europe
- 13. Asia Pacific Small Transparent Display Industry Analysis, Insights and Forecast, 2019-2031
- 13.1. Market Analysis, Insights and Forecast - By Country/Sub-region
- 13.1.1 China
- 13.1.2 Japan
- 13.1.3 India
- 13.1.4 South Korea
- 13.1.5 Rest of Asia Pacific
- 14. Rest of the World Small Transparent Display Industry Analysis, Insights and Forecast, 2019-2031
- 14.1. Market Analysis, Insights and Forecast - By Country/Sub-region
- 14.1.1.
- 15. Competitive Analysis
- 15.1. Global Market Share Analysis 2024
- 15.2. Company Profiles
- 15.2.1 Samsung Electronics Co Ltd
- 15.2.1.1. Overview
- 15.2.1.2. Products
- 15.2.1.3. SWOT Analysis
- 15.2.1.4. Recent Developments
- 15.2.1.5. Financials (Based on Availability)
- 15.2.2 Pro Display
- 15.2.2.1. Overview
- 15.2.2.2. Products
- 15.2.2.3. SWOT Analysis
- 15.2.2.4. Recent Developments
- 15.2.2.5. Financials (Based on Availability)
- 15.2.3 Nexnovo Technology Co Ltd
- 15.2.3.1. Overview
- 15.2.3.2. Products
- 15.2.3.3. SWOT Analysis
- 15.2.3.4. Recent Developments
- 15.2.3.5. Financials (Based on Availability)
- 15.2.4 Crystal Display Systems Ltd
- 15.2.4.1. Overview
- 15.2.4.2. Products
- 15.2.4.3. SWOT Analysis
- 15.2.4.4. Recent Developments
- 15.2.4.5. Financials (Based on Availability)
- 15.2.5 Hangzhou Hikvision Digital Technology Co Ltd
- 15.2.5.1. Overview
- 15.2.5.2. Products
- 15.2.5.3. SWOT Analysis
- 15.2.5.4. Recent Developments
- 15.2.5.5. Financials (Based on Availability)
- 15.2.6 Planar Systems Inc (Leyard Optoelectronic Co )
- 15.2.6.1. Overview
- 15.2.6.2. Products
- 15.2.6.3. SWOT Analysis
- 15.2.6.4. Recent Developments
- 15.2.6.5. Financials (Based on Availability)
- 15.2.7 Shenzhen AuroLED Technology Co Ltd
- 15.2.7.1. Overview
- 15.2.7.2. Products
- 15.2.7.3. SWOT Analysis
- 15.2.7.4. Recent Developments
- 15.2.7.5. Financials (Based on Availability)
- 15.2.8 BOE Technology Grou
- 15.2.8.1. Overview
- 15.2.8.2. Products
- 15.2.8.3. SWOT Analysis
- 15.2.8.4. Recent Developments
- 15.2.8.5. Financials (Based on Availability)
- 15.2.9 LG Electronics Co Ltd
- 15.2.9.1. Overview
- 15.2.9.2. Products
- 15.2.9.3. SWOT Analysis
- 15.2.9.4. Recent Developments
- 15.2.9.5. Financials (Based on Availability)
- 15.2.10 Panasonic Corporation
- 15.2.10.1. Overview
- 15.2.10.2. Products
- 15.2.10.3. SWOT Analysis
- 15.2.10.4. Recent Developments
- 15.2.10.5. Financials (Based on Availability)
- 15.2.11 2Point0 Concepts
- 15.2.11.1. Overview
- 15.2.11.2. Products
- 15.2.11.3. SWOT Analysis
- 15.2.11.4. Recent Developments
- 15.2.11.5. Financials (Based on Availability)
- 15.2.1 Samsung Electronics Co Ltd
List of Figures
- Figure 1: Global Small Transparent Display Industry Revenue Breakdown (Million, %) by Region 2024 & 2032
- Figure 2: North America Small Transparent Display Industry Revenue (Million), by Country 2024 & 2032
- Figure 3: North America Small Transparent Display Industry Revenue Share (%), by Country 2024 & 2032
- Figure 4: Europe Small Transparent Display Industry Revenue (Million), by Country 2024 & 2032
- Figure 5: Europe Small Transparent Display Industry Revenue Share (%), by Country 2024 & 2032
- Figure 6: Asia Pacific Small Transparent Display Industry Revenue (Million), by Country 2024 & 2032
- Figure 7: Asia Pacific Small Transparent Display Industry Revenue Share (%), by Country 2024 & 2032
- Figure 8: Rest of the World Small Transparent Display Industry Revenue (Million), by Country 2024 & 2032
- Figure 9: Rest of the World Small Transparent Display Industry Revenue Share (%), by Country 2024 & 2032
- Figure 10: North America Small Transparent Display Industry Revenue (Million), by Technology 2024 & 2032
- Figure 11: North America Small Transparent Display Industry Revenue Share (%), by Technology 2024 & 2032
- Figure 12: North America Small Transparent Display Industry Revenue (Million), by End-user Industry 2024 & 2032
- Figure 13: North America Small Transparent Display Industry Revenue Share (%), by End-user Industry 2024 & 2032
- Figure 14: North America Small Transparent Display Industry Revenue (Million), by Country 2024 & 2032
- Figure 15: North America Small Transparent Display Industry Revenue Share (%), by Country 2024 & 2032
- Figure 16: Europe Small Transparent Display Industry Revenue (Million), by Technology 2024 & 2032
- Figure 17: Europe Small Transparent Display Industry Revenue Share (%), by Technology 2024 & 2032
- Figure 18: Europe Small Transparent Display Industry Revenue (Million), by End-user Industry 2024 & 2032
- Figure 19: Europe Small Transparent Display Industry Revenue Share (%), by End-user Industry 2024 & 2032
- Figure 20: Europe Small Transparent Display Industry Revenue (Million), by Country 2024 & 2032
- Figure 21: Europe Small Transparent Display Industry Revenue Share (%), by Country 2024 & 2032
- Figure 22: Asia Small Transparent Display Industry Revenue (Million), by Technology 2024 & 2032
- Figure 23: Asia Small Transparent Display Industry Revenue Share (%), by Technology 2024 & 2032
- Figure 24: Asia Small Transparent Display Industry Revenue (Million), by End-user Industry 2024 & 2032
- Figure 25: Asia Small Transparent Display Industry Revenue Share (%), by End-user Industry 2024 & 2032
- Figure 26: Asia Small Transparent Display Industry Revenue (Million), by Country 2024 & 2032
- Figure 27: Asia Small Transparent Display Industry Revenue Share (%), by Country 2024 & 2032
- Figure 28: Latin America Small Transparent Display Industry Revenue (Million), by Technology 2024 & 2032
- Figure 29: Latin America Small Transparent Display Industry Revenue Share (%), by Technology 2024 & 2032
- Figure 30: Latin America Small Transparent Display Industry Revenue (Million), by End-user Industry 2024 & 2032
- Figure 31: Latin America Small Transparent Display Industry Revenue Share (%), by End-user Industry 2024 & 2032
- Figure 32: Latin America Small Transparent Display Industry Revenue (Million), by Country 2024 & 2032
- Figure 33: Latin America Small Transparent Display Industry Revenue Share (%), by Country 2024 & 2032
- Figure 34: Middle East and Africa Small Transparent Display Industry Revenue (Million), by Technology 2024 & 2032
- Figure 35: Middle East and Africa Small Transparent Display Industry Revenue Share (%), by Technology 2024 & 2032
- Figure 36: Middle East and Africa Small Transparent Display Industry Revenue (Million), by End-user Industry 2024 & 2032
- Figure 37: Middle East and Africa Small Transparent Display Industry Revenue Share (%), by End-user Industry 2024 & 2032
- Figure 38: Middle East and Africa Small Transparent Display Industry Revenue (Million), by Country 2024 & 2032
- Figure 39: Middle East and Africa Small Transparent Display Industry Revenue Share (%), by Country 2024 & 2032
List of Tables
- Table 1: Global Small Transparent Display Industry Revenue Million Forecast, by Region 2019 & 2032
- Table 2: Global Small Transparent Display Industry Revenue Million Forecast, by Technology 2019 & 2032
- Table 3: Global Small Transparent Display Industry Revenue Million Forecast, by End-user Industry 2019 & 2032
- Table 4: Global Small Transparent Display Industry Revenue Million Forecast, by Region 2019 & 2032
- Table 5: Global Small Transparent Display Industry Revenue Million Forecast, by Country 2019 & 2032
- Table 6: United States Small Transparent Display Industry Revenue (Million) Forecast, by Application 2019 & 2032
- Table 7: Canada Small Transparent Display Industry Revenue (Million) Forecast, by Application 2019 & 2032
- Table 8: Global Small Transparent Display Industry Revenue Million Forecast, by Country 2019 & 2032
- Table 9: Germany Small Transparent Display Industry Revenue (Million) Forecast, by Application 2019 & 2032
- Table 10: United Kingdom Small Transparent Display Industry Revenue (Million) Forecast, by Application 2019 & 2032
- Table 11: France Small Transparent Display Industry Revenue (Million) Forecast, by Application 2019 & 2032
- Table 12: Rest of Europe Small Transparent Display Industry Revenue (Million) Forecast, by Application 2019 & 2032
- Table 13: Global Small Transparent Display Industry Revenue Million Forecast, by Country 2019 & 2032
- Table 14: China Small Transparent Display Industry Revenue (Million) Forecast, by Application 2019 & 2032
- Table 15: Japan Small Transparent Display Industry Revenue (Million) Forecast, by Application 2019 & 2032
- Table 16: India Small Transparent Display Industry Revenue (Million) Forecast, by Application 2019 & 2032
- Table 17: South Korea Small Transparent Display Industry Revenue (Million) Forecast, by Application 2019 & 2032
- Table 18: Rest of Asia Pacific Small Transparent Display Industry Revenue (Million) Forecast, by Application 2019 & 2032
- Table 19: Global Small Transparent Display Industry Revenue Million Forecast, by Country 2019 & 2032
- Table 20: Small Transparent Display Industry Revenue (Million) Forecast, by Application 2019 & 2032
- Table 21: Global Small Transparent Display Industry Revenue Million Forecast, by Technology 2019 & 2032
- Table 22: Global Small Transparent Display Industry Revenue Million Forecast, by End-user Industry 2019 & 2032
- Table 23: Global Small Transparent Display Industry Revenue Million Forecast, by Country 2019 & 2032
- Table 24: United States Small Transparent Display Industry Revenue (Million) Forecast, by Application 2019 & 2032
- Table 25: Canada Small Transparent Display Industry Revenue (Million) Forecast, by Application 2019 & 2032
- Table 26: Global Small Transparent Display Industry Revenue Million Forecast, by Technology 2019 & 2032
- Table 27: Global Small Transparent Display Industry Revenue Million Forecast, by End-user Industry 2019 & 2032
- Table 28: Global Small Transparent Display Industry Revenue Million Forecast, by Country 2019 & 2032
- Table 29: Germany Small Transparent Display Industry Revenue (Million) Forecast, by Application 2019 & 2032
- Table 30: United Kingdom Small Transparent Display Industry Revenue (Million) Forecast, by Application 2019 & 2032
- Table 31: France Small Transparent Display Industry Revenue (Million) Forecast, by Application 2019 & 2032
- Table 32: Global Small Transparent Display Industry Revenue Million Forecast, by Technology 2019 & 2032
- Table 33: Global Small Transparent Display Industry Revenue Million Forecast, by End-user Industry 2019 & 2032
- Table 34: Global Small Transparent Display Industry Revenue Million Forecast, by Country 2019 & 2032
- Table 35: China Small Transparent Display Industry Revenue (Million) Forecast, by Application 2019 & 2032
- Table 36: Japan Small Transparent Display Industry Revenue (Million) Forecast, by Application 2019 & 2032
- Table 37: India Small Transparent Display Industry Revenue (Million) Forecast, by Application 2019 & 2032
- Table 38: South Korea Small Transparent Display Industry Revenue (Million) Forecast, by Application 2019 & 2032
- Table 39: Australia and New Zealand Small Transparent Display Industry Revenue (Million) Forecast, by Application 2019 & 2032
- Table 40: Global Small Transparent Display Industry Revenue Million Forecast, by Technology 2019 & 2032
- Table 41: Global Small Transparent Display Industry Revenue Million Forecast, by End-user Industry 2019 & 2032
- Table 42: Global Small Transparent Display Industry Revenue Million Forecast, by Country 2019 & 2032
- Table 43: Global Small Transparent Display Industry Revenue Million Forecast, by Technology 2019 & 2032
- Table 44: Global Small Transparent Display Industry Revenue Million Forecast, by End-user Industry 2019 & 2032
- Table 45: Global Small Transparent Display Industry Revenue Million Forecast, by Country 2019 & 2032
Frequently Asked Questions
1. What is the projected Compound Annual Growth Rate (CAGR) of the Small Transparent Display Industry?
The projected CAGR is approximately 39.00%.
2. Which companies are prominent players in the Small Transparent Display Industry?
Key companies in the market include Samsung Electronics Co Ltd, Pro Display, Nexnovo Technology Co Ltd, Crystal Display Systems Ltd, Hangzhou Hikvision Digital Technology Co Ltd, Planar Systems Inc (Leyard Optoelectronic Co ), Shenzhen AuroLED Technology Co Ltd, BOE Technology Grou, LG Electronics Co Ltd, Panasonic Corporation, 2Point0 Concepts.
3. What are the main segments of the Small Transparent Display Industry?
The market segments include Technology, End-user Industry.
4. Can you provide details about the market size?
The market size is estimated to be USD 3.11 Million as of 2022.
5. What are some drivers contributing to market growth?
Increasing Demand for Advanced Displays in the Automotive Market; Growth of Augmented and Virtual Reality.
6. What are the notable trends driving market growth?
Retail Sector to Hold a Significant Market Share.
7. Are there any restraints impacting market growth?
Complex Manufacturing Process and Expensive to Deploy in Consumer Products.
8. Can you provide examples of recent developments in the market?
Jul 2023: Tianma unveiled the latest transparent microLED display prototypes demonstrated at Display Week 2023. The company claims that the automotive sector is the primary application for these displays. The first display is an 8.75” (114 PPI) panel with an 880x480 resolution, 800 nits brightness, and more than 70% transparency.
9. What pricing options are available for accessing the report?
Pricing options include single-user, multi-user, and enterprise licenses priced at USD 4750, USD 5250, and USD 8750 respectively.
10. Is the market size provided in terms of value or volume?
The market size is provided in terms of value, measured in Million.
11. Are there any specific market keywords associated with the report?
Yes, the market keyword associated with the report is "Small Transparent Display Industry," which aids in identifying and referencing the specific market segment covered.
12. How do I determine which pricing option suits my needs best?
The pricing options vary based on user requirements and access needs. Individual users may opt for single-user licenses, while businesses requiring broader access may choose multi-user or enterprise licenses for cost-effective access to the report.
13. Are there any additional resources or data provided in the Small Transparent Display Industry report?
While the report offers comprehensive insights, it's advisable to review the specific contents or supplementary materials provided to ascertain if additional resources or data are available.
14. How can I stay updated on further developments or reports in the Small Transparent Display Industry?
To stay informed about further developments, trends, and reports in the Small Transparent Display Industry, consider subscribing to industry newsletters, following relevant companies and organizations, or regularly checking reputable industry news sources and publications.
Methodology
Step 1 - Identification of Relevant Samples Size from Population Database


Step 2 - Approaches for Defining Global Market Size (Value, Volume* & Price*)

Note*: In applicable scenarios
Step 3 - Data Sources
Primary Research
- Web Analytics
- Survey Reports
- Research Institute
- Latest Research Reports
- Opinion Leaders
Secondary Research
- Annual Reports
- White Paper
- Latest Press Release
- Industry Association
- Paid Database
- Investor Presentations

Step 4 - Data Triangulation
Involves using different sources of information in order to increase the validity of a study
These sources are likely to be stakeholders in a program - participants, other researchers, program staff, other community members, and so on.
Then we put all data in single framework & apply various statistical tools to find out the dynamic on the market.
During the analysis stage, feedback from the stakeholder groups would be compared to determine areas of agreement as well as areas of divergence


