
Key Insights
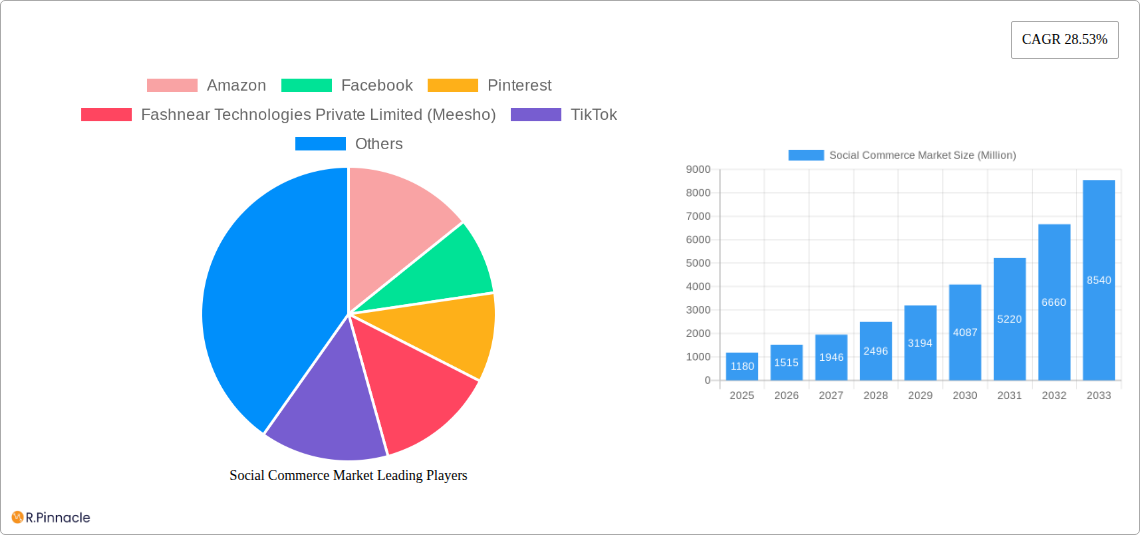
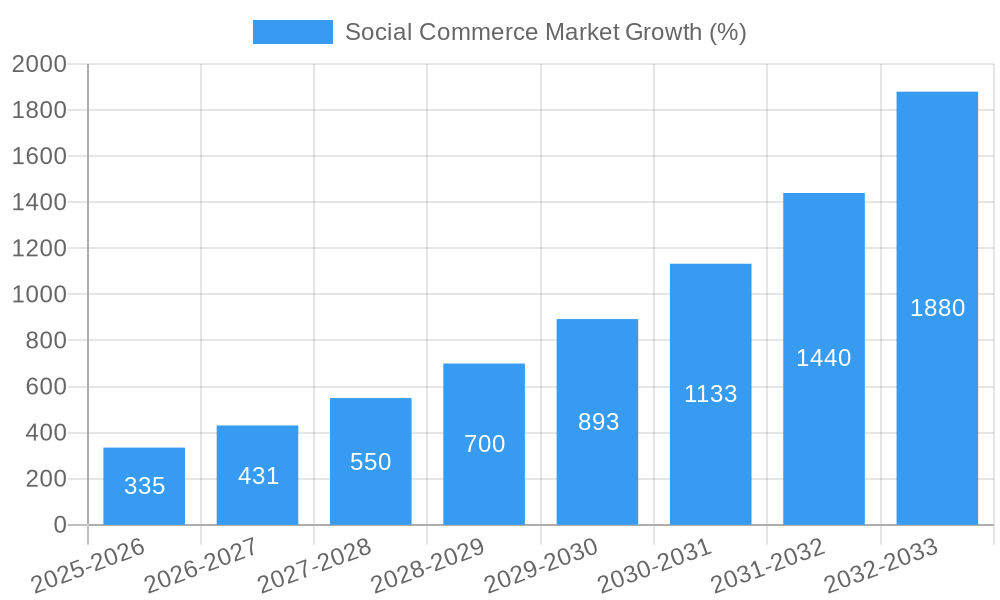
The social commerce market, valued at $1.18 billion in 2025, is experiencing explosive growth, projected to expand at a Compound Annual Growth Rate (CAGR) of 28.53% from 2025 to 2033. This surge is driven by several key factors. The increasing penetration of smartphones and social media platforms, coupled with the rising preference for online shopping, particularly among younger demographics, fuels the market's expansion. Consumers are increasingly drawn to the convenience, personalized experiences, and social proof offered by platforms like Instagram, Facebook, and TikTok, where product discovery and purchase seamlessly integrate into their daily social interactions. Furthermore, the emergence of innovative business models such as social reselling and influencer marketing significantly contributes to this growth. The market segmentation reveals a diverse landscape, with B2C dominating, followed by B2B and C2C models. Product categories like personal and beauty care, apparel, and accessories are leading the charge, indicating a strong preference for consumer goods within this sector. The dominance of video commerce and social network-led commerce further reinforces the market's dependence on engaging visual content and interactive shopping experiences.
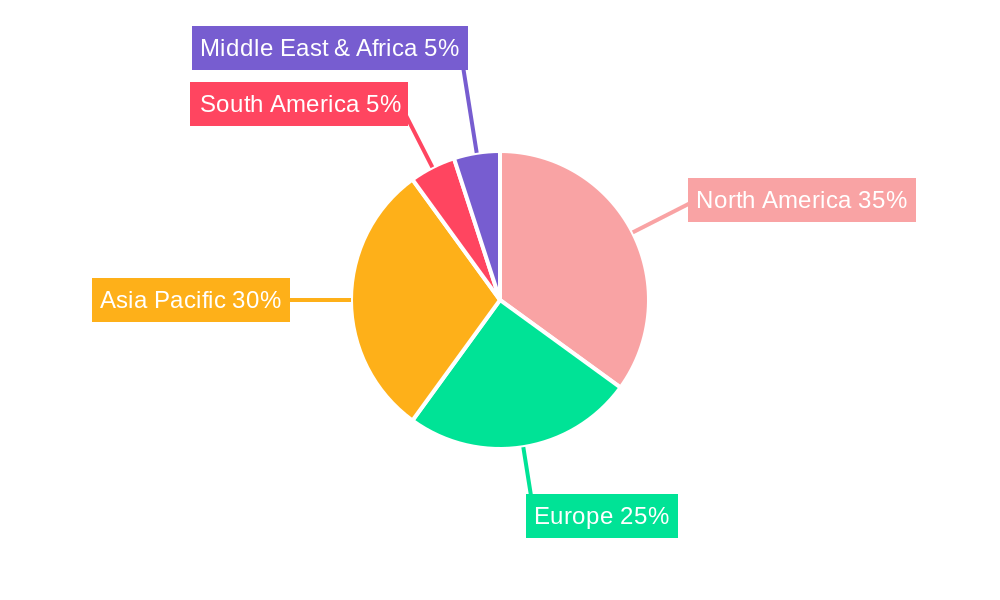
However, several challenges hinder the market's full potential. Concerns regarding data privacy and security remain significant, especially given the sensitive nature of personal information shared during transactions. Furthermore, the competitive landscape, dominated by established players like Amazon and emerging social media giants, necessitates continuous innovation and adaptation. Maintaining customer trust and addressing logistical complexities related to delivery and returns also pose significant hurdles. Geographical variations exist, with North America and Asia-Pacific expected to lead the market, followed by Europe. India and China, with their massive populations and burgeoning digital economies, are especially poised for significant growth within the social commerce sphere. Overcoming these challenges through robust security measures, streamlined logistics, and continued focus on user experience will determine the future trajectory of this dynamic market.
Social Commerce Market Report: 2019-2033
This comprehensive report provides an in-depth analysis of the Social Commerce Market, projecting robust growth from 2025 to 2033. Leveraging a wealth of data from 2019-2024, this study offers crucial insights for industry professionals, investors, and strategists seeking to navigate this rapidly evolving landscape. The report covers key players like Amazon, Facebook, Pinterest, Meesho, TikTok, Instagram, Twitter, YouTube, Roposo, and Verint, analyzing market segments by business model, product type, and sales channel. With a focus on actionable intelligence and precise market sizing, this report is your essential guide to understanding and capitalizing on the opportunities within the social commerce revolution. The report projects a market value of xx Million by 2033.
Social Commerce Market Structure & Innovation Trends
This section analyzes the competitive landscape, innovation drivers, regulatory environment, and market dynamics of the social commerce sector. The market is characterized by a high degree of concentration, with major players like Amazon and Facebook holding significant market share. However, emerging players such as Meesho are rapidly gaining traction, particularly in specific regional markets. Innovation is driven by advancements in artificial intelligence (AI), personalized recommendations, and the rise of short-form video content.
- Market Concentration: Amazon and Facebook collectively hold an estimated xx% market share in 2025, followed by Pinterest at xx%.
- Innovation Drivers: AI-powered personalization, live shopping features, shoppable content, influencer marketing, and augmented reality (AR)/virtual reality (VR) technologies.
- Regulatory Frameworks: Data privacy regulations (GDPR, CCPA) and evolving consumer protection laws significantly impact market operations.
- Product Substitutes: Traditional e-commerce platforms and physical retail remain key competitors.
- End-User Demographics: Millennials and Gen Z are the primary drivers of social commerce growth, showcasing a preference for convenient and engaging shopping experiences.
- M&A Activities: The past five years have seen significant M&A activity, with deal values exceeding xx Million in total. Notable examples include Amazon's partnerships with Meta and Pinterest.
Social Commerce Market Dynamics & Trends
The social commerce market exhibits substantial growth, driven by increasing smartphone penetration, rising social media usage, and evolving consumer preferences. Technological disruptions, such as the rise of short-form video platforms like TikTok and Instagram Reels, are reshaping the industry. The market's Compound Annual Growth Rate (CAGR) is projected at xx% during the forecast period (2025-2033), with market penetration expected to reach xx% by 2033. Competitive dynamics are characterized by intense rivalry among established players and the emergence of innovative startups. Consumer preferences are shifting towards personalized shopping experiences, seamless integration with social media, and enhanced product discovery.
Dominant Regions & Segments in Social Commerce Market
The North American region currently dominates the social commerce market, followed by Asia-Pacific. However, emerging markets in Asia and Latin America are experiencing rapid growth, driven by increasing internet penetration and smartphone adoption.
By Business Model: The B2C segment is currently the most dominant, however, the B2B segment is projected to witness the highest CAGR. C2C is steadily gaining traction, especially with the growth of social reselling platforms.
By Product Type: Apparel, accessories, and personal and beauty care products represent the largest market segments.
By Sales Channel: Video commerce is experiencing significant growth, followed by social network-led commerce and social reselling.
- Key Drivers (Regional): Strong digital infrastructure, high internet and smartphone penetration, favorable economic policies, and a culture of online shopping.
Social Commerce Market Product Innovations
Recent innovations in social commerce focus on enhancing the shopping experience through immersive technologies, personalized recommendations, and seamless integration with social media platforms. Key trends include live shopping, shoppable posts, augmented reality try-ons, and personalized product recommendations powered by AI and machine learning. These innovations aim to improve conversion rates and enhance customer engagement.
Report Scope & Segmentation Analysis
This report segments the social commerce market across three key dimensions: business model (B2C, B2B, C2C), product type (personal and beauty care, apparel, accessories, home products, health supplements, food and beverages, other), and sales channel (video commerce, social network-led commerce, social reselling, group buying, product review platforms). Each segment is analyzed in terms of its current market size, growth projections, and competitive dynamics. The B2C segment is expected to witness significant growth fueled by increasing consumer preference for convenient online shopping and the rising popularity of social media. The apparel and beauty product segment holds a substantial market share. Video commerce is expected to see exponential growth.
Key Drivers of Social Commerce Market Growth
Several factors contribute to the social commerce market's growth. Technological advancements, particularly in AI and mobile technologies, are improving the shopping experience and driving adoption. Increasing smartphone penetration, especially in developing economies, expands the market reach. Favorable economic conditions and rising disposable incomes in many regions further stimulate demand. The integration of social media into commerce provides a powerful marketing and sales channel.
Challenges in the Social Commerce Market Sector
The social commerce market faces several challenges, including concerns around data privacy and security. Maintaining brand trust and combating counterfeit products are crucial. Supply chain disruptions and logistics issues can affect the delivery of goods. Intense competition from established e-commerce players requires continuous innovation and adaptation. Regulatory hurdles and evolving compliance requirements add complexity.
Emerging Opportunities in Social Commerce Market
Significant opportunities exist for players focused on personalized shopping experiences, utilizing augmented reality (AR) and virtual reality (VR) for improved product visualization, incorporating immersive technologies like live shopping events, and catering to niche markets and specific demographics. Expansion into untapped geographic regions presents significant growth potential.
Leading Players in the Social Commerce Market Market
Key Developments in Social Commerce Market Industry
- November 2023: Amazon partnered with Meta to integrate Amazon's e-commerce platform with Meta's social media platforms, aiming to revolutionize the shopping experience.
- April 2023: Amazon and Pinterest partnered to deliver third-party ads on Pinterest, making every pin shoppable.
- December 2022: Amazon launched "Inspire," a short-form video and photo feed for shopping.
Future Outlook for Social Commerce Market Market
The social commerce market is poised for continued strong growth, driven by technological innovations, evolving consumer preferences, and the increasing integration of social media and e-commerce. Strategic partnerships, expansion into new markets, and the adoption of cutting-edge technologies will be crucial for success. The focus on personalized experiences, enhanced security, and seamless integration will shape the future of social commerce.
Social Commerce Market Segmentation
-
1. Business Model
- 1.1. Business to Consumer (B2C)
- 1.2. Business to Business (B2B)
- 1.3. Consumer to Consumer (C2C)
-
2. Product Type
- 2.1. Personal and Beauty Care
- 2.2. Apparel
- 2.3. Accessories
- 2.4. Home Products
- 2.5. Health Supplements
- 2.6. Food and Beverages
- 2.7. Other Product Types
-
3. Sales Channel
- 3.1. Video Commerce
- 3.2. Social Network-Led Commerce
- 3.3. Social Reselling
- 3.4. Group Buying
- 3.5. Product Review Platforms
Social Commerce Market Segmentation By Geography
-
1. North America
- 1.1. United States
- 1.2. Canada
- 1.3. Mexico
- 1.4. Rest of North America
-
2. Europe
- 2.1. United Kingdom
- 2.2. Germany
- 2.3. France
- 2.4. Russia
- 2.5. Italy
- 2.6. Spain
- 2.7. Rest of Europe
-
3. Asia Pacific
- 3.1. India
- 3.2. China
- 3.3. Japan
- 3.4. Australia
- 3.5. Rest of Asia Pacific
-
4. South America
- 4.1. Brazil
- 4.2. Argentina
- 4.3. Rest of South America
- 5. Middle East
-
6. United Arab Emirates
- 6.1. South Africa
- 6.2. Rest of Middle East
Social Commerce Market REPORT HIGHLIGHTS
| Aspects | Details |
|---|---|
| Study Period | 2019-2033 |
| Base Year | 2024 |
| Estimated Year | 2025 |
| Forecast Period | 2025-2033 |
| Historical Period | 2019-2024 |
| Growth Rate | CAGR of 28.53% from 2019-2033 |
| Segmentation |
|
Table of Contents
- 1. Introduction
- 1.1. Research Scope
- 1.2. Market Segmentation
- 1.3. Research Methodology
- 1.4. Definitions and Assumptions
- 2. Executive Summary
- 2.1. Introduction
- 3. Market Dynamics
- 3.1. Introduction
- 3.2. Market Drivers
- 3.2.1. Growing Number of Social Media Platforms; Shift in Consumer Preferences Toward Online Purchase
- 3.3. Market Restrains
- 3.3.1. Privacy Concerns Over Gathering and Using Personal Data; Intense Competition in the Social Commerce Space
- 3.4. Market Trends
- 3.4.1. Growing demand for business-to-consumer (B2C) social commerce is driving the market growth
- 4. Market Factor Analysis
- 4.1. Porters Five Forces
- 4.2. Supply/Value Chain
- 4.3. PESTEL analysis
- 4.4. Market Entropy
- 4.5. Patent/Trademark Analysis
- 5. Global Social Commerce Market Analysis, Insights and Forecast, 2019-2031
- 5.1. Market Analysis, Insights and Forecast - by Business Model
- 5.1.1. Business to Consumer (B2C)
- 5.1.2. Business to Business (B2B)
- 5.1.3. Consumer to Consumer (C2C)
- 5.2. Market Analysis, Insights and Forecast - by Product Type
- 5.2.1. Personal and Beauty Care
- 5.2.2. Apparel
- 5.2.3. Accessories
- 5.2.4. Home Products
- 5.2.5. Health Supplements
- 5.2.6. Food and Beverages
- 5.2.7. Other Product Types
- 5.3. Market Analysis, Insights and Forecast - by Sales Channel
- 5.3.1. Video Commerce
- 5.3.2. Social Network-Led Commerce
- 5.3.3. Social Reselling
- 5.3.4. Group Buying
- 5.3.5. Product Review Platforms
- 5.4. Market Analysis, Insights and Forecast - by Region
- 5.4.1. North America
- 5.4.2. Europe
- 5.4.3. Asia Pacific
- 5.4.4. South America
- 5.4.5. Middle East
- 5.4.6. United Arab Emirates
- 5.1. Market Analysis, Insights and Forecast - by Business Model
- 6. North America Social Commerce Market Analysis, Insights and Forecast, 2019-2031
- 6.1. Market Analysis, Insights and Forecast - by Business Model
- 6.1.1. Business to Consumer (B2C)
- 6.1.2. Business to Business (B2B)
- 6.1.3. Consumer to Consumer (C2C)
- 6.2. Market Analysis, Insights and Forecast - by Product Type
- 6.2.1. Personal and Beauty Care
- 6.2.2. Apparel
- 6.2.3. Accessories
- 6.2.4. Home Products
- 6.2.5. Health Supplements
- 6.2.6. Food and Beverages
- 6.2.7. Other Product Types
- 6.3. Market Analysis, Insights and Forecast - by Sales Channel
- 6.3.1. Video Commerce
- 6.3.2. Social Network-Led Commerce
- 6.3.3. Social Reselling
- 6.3.4. Group Buying
- 6.3.5. Product Review Platforms
- 6.1. Market Analysis, Insights and Forecast - by Business Model
- 7. Europe Social Commerce Market Analysis, Insights and Forecast, 2019-2031
- 7.1. Market Analysis, Insights and Forecast - by Business Model
- 7.1.1. Business to Consumer (B2C)
- 7.1.2. Business to Business (B2B)
- 7.1.3. Consumer to Consumer (C2C)
- 7.2. Market Analysis, Insights and Forecast - by Product Type
- 7.2.1. Personal and Beauty Care
- 7.2.2. Apparel
- 7.2.3. Accessories
- 7.2.4. Home Products
- 7.2.5. Health Supplements
- 7.2.6. Food and Beverages
- 7.2.7. Other Product Types
- 7.3. Market Analysis, Insights and Forecast - by Sales Channel
- 7.3.1. Video Commerce
- 7.3.2. Social Network-Led Commerce
- 7.3.3. Social Reselling
- 7.3.4. Group Buying
- 7.3.5. Product Review Platforms
- 7.1. Market Analysis, Insights and Forecast - by Business Model
- 8. Asia Pacific Social Commerce Market Analysis, Insights and Forecast, 2019-2031
- 8.1. Market Analysis, Insights and Forecast - by Business Model
- 8.1.1. Business to Consumer (B2C)
- 8.1.2. Business to Business (B2B)
- 8.1.3. Consumer to Consumer (C2C)
- 8.2. Market Analysis, Insights and Forecast - by Product Type
- 8.2.1. Personal and Beauty Care
- 8.2.2. Apparel
- 8.2.3. Accessories
- 8.2.4. Home Products
- 8.2.5. Health Supplements
- 8.2.6. Food and Beverages
- 8.2.7. Other Product Types
- 8.3. Market Analysis, Insights and Forecast - by Sales Channel
- 8.3.1. Video Commerce
- 8.3.2. Social Network-Led Commerce
- 8.3.3. Social Reselling
- 8.3.4. Group Buying
- 8.3.5. Product Review Platforms
- 8.1. Market Analysis, Insights and Forecast - by Business Model
- 9. South America Social Commerce Market Analysis, Insights and Forecast, 2019-2031
- 9.1. Market Analysis, Insights and Forecast - by Business Model
- 9.1.1. Business to Consumer (B2C)
- 9.1.2. Business to Business (B2B)
- 9.1.3. Consumer to Consumer (C2C)
- 9.2. Market Analysis, Insights and Forecast - by Product Type
- 9.2.1. Personal and Beauty Care
- 9.2.2. Apparel
- 9.2.3. Accessories
- 9.2.4. Home Products
- 9.2.5. Health Supplements
- 9.2.6. Food and Beverages
- 9.2.7. Other Product Types
- 9.3. Market Analysis, Insights and Forecast - by Sales Channel
- 9.3.1. Video Commerce
- 9.3.2. Social Network-Led Commerce
- 9.3.3. Social Reselling
- 9.3.4. Group Buying
- 9.3.5. Product Review Platforms
- 9.1. Market Analysis, Insights and Forecast - by Business Model
- 10. Middle East Social Commerce Market Analysis, Insights and Forecast, 2019-2031
- 10.1. Market Analysis, Insights and Forecast - by Business Model
- 10.1.1. Business to Consumer (B2C)
- 10.1.2. Business to Business (B2B)
- 10.1.3. Consumer to Consumer (C2C)
- 10.2. Market Analysis, Insights and Forecast - by Product Type
- 10.2.1. Personal and Beauty Care
- 10.2.2. Apparel
- 10.2.3. Accessories
- 10.2.4. Home Products
- 10.2.5. Health Supplements
- 10.2.6. Food and Beverages
- 10.2.7. Other Product Types
- 10.3. Market Analysis, Insights and Forecast - by Sales Channel
- 10.3.1. Video Commerce
- 10.3.2. Social Network-Led Commerce
- 10.3.3. Social Reselling
- 10.3.4. Group Buying
- 10.3.5. Product Review Platforms
- 10.1. Market Analysis, Insights and Forecast - by Business Model
- 11. United Arab Emirates Social Commerce Market Analysis, Insights and Forecast, 2019-2031
- 11.1. Market Analysis, Insights and Forecast - by Business Model
- 11.1.1. Business to Consumer (B2C)
- 11.1.2. Business to Business (B2B)
- 11.1.3. Consumer to Consumer (C2C)
- 11.2. Market Analysis, Insights and Forecast - by Product Type
- 11.2.1. Personal and Beauty Care
- 11.2.2. Apparel
- 11.2.3. Accessories
- 11.2.4. Home Products
- 11.2.5. Health Supplements
- 11.2.6. Food and Beverages
- 11.2.7. Other Product Types
- 11.3. Market Analysis, Insights and Forecast - by Sales Channel
- 11.3.1. Video Commerce
- 11.3.2. Social Network-Led Commerce
- 11.3.3. Social Reselling
- 11.3.4. Group Buying
- 11.3.5. Product Review Platforms
- 11.1. Market Analysis, Insights and Forecast - by Business Model
- 12. North America Social Commerce Market Analysis, Insights and Forecast, 2019-2031
- 12.1. Market Analysis, Insights and Forecast - By Country/Sub-region
- 12.1.1 United States
- 12.1.2 Canada
- 12.1.3 Mexico
- 12.1.4 Rest of North America
- 13. Europe Social Commerce Market Analysis, Insights and Forecast, 2019-2031
- 13.1. Market Analysis, Insights and Forecast - By Country/Sub-region
- 13.1.1 United Kingdom
- 13.1.2 Germany
- 13.1.3 France
- 13.1.4 Russia
- 13.1.5 Italy
- 13.1.6 Spain
- 13.1.7 Rest of Europe
- 14. Asia Pacific Social Commerce Market Analysis, Insights and Forecast, 2019-2031
- 14.1. Market Analysis, Insights and Forecast - By Country/Sub-region
- 14.1.1 India
- 14.1.2 China
- 14.1.3 Japan
- 14.1.4 Australia
- 14.1.5 Rest of Asia Pacific
- 15. South America Social Commerce Market Analysis, Insights and Forecast, 2019-2031
- 15.1. Market Analysis, Insights and Forecast - By Country/Sub-region
- 15.1.1 Brazil
- 15.1.2 Argentina
- 15.1.3 Rest of South America
- 16. Middle East Social Commerce Market Analysis, Insights and Forecast, 2019-2031
- 16.1. Market Analysis, Insights and Forecast - By Country/Sub-region
- 16.1.1.
- 17. United Arab Emirates Social Commerce Market Analysis, Insights and Forecast, 2019-2031
- 17.1. Market Analysis, Insights and Forecast - By Country/Sub-region
- 17.1.1 South Africa
- 17.1.2 Rest of Middle East
- 18. Competitive Analysis
- 18.1. Global Market Share Analysis 2024
- 18.2. Company Profiles
- 18.2.1 Amazon
- 18.2.1.1. Overview
- 18.2.1.2. Products
- 18.2.1.3. SWOT Analysis
- 18.2.1.4. Recent Developments
- 18.2.1.5. Financials (Based on Availability)
- 18.2.2 Facebook
- 18.2.2.1. Overview
- 18.2.2.2. Products
- 18.2.2.3. SWOT Analysis
- 18.2.2.4. Recent Developments
- 18.2.2.5. Financials (Based on Availability)
- 18.2.3 Pinterest
- 18.2.3.1. Overview
- 18.2.3.2. Products
- 18.2.3.3. SWOT Analysis
- 18.2.3.4. Recent Developments
- 18.2.3.5. Financials (Based on Availability)
- 18.2.4 Fashnear Technologies Private Limited (Meesho)
- 18.2.4.1. Overview
- 18.2.4.2. Products
- 18.2.4.3. SWOT Analysis
- 18.2.4.4. Recent Developments
- 18.2.4.5. Financials (Based on Availability)
- 18.2.5 TikTok
- 18.2.5.1. Overview
- 18.2.5.2. Products
- 18.2.5.3. SWOT Analysis
- 18.2.5.4. Recent Developments
- 18.2.5.5. Financials (Based on Availability)
- 18.2.6 Instagram
- 18.2.6.1. Overview
- 18.2.6.2. Products
- 18.2.6.3. SWOT Analysis
- 18.2.6.4. Recent Developments
- 18.2.6.5. Financials (Based on Availability)
- 18.2.7 Twitter**List Not Exhaustive
- 18.2.7.1. Overview
- 18.2.7.2. Products
- 18.2.7.3. SWOT Analysis
- 18.2.7.4. Recent Developments
- 18.2.7.5. Financials (Based on Availability)
- 18.2.8 YouTube
- 18.2.8.1. Overview
- 18.2.8.2. Products
- 18.2.8.3. SWOT Analysis
- 18.2.8.4. Recent Developments
- 18.2.8.5. Financials (Based on Availability)
- 18.2.9 Roposo
- 18.2.9.1. Overview
- 18.2.9.2. Products
- 18.2.9.3. SWOT Analysis
- 18.2.9.4. Recent Developments
- 18.2.9.5. Financials (Based on Availability)
- 18.2.10 Verint
- 18.2.10.1. Overview
- 18.2.10.2. Products
- 18.2.10.3. SWOT Analysis
- 18.2.10.4. Recent Developments
- 18.2.10.5. Financials (Based on Availability)
- 18.2.1 Amazon
List of Figures
- Figure 1: Global Social Commerce Market Revenue Breakdown (Million, %) by Region 2024 & 2032
- Figure 2: North America Social Commerce Market Revenue (Million), by Country 2024 & 2032
- Figure 3: North America Social Commerce Market Revenue Share (%), by Country 2024 & 2032
- Figure 4: Europe Social Commerce Market Revenue (Million), by Country 2024 & 2032
- Figure 5: Europe Social Commerce Market Revenue Share (%), by Country 2024 & 2032
- Figure 6: Asia Pacific Social Commerce Market Revenue (Million), by Country 2024 & 2032
- Figure 7: Asia Pacific Social Commerce Market Revenue Share (%), by Country 2024 & 2032
- Figure 8: South America Social Commerce Market Revenue (Million), by Country 2024 & 2032
- Figure 9: South America Social Commerce Market Revenue Share (%), by Country 2024 & 2032
- Figure 10: Middle East Social Commerce Market Revenue (Million), by Country 2024 & 2032
- Figure 11: Middle East Social Commerce Market Revenue Share (%), by Country 2024 & 2032
- Figure 12: United Arab Emirates Social Commerce Market Revenue (Million), by Country 2024 & 2032
- Figure 13: United Arab Emirates Social Commerce Market Revenue Share (%), by Country 2024 & 2032
- Figure 14: North America Social Commerce Market Revenue (Million), by Business Model 2024 & 2032
- Figure 15: North America Social Commerce Market Revenue Share (%), by Business Model 2024 & 2032
- Figure 16: North America Social Commerce Market Revenue (Million), by Product Type 2024 & 2032
- Figure 17: North America Social Commerce Market Revenue Share (%), by Product Type 2024 & 2032
- Figure 18: North America Social Commerce Market Revenue (Million), by Sales Channel 2024 & 2032
- Figure 19: North America Social Commerce Market Revenue Share (%), by Sales Channel 2024 & 2032
- Figure 20: North America Social Commerce Market Revenue (Million), by Country 2024 & 2032
- Figure 21: North America Social Commerce Market Revenue Share (%), by Country 2024 & 2032
- Figure 22: Europe Social Commerce Market Revenue (Million), by Business Model 2024 & 2032
- Figure 23: Europe Social Commerce Market Revenue Share (%), by Business Model 2024 & 2032
- Figure 24: Europe Social Commerce Market Revenue (Million), by Product Type 2024 & 2032
- Figure 25: Europe Social Commerce Market Revenue Share (%), by Product Type 2024 & 2032
- Figure 26: Europe Social Commerce Market Revenue (Million), by Sales Channel 2024 & 2032
- Figure 27: Europe Social Commerce Market Revenue Share (%), by Sales Channel 2024 & 2032
- Figure 28: Europe Social Commerce Market Revenue (Million), by Country 2024 & 2032
- Figure 29: Europe Social Commerce Market Revenue Share (%), by Country 2024 & 2032
- Figure 30: Asia Pacific Social Commerce Market Revenue (Million), by Business Model 2024 & 2032
- Figure 31: Asia Pacific Social Commerce Market Revenue Share (%), by Business Model 2024 & 2032
- Figure 32: Asia Pacific Social Commerce Market Revenue (Million), by Product Type 2024 & 2032
- Figure 33: Asia Pacific Social Commerce Market Revenue Share (%), by Product Type 2024 & 2032
- Figure 34: Asia Pacific Social Commerce Market Revenue (Million), by Sales Channel 2024 & 2032
- Figure 35: Asia Pacific Social Commerce Market Revenue Share (%), by Sales Channel 2024 & 2032
- Figure 36: Asia Pacific Social Commerce Market Revenue (Million), by Country 2024 & 2032
- Figure 37: Asia Pacific Social Commerce Market Revenue Share (%), by Country 2024 & 2032
- Figure 38: South America Social Commerce Market Revenue (Million), by Business Model 2024 & 2032
- Figure 39: South America Social Commerce Market Revenue Share (%), by Business Model 2024 & 2032
- Figure 40: South America Social Commerce Market Revenue (Million), by Product Type 2024 & 2032
- Figure 41: South America Social Commerce Market Revenue Share (%), by Product Type 2024 & 2032
- Figure 42: South America Social Commerce Market Revenue (Million), by Sales Channel 2024 & 2032
- Figure 43: South America Social Commerce Market Revenue Share (%), by Sales Channel 2024 & 2032
- Figure 44: South America Social Commerce Market Revenue (Million), by Country 2024 & 2032
- Figure 45: South America Social Commerce Market Revenue Share (%), by Country 2024 & 2032
- Figure 46: Middle East Social Commerce Market Revenue (Million), by Business Model 2024 & 2032
- Figure 47: Middle East Social Commerce Market Revenue Share (%), by Business Model 2024 & 2032
- Figure 48: Middle East Social Commerce Market Revenue (Million), by Product Type 2024 & 2032
- Figure 49: Middle East Social Commerce Market Revenue Share (%), by Product Type 2024 & 2032
- Figure 50: Middle East Social Commerce Market Revenue (Million), by Sales Channel 2024 & 2032
- Figure 51: Middle East Social Commerce Market Revenue Share (%), by Sales Channel 2024 & 2032
- Figure 52: Middle East Social Commerce Market Revenue (Million), by Country 2024 & 2032
- Figure 53: Middle East Social Commerce Market Revenue Share (%), by Country 2024 & 2032
- Figure 54: United Arab Emirates Social Commerce Market Revenue (Million), by Business Model 2024 & 2032
- Figure 55: United Arab Emirates Social Commerce Market Revenue Share (%), by Business Model 2024 & 2032
- Figure 56: United Arab Emirates Social Commerce Market Revenue (Million), by Product Type 2024 & 2032
- Figure 57: United Arab Emirates Social Commerce Market Revenue Share (%), by Product Type 2024 & 2032
- Figure 58: United Arab Emirates Social Commerce Market Revenue (Million), by Sales Channel 2024 & 2032
- Figure 59: United Arab Emirates Social Commerce Market Revenue Share (%), by Sales Channel 2024 & 2032
- Figure 60: United Arab Emirates Social Commerce Market Revenue (Million), by Country 2024 & 2032
- Figure 61: United Arab Emirates Social Commerce Market Revenue Share (%), by Country 2024 & 2032
List of Tables
- Table 1: Global Social Commerce Market Revenue Million Forecast, by Region 2019 & 2032
- Table 2: Global Social Commerce Market Revenue Million Forecast, by Business Model 2019 & 2032
- Table 3: Global Social Commerce Market Revenue Million Forecast, by Product Type 2019 & 2032
- Table 4: Global Social Commerce Market Revenue Million Forecast, by Sales Channel 2019 & 2032
- Table 5: Global Social Commerce Market Revenue Million Forecast, by Region 2019 & 2032
- Table 6: Global Social Commerce Market Revenue Million Forecast, by Country 2019 & 2032
- Table 7: United States Social Commerce Market Revenue (Million) Forecast, by Application 2019 & 2032
- Table 8: Canada Social Commerce Market Revenue (Million) Forecast, by Application 2019 & 2032
- Table 9: Mexico Social Commerce Market Revenue (Million) Forecast, by Application 2019 & 2032
- Table 10: Rest of North America Social Commerce Market Revenue (Million) Forecast, by Application 2019 & 2032
- Table 11: Global Social Commerce Market Revenue Million Forecast, by Country 2019 & 2032
- Table 12: United Kingdom Social Commerce Market Revenue (Million) Forecast, by Application 2019 & 2032
- Table 13: Germany Social Commerce Market Revenue (Million) Forecast, by Application 2019 & 2032
- Table 14: France Social Commerce Market Revenue (Million) Forecast, by Application 2019 & 2032
- Table 15: Russia Social Commerce Market Revenue (Million) Forecast, by Application 2019 & 2032
- Table 16: Italy Social Commerce Market Revenue (Million) Forecast, by Application 2019 & 2032
- Table 17: Spain Social Commerce Market Revenue (Million) Forecast, by Application 2019 & 2032
- Table 18: Rest of Europe Social Commerce Market Revenue (Million) Forecast, by Application 2019 & 2032
- Table 19: Global Social Commerce Market Revenue Million Forecast, by Country 2019 & 2032
- Table 20: India Social Commerce Market Revenue (Million) Forecast, by Application 2019 & 2032
- Table 21: China Social Commerce Market Revenue (Million) Forecast, by Application 2019 & 2032
- Table 22: Japan Social Commerce Market Revenue (Million) Forecast, by Application 2019 & 2032
- Table 23: Australia Social Commerce Market Revenue (Million) Forecast, by Application 2019 & 2032
- Table 24: Rest of Asia Pacific Social Commerce Market Revenue (Million) Forecast, by Application 2019 & 2032
- Table 25: Global Social Commerce Market Revenue Million Forecast, by Country 2019 & 2032
- Table 26: Brazil Social Commerce Market Revenue (Million) Forecast, by Application 2019 & 2032
- Table 27: Argentina Social Commerce Market Revenue (Million) Forecast, by Application 2019 & 2032
- Table 28: Rest of South America Social Commerce Market Revenue (Million) Forecast, by Application 2019 & 2032
- Table 29: Global Social Commerce Market Revenue Million Forecast, by Country 2019 & 2032
- Table 30: Social Commerce Market Revenue (Million) Forecast, by Application 2019 & 2032
- Table 31: Global Social Commerce Market Revenue Million Forecast, by Country 2019 & 2032
- Table 32: South Africa Social Commerce Market Revenue (Million) Forecast, by Application 2019 & 2032
- Table 33: Rest of Middle East Social Commerce Market Revenue (Million) Forecast, by Application 2019 & 2032
- Table 34: Global Social Commerce Market Revenue Million Forecast, by Business Model 2019 & 2032
- Table 35: Global Social Commerce Market Revenue Million Forecast, by Product Type 2019 & 2032
- Table 36: Global Social Commerce Market Revenue Million Forecast, by Sales Channel 2019 & 2032
- Table 37: Global Social Commerce Market Revenue Million Forecast, by Country 2019 & 2032
- Table 38: United States Social Commerce Market Revenue (Million) Forecast, by Application 2019 & 2032
- Table 39: Canada Social Commerce Market Revenue (Million) Forecast, by Application 2019 & 2032
- Table 40: Mexico Social Commerce Market Revenue (Million) Forecast, by Application 2019 & 2032
- Table 41: Rest of North America Social Commerce Market Revenue (Million) Forecast, by Application 2019 & 2032
- Table 42: Global Social Commerce Market Revenue Million Forecast, by Business Model 2019 & 2032
- Table 43: Global Social Commerce Market Revenue Million Forecast, by Product Type 2019 & 2032
- Table 44: Global Social Commerce Market Revenue Million Forecast, by Sales Channel 2019 & 2032
- Table 45: Global Social Commerce Market Revenue Million Forecast, by Country 2019 & 2032
- Table 46: United Kingdom Social Commerce Market Revenue (Million) Forecast, by Application 2019 & 2032
- Table 47: Germany Social Commerce Market Revenue (Million) Forecast, by Application 2019 & 2032
- Table 48: France Social Commerce Market Revenue (Million) Forecast, by Application 2019 & 2032
- Table 49: Russia Social Commerce Market Revenue (Million) Forecast, by Application 2019 & 2032
- Table 50: Italy Social Commerce Market Revenue (Million) Forecast, by Application 2019 & 2032
- Table 51: Spain Social Commerce Market Revenue (Million) Forecast, by Application 2019 & 2032
- Table 52: Rest of Europe Social Commerce Market Revenue (Million) Forecast, by Application 2019 & 2032
- Table 53: Global Social Commerce Market Revenue Million Forecast, by Business Model 2019 & 2032
- Table 54: Global Social Commerce Market Revenue Million Forecast, by Product Type 2019 & 2032
- Table 55: Global Social Commerce Market Revenue Million Forecast, by Sales Channel 2019 & 2032
- Table 56: Global Social Commerce Market Revenue Million Forecast, by Country 2019 & 2032
- Table 57: India Social Commerce Market Revenue (Million) Forecast, by Application 2019 & 2032
- Table 58: China Social Commerce Market Revenue (Million) Forecast, by Application 2019 & 2032
- Table 59: Japan Social Commerce Market Revenue (Million) Forecast, by Application 2019 & 2032
- Table 60: Australia Social Commerce Market Revenue (Million) Forecast, by Application 2019 & 2032
- Table 61: Rest of Asia Pacific Social Commerce Market Revenue (Million) Forecast, by Application 2019 & 2032
- Table 62: Global Social Commerce Market Revenue Million Forecast, by Business Model 2019 & 2032
- Table 63: Global Social Commerce Market Revenue Million Forecast, by Product Type 2019 & 2032
- Table 64: Global Social Commerce Market Revenue Million Forecast, by Sales Channel 2019 & 2032
- Table 65: Global Social Commerce Market Revenue Million Forecast, by Country 2019 & 2032
- Table 66: Brazil Social Commerce Market Revenue (Million) Forecast, by Application 2019 & 2032
- Table 67: Argentina Social Commerce Market Revenue (Million) Forecast, by Application 2019 & 2032
- Table 68: Rest of South America Social Commerce Market Revenue (Million) Forecast, by Application 2019 & 2032
- Table 69: Global Social Commerce Market Revenue Million Forecast, by Business Model 2019 & 2032
- Table 70: Global Social Commerce Market Revenue Million Forecast, by Product Type 2019 & 2032
- Table 71: Global Social Commerce Market Revenue Million Forecast, by Sales Channel 2019 & 2032
- Table 72: Global Social Commerce Market Revenue Million Forecast, by Country 2019 & 2032
- Table 73: Global Social Commerce Market Revenue Million Forecast, by Business Model 2019 & 2032
- Table 74: Global Social Commerce Market Revenue Million Forecast, by Product Type 2019 & 2032
- Table 75: Global Social Commerce Market Revenue Million Forecast, by Sales Channel 2019 & 2032
- Table 76: Global Social Commerce Market Revenue Million Forecast, by Country 2019 & 2032
- Table 77: South Africa Social Commerce Market Revenue (Million) Forecast, by Application 2019 & 2032
- Table 78: Rest of Middle East Social Commerce Market Revenue (Million) Forecast, by Application 2019 & 2032
Frequently Asked Questions
1. What is the projected Compound Annual Growth Rate (CAGR) of the Social Commerce Market?
The projected CAGR is approximately 28.53%.
2. Which companies are prominent players in the Social Commerce Market?
Key companies in the market include Amazon, Facebook, Pinterest, Fashnear Technologies Private Limited (Meesho), TikTok, Instagram, Twitter**List Not Exhaustive, YouTube, Roposo, Verint.
3. What are the main segments of the Social Commerce Market?
The market segments include Business Model, Product Type, Sales Channel.
4. Can you provide details about the market size?
The market size is estimated to be USD 1.18 Million as of 2022.
5. What are some drivers contributing to market growth?
Growing Number of Social Media Platforms; Shift in Consumer Preferences Toward Online Purchase.
6. What are the notable trends driving market growth?
Growing demand for business-to-consumer (B2C) social commerce is driving the market growth.
7. Are there any restraints impacting market growth?
Privacy Concerns Over Gathering and Using Personal Data; Intense Competition in the Social Commerce Space.
8. Can you provide examples of recent developments in the market?
November 2023: Amazon announced a partnership with Meta (Facebook’s parent company) to revolutionize social commerce. This collaboration aims to integrate Amazon’s e-commerce platform with Meta’s social media platform, providing shoppers with a seamless purchase experience and opening new opportunities for targeted advertising.
9. What pricing options are available for accessing the report?
Pricing options include single-user, multi-user, and enterprise licenses priced at USD 4750, USD 5250, and USD 8750 respectively.
10. Is the market size provided in terms of value or volume?
The market size is provided in terms of value, measured in Million.
11. Are there any specific market keywords associated with the report?
Yes, the market keyword associated with the report is "Social Commerce Market," which aids in identifying and referencing the specific market segment covered.
12. How do I determine which pricing option suits my needs best?
The pricing options vary based on user requirements and access needs. Individual users may opt for single-user licenses, while businesses requiring broader access may choose multi-user or enterprise licenses for cost-effective access to the report.
13. Are there any additional resources or data provided in the Social Commerce Market report?
While the report offers comprehensive insights, it's advisable to review the specific contents or supplementary materials provided to ascertain if additional resources or data are available.
14. How can I stay updated on further developments or reports in the Social Commerce Market?
To stay informed about further developments, trends, and reports in the Social Commerce Market, consider subscribing to industry newsletters, following relevant companies and organizations, or regularly checking reputable industry news sources and publications.
Methodology
Step 1 - Identification of Relevant Samples Size from Population Database


Step 2 - Approaches for Defining Global Market Size (Value, Volume* & Price*)

Note*: In applicable scenarios
Step 3 - Data Sources
Primary Research
- Web Analytics
- Survey Reports
- Research Institute
- Latest Research Reports
- Opinion Leaders
Secondary Research
- Annual Reports
- White Paper
- Latest Press Release
- Industry Association
- Paid Database
- Investor Presentations

Step 4 - Data Triangulation
Involves using different sources of information in order to increase the validity of a study
These sources are likely to be stakeholders in a program - participants, other researchers, program staff, other community members, and so on.
Then we put all data in single framework & apply various statistical tools to find out the dynamic on the market.
During the analysis stage, feedback from the stakeholder groups would be compared to determine areas of agreement as well as areas of divergence


