
Key Insights
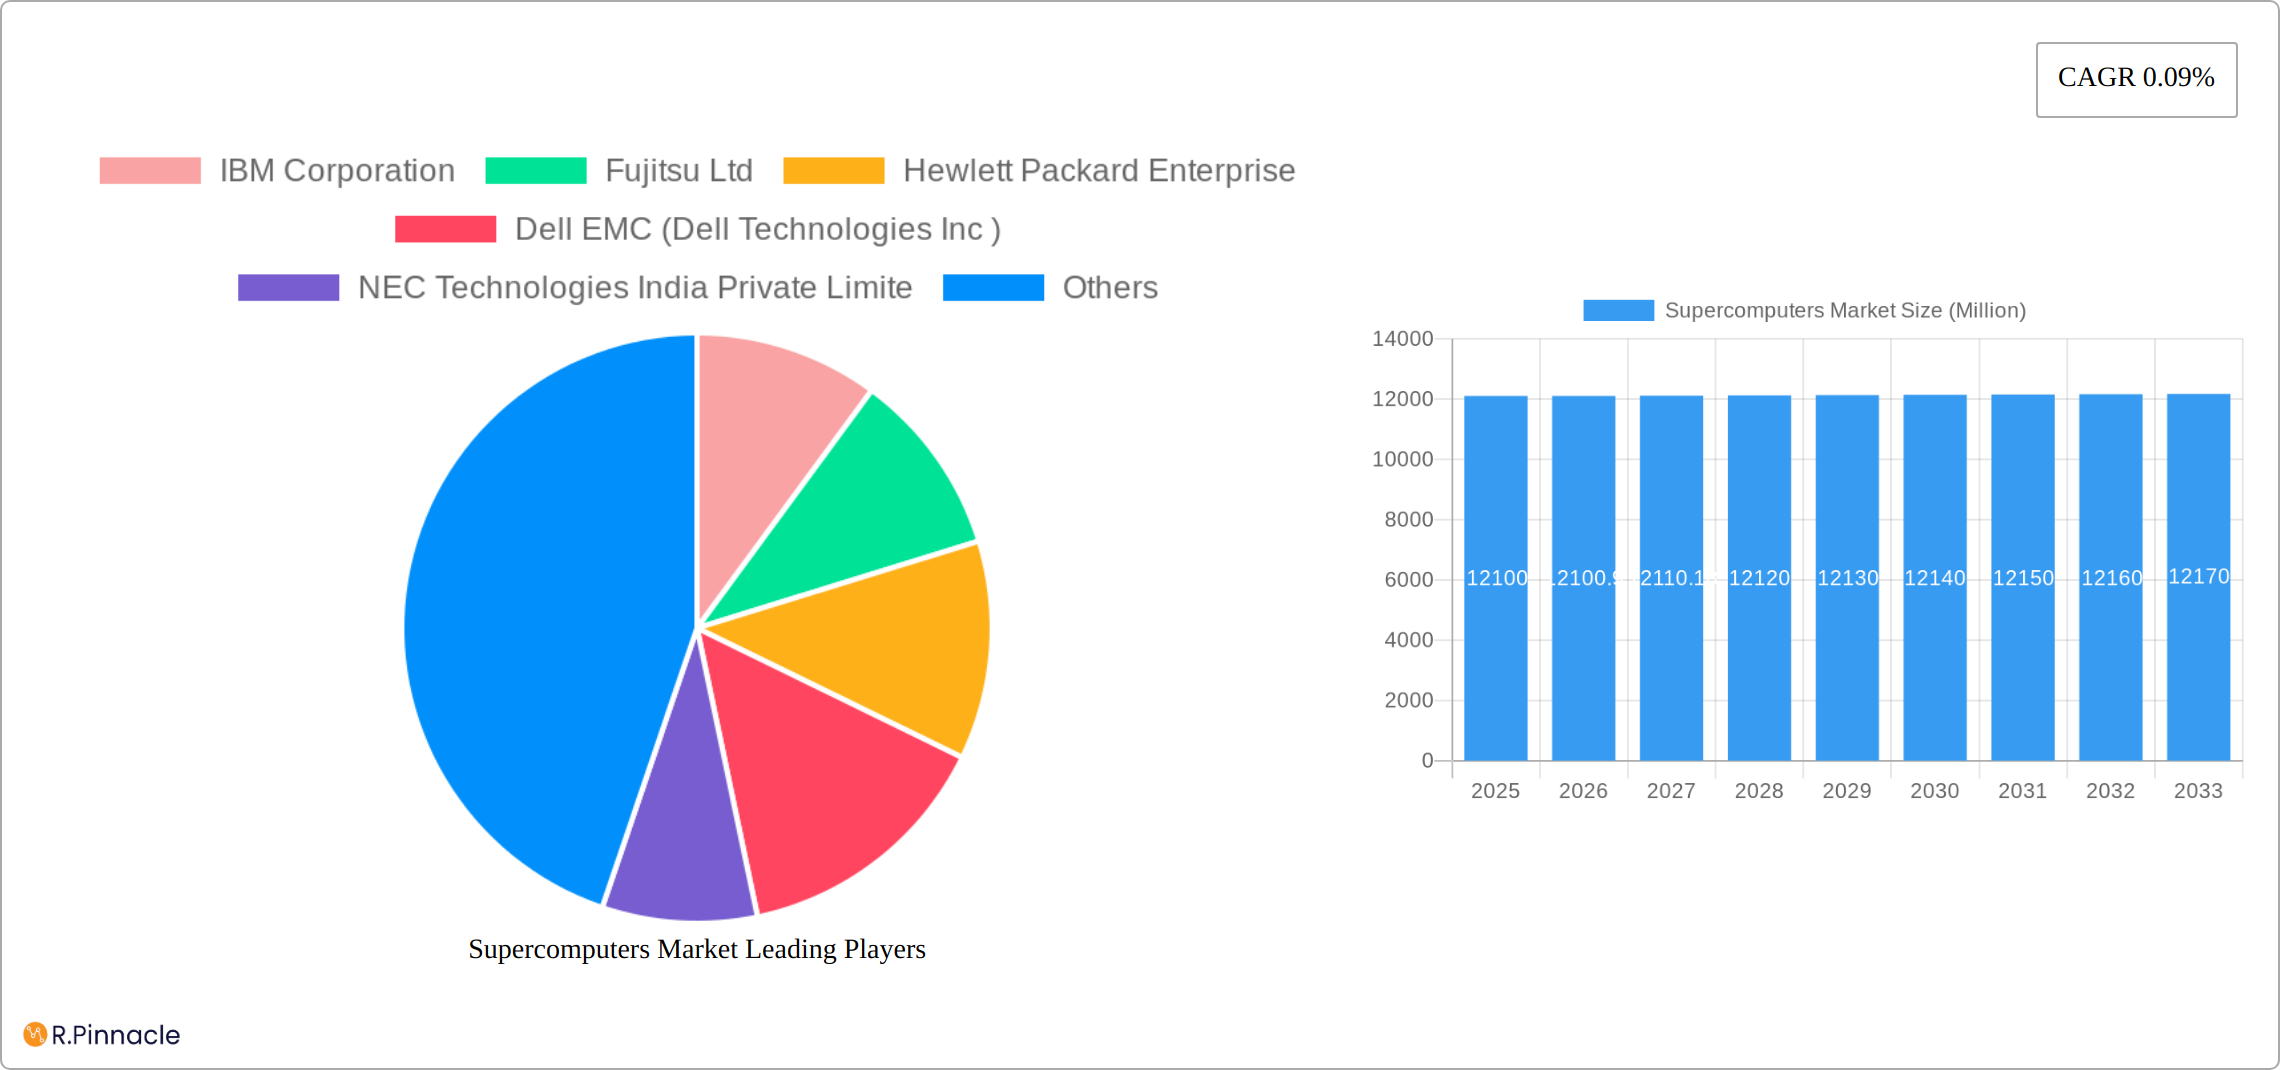
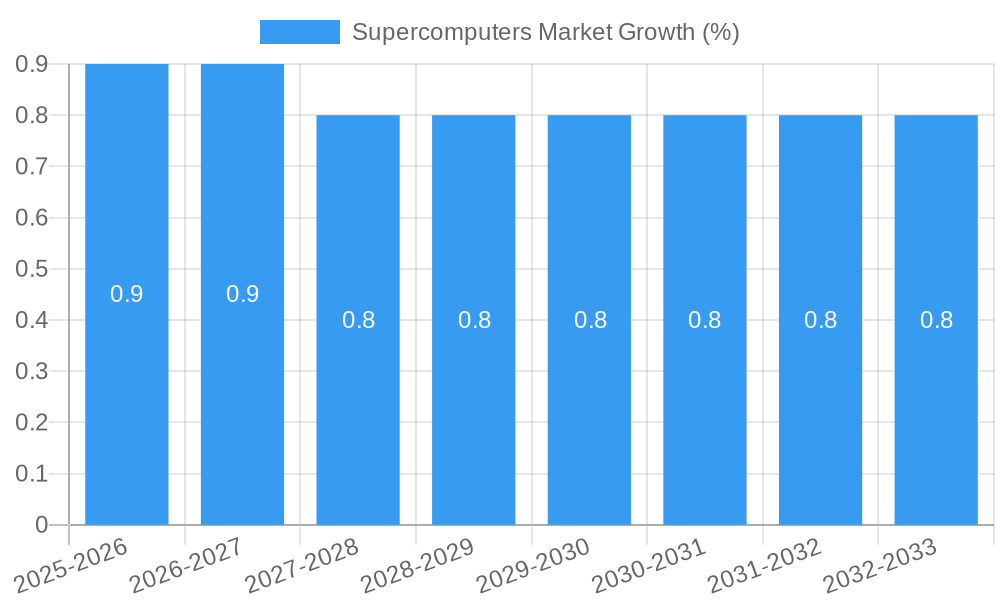
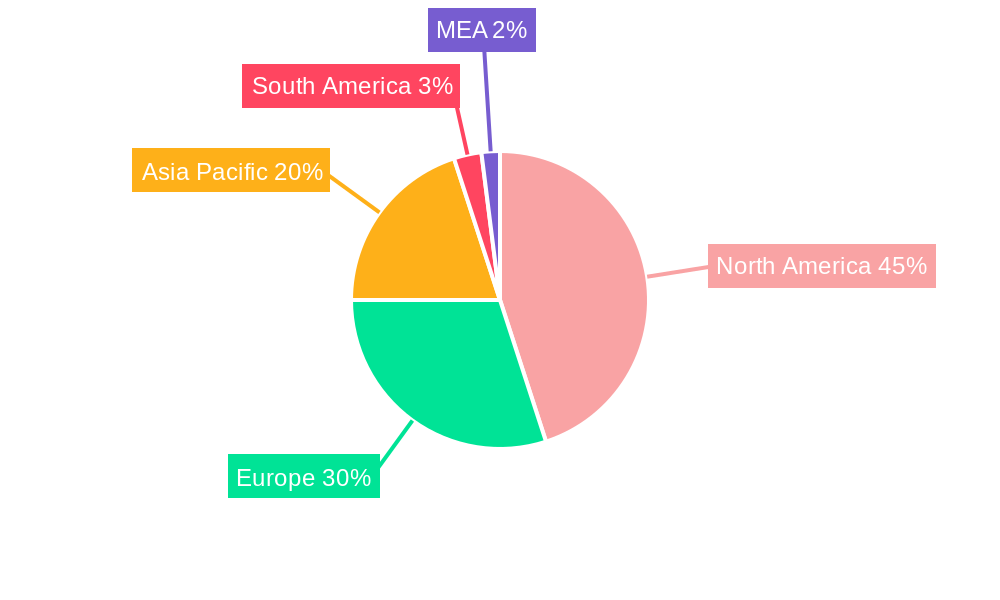
The supercomputer market, valued at $12.10 billion in 2025, is projected to experience modest growth, exhibiting a Compound Annual Growth Rate (CAGR) of 0.09% from 2025 to 2033. This relatively low CAGR suggests a mature market, though significant advancements in processing power and applications are driving sector evolution. Key drivers include the increasing demand for high-performance computing (HPC) in diverse sectors such as commercial industries (e.g., financial modeling, drug discovery), government entities (e.g., national security, weather forecasting), and research institutions (e.g., genomics, climate modeling). Emerging trends like AI and machine learning are fueling demand for more powerful supercomputers capable of handling complex algorithms and massive datasets. However, high initial investment costs and the specialized skills required for operation and maintenance pose significant restraints to market expansion, particularly in smaller organizations and developing economies. The market is segmented by end-user, with commercial industries currently dominating, followed by government entities and research institutions. Leading players such as IBM, Fujitsu, Hewlett Packard Enterprise, and Dell Technologies are vying for market share through continuous innovation and strategic partnerships. Geographic distribution sees North America and Europe as currently dominant regions, but the Asia-Pacific region is poised for growth driven by increased R&D investment and government initiatives in countries like China and India.
The forecast period (2025-2033) anticipates a gradual increase in market size, driven by ongoing technological advancements and adoption across key sectors. However, the relatively low CAGR suggests that growth will be incremental rather than explosive. Competition among established players is likely to intensify, with a focus on developing energy-efficient solutions and offering comprehensive support services. The future of the supercomputer market hinges on continued technological innovation in areas such as quantum computing and exascale processing, as well as the ability of industry players to make these technologies more accessible and affordable to a wider range of users. Expansion into emerging markets and the growing demand for cloud-based HPC solutions are expected to create new growth avenues in the coming years.
Supercomputers Market Report: 2019-2033 Forecast
This comprehensive report provides an in-depth analysis of the global supercomputers market, offering invaluable insights for industry professionals, investors, and strategic decision-makers. Covering the period 2019-2033, with a base year of 2025 and a forecast period of 2025-2033, this report leverages rigorous research methodologies to deliver actionable intelligence on market size, growth drivers, challenges, and emerging opportunities. The estimated market size in 2025 is valued at xx Million.
Supercomputers Market Structure & Innovation Trends
The supercomputers market exhibits a moderately concentrated structure, with key players like IBM Corporation, Fujitsu Ltd, Hewlett Packard Enterprise, Dell EMC (Dell Technologies Inc.), NEC Technologies India Private Limited, Atos SE, Lenovo Inc., and Intel Corporation holding significant market share. However, the market is witnessing increasing competition from emerging players and niche providers. Innovation is driven by advancements in processing technologies (e.g., exascale computing, quantum computing), improved interconnectivity (high-speed networking), and enhanced software capabilities (AI/ML integration). Regulatory frameworks, including data privacy regulations and government funding initiatives, significantly influence market dynamics. Product substitutes, such as cloud-based high-performance computing, pose a competitive challenge. M&A activity has been moderate, with deal values averaging xx Million in recent years, primarily focused on consolidating capabilities and expanding market reach.
- Market Concentration: Moderately concentrated, with top players holding xx% market share.
- Innovation Drivers: Exascale computing, quantum computing, advanced networking, AI/ML integration.
- Regulatory Impact: Data privacy regulations, government funding programs.
- M&A Activity: Average deal value: xx Million, focusing on capability expansion.
Supercomputers Market Dynamics & Trends
The supercomputers market is experiencing robust growth, driven by increasing demand from various sectors. The Compound Annual Growth Rate (CAGR) for the forecast period (2025-2033) is projected to be xx%. Key growth drivers include the rising need for high-performance computing in scientific research, advancements in artificial intelligence and machine learning, and the growing adoption of cloud-based supercomputing solutions. Technological disruptions such as the development of more energy-efficient processors and the increasing availability of large datasets are further accelerating market expansion. Market penetration in key segments, such as commercial industries and government entities, is steadily increasing. Competitive dynamics are characterized by intense rivalry among established players and the emergence of new entrants focusing on specialized solutions.
Dominant Regions & Segments in Supercomputers Market
North America currently dominates the supercomputers market, driven by significant investments in research and development, a strong presence of major technology companies, and robust government funding. Europe and Asia-Pacific are also experiencing considerable growth.
- North America Dominance: Strong R&D investment, major technology companies, government funding.
- Europe Growth: Increasing adoption in research and commercial sectors.
- Asia-Pacific Expansion: Emerging economies driving demand.
Within the end-user segments:
- Commercial Industries: High demand from financial modeling, drug discovery, and simulations.
- Government Entities: National security, weather forecasting, and scientific research.
- Research Institutions: Academic research, advanced simulations, and data analysis.
The Research Institutions segment is projected to exhibit the highest CAGR during the forecast period, driven by increasing funding for scientific research and the need for advanced computational capabilities.
Supercomputers Market Product Innovations
Recent product innovations focus on enhancing processing power, memory capacity, and energy efficiency. New architectures like heterogeneous computing and specialized accelerators are being integrated to optimize performance for specific applications. This allows for improved market fit and competitive advantage, particularly in AI and machine learning applications. The integration of advanced cooling systems is also crucial for managing the high energy demands of these systems.
Report Scope & Segmentation Analysis
This report segments the supercomputers market by end-user:
Commercial Industries: This segment covers various industries leveraging supercomputers for simulations, modeling, and data analysis. Market size in 2025 is estimated at xx Million, with a projected CAGR of xx% during the forecast period. Competition is intense among established players.
Government Entities: This segment includes national laboratories, defense agencies, and meteorological departments, driving significant demand. Market size in 2025 is estimated at xx Million, with a projected CAGR of xx%. Focus on security and reliability drives market dynamics.
Research Institutions: Universities and research organizations form this segment, with a strong focus on scientific breakthroughs. Market size in 2025 is estimated at xx Million, with a projected CAGR of xx%. Funding and collaboration play key roles.
Key Drivers of Supercomputers Market Growth
The supercomputers market is propelled by several key factors: the exponential growth of data, the increasing demand for high-performance computing in AI and machine learning, the advancements in chip technology leading to faster and more efficient processors, and government initiatives promoting technological advancements and scientific research. Government funding for research and development initiatives is a significant driver, stimulating innovation and adoption across various segments.
Challenges in the Supercomputers Market Sector
Challenges include the high cost of supercomputers, the complexity of their implementation and maintenance, the need for specialized expertise, and the potential security risks associated with handling sensitive data. Supply chain disruptions can also significantly impact availability and pricing. Competition from cloud-based solutions further intensifies the competitive landscape. These challenges negatively affect market growth by limiting accessibility and affordability.
Emerging Opportunities in Supercomputers Market
Emerging opportunities include the growing adoption of supercomputers in new fields like genomics and personalized medicine, the development of more energy-efficient systems, and the increasing integration of AI and machine learning capabilities within supercomputer architectures. The expansion of high-speed networking infrastructure provides further opportunities for growth. Exploring new applications in diverse fields and developing cost-effective solutions will expand the market.
Leading Players in the Supercomputers Market Market
- IBM Corporation
- Fujitsu Ltd
- Hewlett Packard Enterprise
- Dell EMC (Dell Technologies Inc.)
- NEC Technologies India Private Limited
- Atos SE
- Lenovo Inc
- Intel Corporation
Key Developments in Supercomputers Market Industry
- Jan 2023: IBM announced a new generation of supercomputers incorporating advanced AI capabilities.
- Apr 2022: Fujitsu launched a new exascale supercomputer designed for energy-efficient operation.
- Oct 2021: A partnership between Dell EMC and a major research institution resulted in a significant supercomputing deployment. (Further developments to be added as they become available)
Future Outlook for Supercomputers Market Market
The supercomputers market is poised for sustained growth, driven by ongoing technological advancements, increasing demand from various sectors, and supportive government policies. Strategic investments in research and development, focusing on energy efficiency and enhanced performance, will shape the future of this dynamic market. The integration of AI and machine learning will lead to new applications and increased demand, fostering significant opportunities for growth.
Supercomputers Market Segmentation
-
1. End User
- 1.1. Commercial Industries
- 1.2. Government Entities
- 1.3. Research Institutions
Supercomputers Market Segmentation By Geography
- 1. North America
- 2. Europe
- 3. Asia
- 4. Australia and New Zealand
- 5. Latin America
- 6. Middle East and Africa
Supercomputers Market REPORT HIGHLIGHTS
| Aspects | Details |
|---|---|
| Study Period | 2019-2033 |
| Base Year | 2024 |
| Estimated Year | 2025 |
| Forecast Period | 2025-2033 |
| Historical Period | 2019-2024 |
| Growth Rate | CAGR of 0.09% from 2019-2033 |
| Segmentation |
|
Table of Contents
- 1. Introduction
- 1.1. Research Scope
- 1.2. Market Segmentation
- 1.3. Research Methodology
- 1.4. Definitions and Assumptions
- 2. Executive Summary
- 2.1. Introduction
- 3. Market Dynamics
- 3.1. Introduction
- 3.2. Market Drivers
- 3.2.1. Increasing Demand for Higher Processing Power; Increasing Investments in Research
- 3.3. Market Restrains
- 3.3.1. High Initial Setup Cost; Large Installation Space
- 3.4. Market Trends
- 3.4.1. Increasing Demand for Higher Processing Power to Drive the Market
- 4. Market Factor Analysis
- 4.1. Porters Five Forces
- 4.2. Supply/Value Chain
- 4.3. PESTEL analysis
- 4.4. Market Entropy
- 4.5. Patent/Trademark Analysis
- 5. Global Supercomputers Market Analysis, Insights and Forecast, 2019-2031
- 5.1. Market Analysis, Insights and Forecast - by End User
- 5.1.1. Commercial Industries
- 5.1.2. Government Entities
- 5.1.3. Research Institutions
- 5.2. Market Analysis, Insights and Forecast - by Region
- 5.2.1. North America
- 5.2.2. Europe
- 5.2.3. Asia
- 5.2.4. Australia and New Zealand
- 5.2.5. Latin America
- 5.2.6. Middle East and Africa
- 5.1. Market Analysis, Insights and Forecast - by End User
- 6. North America Supercomputers Market Analysis, Insights and Forecast, 2019-2031
- 6.1. Market Analysis, Insights and Forecast - by End User
- 6.1.1. Commercial Industries
- 6.1.2. Government Entities
- 6.1.3. Research Institutions
- 6.1. Market Analysis, Insights and Forecast - by End User
- 7. Europe Supercomputers Market Analysis, Insights and Forecast, 2019-2031
- 7.1. Market Analysis, Insights and Forecast - by End User
- 7.1.1. Commercial Industries
- 7.1.2. Government Entities
- 7.1.3. Research Institutions
- 7.1. Market Analysis, Insights and Forecast - by End User
- 8. Asia Supercomputers Market Analysis, Insights and Forecast, 2019-2031
- 8.1. Market Analysis, Insights and Forecast - by End User
- 8.1.1. Commercial Industries
- 8.1.2. Government Entities
- 8.1.3. Research Institutions
- 8.1. Market Analysis, Insights and Forecast - by End User
- 9. Australia and New Zealand Supercomputers Market Analysis, Insights and Forecast, 2019-2031
- 9.1. Market Analysis, Insights and Forecast - by End User
- 9.1.1. Commercial Industries
- 9.1.2. Government Entities
- 9.1.3. Research Institutions
- 9.1. Market Analysis, Insights and Forecast - by End User
- 10. Latin America Supercomputers Market Analysis, Insights and Forecast, 2019-2031
- 10.1. Market Analysis, Insights and Forecast - by End User
- 10.1.1. Commercial Industries
- 10.1.2. Government Entities
- 10.1.3. Research Institutions
- 10.1. Market Analysis, Insights and Forecast - by End User
- 11. Middle East and Africa Supercomputers Market Analysis, Insights and Forecast, 2019-2031
- 11.1. Market Analysis, Insights and Forecast - by End User
- 11.1.1. Commercial Industries
- 11.1.2. Government Entities
- 11.1.3. Research Institutions
- 11.1. Market Analysis, Insights and Forecast - by End User
- 12. North America Supercomputers Market Analysis, Insights and Forecast, 2019-2031
- 12.1. Market Analysis, Insights and Forecast - By Country/Sub-region
- 12.1.1 United States
- 12.1.2 Canada
- 12.1.3 Mexico
- 13. Europe Supercomputers Market Analysis, Insights and Forecast, 2019-2031
- 13.1. Market Analysis, Insights and Forecast - By Country/Sub-region
- 13.1.1 Germany
- 13.1.2 United Kingdom
- 13.1.3 France
- 13.1.4 Spain
- 13.1.5 Italy
- 13.1.6 Spain
- 13.1.7 Belgium
- 13.1.8 Netherland
- 13.1.9 Nordics
- 13.1.10 Rest of Europe
- 14. Asia Pacific Supercomputers Market Analysis, Insights and Forecast, 2019-2031
- 14.1. Market Analysis, Insights and Forecast - By Country/Sub-region
- 14.1.1 China
- 14.1.2 Japan
- 14.1.3 India
- 14.1.4 South Korea
- 14.1.5 Southeast Asia
- 14.1.6 Australia
- 14.1.7 Indonesia
- 14.1.8 Phillipes
- 14.1.9 Singapore
- 14.1.10 Thailandc
- 14.1.11 Rest of Asia Pacific
- 15. South America Supercomputers Market Analysis, Insights and Forecast, 2019-2031
- 15.1. Market Analysis, Insights and Forecast - By Country/Sub-region
- 15.1.1 Brazil
- 15.1.2 Argentina
- 15.1.3 Peru
- 15.1.4 Chile
- 15.1.5 Colombia
- 15.1.6 Ecuador
- 15.1.7 Venezuela
- 15.1.8 Rest of South America
- 16. North America Supercomputers Market Analysis, Insights and Forecast, 2019-2031
- 16.1. Market Analysis, Insights and Forecast - By Country/Sub-region
- 16.1.1 United States
- 16.1.2 Canada
- 16.1.3 Mexico
- 17. MEA Supercomputers Market Analysis, Insights and Forecast, 2019-2031
- 17.1. Market Analysis, Insights and Forecast - By Country/Sub-region
- 17.1.1 United Arab Emirates
- 17.1.2 Saudi Arabia
- 17.1.3 South Africa
- 17.1.4 Rest of Middle East and Africa
- 18. Competitive Analysis
- 18.1. Global Market Share Analysis 2024
- 18.2. Company Profiles
- 18.2.1 IBM Corporation
- 18.2.1.1. Overview
- 18.2.1.2. Products
- 18.2.1.3. SWOT Analysis
- 18.2.1.4. Recent Developments
- 18.2.1.5. Financials (Based on Availability)
- 18.2.2 Fujitsu Ltd
- 18.2.2.1. Overview
- 18.2.2.2. Products
- 18.2.2.3. SWOT Analysis
- 18.2.2.4. Recent Developments
- 18.2.2.5. Financials (Based on Availability)
- 18.2.3 Hewlett Packard Enterprise
- 18.2.3.1. Overview
- 18.2.3.2. Products
- 18.2.3.3. SWOT Analysis
- 18.2.3.4. Recent Developments
- 18.2.3.5. Financials (Based on Availability)
- 18.2.4 Dell EMC (Dell Technologies Inc )
- 18.2.4.1. Overview
- 18.2.4.2. Products
- 18.2.4.3. SWOT Analysis
- 18.2.4.4. Recent Developments
- 18.2.4.5. Financials (Based on Availability)
- 18.2.5 NEC Technologies India Private Limite
- 18.2.5.1. Overview
- 18.2.5.2. Products
- 18.2.5.3. SWOT Analysis
- 18.2.5.4. Recent Developments
- 18.2.5.5. Financials (Based on Availability)
- 18.2.6 Atos SE
- 18.2.6.1. Overview
- 18.2.6.2. Products
- 18.2.6.3. SWOT Analysis
- 18.2.6.4. Recent Developments
- 18.2.6.5. Financials (Based on Availability)
- 18.2.7 Lenovo Inc
- 18.2.7.1. Overview
- 18.2.7.2. Products
- 18.2.7.3. SWOT Analysis
- 18.2.7.4. Recent Developments
- 18.2.7.5. Financials (Based on Availability)
- 18.2.8 Intel Corporation
- 18.2.8.1. Overview
- 18.2.8.2. Products
- 18.2.8.3. SWOT Analysis
- 18.2.8.4. Recent Developments
- 18.2.8.5. Financials (Based on Availability)
- 18.2.1 IBM Corporation
List of Figures
- Figure 1: Global Supercomputers Market Revenue Breakdown (Million, %) by Region 2024 & 2032
- Figure 2: Global Supercomputers Market Volume Breakdown (K Unit, %) by Region 2024 & 2032
- Figure 3: North America Supercomputers Market Revenue (Million), by Country 2024 & 2032
- Figure 4: North America Supercomputers Market Volume (K Unit), by Country 2024 & 2032
- Figure 5: North America Supercomputers Market Revenue Share (%), by Country 2024 & 2032
- Figure 6: North America Supercomputers Market Volume Share (%), by Country 2024 & 2032
- Figure 7: Europe Supercomputers Market Revenue (Million), by Country 2024 & 2032
- Figure 8: Europe Supercomputers Market Volume (K Unit), by Country 2024 & 2032
- Figure 9: Europe Supercomputers Market Revenue Share (%), by Country 2024 & 2032
- Figure 10: Europe Supercomputers Market Volume Share (%), by Country 2024 & 2032
- Figure 11: Asia Pacific Supercomputers Market Revenue (Million), by Country 2024 & 2032
- Figure 12: Asia Pacific Supercomputers Market Volume (K Unit), by Country 2024 & 2032
- Figure 13: Asia Pacific Supercomputers Market Revenue Share (%), by Country 2024 & 2032
- Figure 14: Asia Pacific Supercomputers Market Volume Share (%), by Country 2024 & 2032
- Figure 15: South America Supercomputers Market Revenue (Million), by Country 2024 & 2032
- Figure 16: South America Supercomputers Market Volume (K Unit), by Country 2024 & 2032
- Figure 17: South America Supercomputers Market Revenue Share (%), by Country 2024 & 2032
- Figure 18: South America Supercomputers Market Volume Share (%), by Country 2024 & 2032
- Figure 19: North America Supercomputers Market Revenue (Million), by Country 2024 & 2032
- Figure 20: North America Supercomputers Market Volume (K Unit), by Country 2024 & 2032
- Figure 21: North America Supercomputers Market Revenue Share (%), by Country 2024 & 2032
- Figure 22: North America Supercomputers Market Volume Share (%), by Country 2024 & 2032
- Figure 23: MEA Supercomputers Market Revenue (Million), by Country 2024 & 2032
- Figure 24: MEA Supercomputers Market Volume (K Unit), by Country 2024 & 2032
- Figure 25: MEA Supercomputers Market Revenue Share (%), by Country 2024 & 2032
- Figure 26: MEA Supercomputers Market Volume Share (%), by Country 2024 & 2032
- Figure 27: North America Supercomputers Market Revenue (Million), by End User 2024 & 2032
- Figure 28: North America Supercomputers Market Volume (K Unit), by End User 2024 & 2032
- Figure 29: North America Supercomputers Market Revenue Share (%), by End User 2024 & 2032
- Figure 30: North America Supercomputers Market Volume Share (%), by End User 2024 & 2032
- Figure 31: North America Supercomputers Market Revenue (Million), by Country 2024 & 2032
- Figure 32: North America Supercomputers Market Volume (K Unit), by Country 2024 & 2032
- Figure 33: North America Supercomputers Market Revenue Share (%), by Country 2024 & 2032
- Figure 34: North America Supercomputers Market Volume Share (%), by Country 2024 & 2032
- Figure 35: Europe Supercomputers Market Revenue (Million), by End User 2024 & 2032
- Figure 36: Europe Supercomputers Market Volume (K Unit), by End User 2024 & 2032
- Figure 37: Europe Supercomputers Market Revenue Share (%), by End User 2024 & 2032
- Figure 38: Europe Supercomputers Market Volume Share (%), by End User 2024 & 2032
- Figure 39: Europe Supercomputers Market Revenue (Million), by Country 2024 & 2032
- Figure 40: Europe Supercomputers Market Volume (K Unit), by Country 2024 & 2032
- Figure 41: Europe Supercomputers Market Revenue Share (%), by Country 2024 & 2032
- Figure 42: Europe Supercomputers Market Volume Share (%), by Country 2024 & 2032
- Figure 43: Asia Supercomputers Market Revenue (Million), by End User 2024 & 2032
- Figure 44: Asia Supercomputers Market Volume (K Unit), by End User 2024 & 2032
- Figure 45: Asia Supercomputers Market Revenue Share (%), by End User 2024 & 2032
- Figure 46: Asia Supercomputers Market Volume Share (%), by End User 2024 & 2032
- Figure 47: Asia Supercomputers Market Revenue (Million), by Country 2024 & 2032
- Figure 48: Asia Supercomputers Market Volume (K Unit), by Country 2024 & 2032
- Figure 49: Asia Supercomputers Market Revenue Share (%), by Country 2024 & 2032
- Figure 50: Asia Supercomputers Market Volume Share (%), by Country 2024 & 2032
- Figure 51: Australia and New Zealand Supercomputers Market Revenue (Million), by End User 2024 & 2032
- Figure 52: Australia and New Zealand Supercomputers Market Volume (K Unit), by End User 2024 & 2032
- Figure 53: Australia and New Zealand Supercomputers Market Revenue Share (%), by End User 2024 & 2032
- Figure 54: Australia and New Zealand Supercomputers Market Volume Share (%), by End User 2024 & 2032
- Figure 55: Australia and New Zealand Supercomputers Market Revenue (Million), by Country 2024 & 2032
- Figure 56: Australia and New Zealand Supercomputers Market Volume (K Unit), by Country 2024 & 2032
- Figure 57: Australia and New Zealand Supercomputers Market Revenue Share (%), by Country 2024 & 2032
- Figure 58: Australia and New Zealand Supercomputers Market Volume Share (%), by Country 2024 & 2032
- Figure 59: Latin America Supercomputers Market Revenue (Million), by End User 2024 & 2032
- Figure 60: Latin America Supercomputers Market Volume (K Unit), by End User 2024 & 2032
- Figure 61: Latin America Supercomputers Market Revenue Share (%), by End User 2024 & 2032
- Figure 62: Latin America Supercomputers Market Volume Share (%), by End User 2024 & 2032
- Figure 63: Latin America Supercomputers Market Revenue (Million), by Country 2024 & 2032
- Figure 64: Latin America Supercomputers Market Volume (K Unit), by Country 2024 & 2032
- Figure 65: Latin America Supercomputers Market Revenue Share (%), by Country 2024 & 2032
- Figure 66: Latin America Supercomputers Market Volume Share (%), by Country 2024 & 2032
- Figure 67: Middle East and Africa Supercomputers Market Revenue (Million), by End User 2024 & 2032
- Figure 68: Middle East and Africa Supercomputers Market Volume (K Unit), by End User 2024 & 2032
- Figure 69: Middle East and Africa Supercomputers Market Revenue Share (%), by End User 2024 & 2032
- Figure 70: Middle East and Africa Supercomputers Market Volume Share (%), by End User 2024 & 2032
- Figure 71: Middle East and Africa Supercomputers Market Revenue (Million), by Country 2024 & 2032
- Figure 72: Middle East and Africa Supercomputers Market Volume (K Unit), by Country 2024 & 2032
- Figure 73: Middle East and Africa Supercomputers Market Revenue Share (%), by Country 2024 & 2032
- Figure 74: Middle East and Africa Supercomputers Market Volume Share (%), by Country 2024 & 2032
List of Tables
- Table 1: Global Supercomputers Market Revenue Million Forecast, by Region 2019 & 2032
- Table 2: Global Supercomputers Market Volume K Unit Forecast, by Region 2019 & 2032
- Table 3: Global Supercomputers Market Revenue Million Forecast, by End User 2019 & 2032
- Table 4: Global Supercomputers Market Volume K Unit Forecast, by End User 2019 & 2032
- Table 5: Global Supercomputers Market Revenue Million Forecast, by Region 2019 & 2032
- Table 6: Global Supercomputers Market Volume K Unit Forecast, by Region 2019 & 2032
- Table 7: Global Supercomputers Market Revenue Million Forecast, by Country 2019 & 2032
- Table 8: Global Supercomputers Market Volume K Unit Forecast, by Country 2019 & 2032
- Table 9: United States Supercomputers Market Revenue (Million) Forecast, by Application 2019 & 2032
- Table 10: United States Supercomputers Market Volume (K Unit) Forecast, by Application 2019 & 2032
- Table 11: Canada Supercomputers Market Revenue (Million) Forecast, by Application 2019 & 2032
- Table 12: Canada Supercomputers Market Volume (K Unit) Forecast, by Application 2019 & 2032
- Table 13: Mexico Supercomputers Market Revenue (Million) Forecast, by Application 2019 & 2032
- Table 14: Mexico Supercomputers Market Volume (K Unit) Forecast, by Application 2019 & 2032
- Table 15: Global Supercomputers Market Revenue Million Forecast, by Country 2019 & 2032
- Table 16: Global Supercomputers Market Volume K Unit Forecast, by Country 2019 & 2032
- Table 17: Germany Supercomputers Market Revenue (Million) Forecast, by Application 2019 & 2032
- Table 18: Germany Supercomputers Market Volume (K Unit) Forecast, by Application 2019 & 2032
- Table 19: United Kingdom Supercomputers Market Revenue (Million) Forecast, by Application 2019 & 2032
- Table 20: United Kingdom Supercomputers Market Volume (K Unit) Forecast, by Application 2019 & 2032
- Table 21: France Supercomputers Market Revenue (Million) Forecast, by Application 2019 & 2032
- Table 22: France Supercomputers Market Volume (K Unit) Forecast, by Application 2019 & 2032
- Table 23: Spain Supercomputers Market Revenue (Million) Forecast, by Application 2019 & 2032
- Table 24: Spain Supercomputers Market Volume (K Unit) Forecast, by Application 2019 & 2032
- Table 25: Italy Supercomputers Market Revenue (Million) Forecast, by Application 2019 & 2032
- Table 26: Italy Supercomputers Market Volume (K Unit) Forecast, by Application 2019 & 2032
- Table 27: Spain Supercomputers Market Revenue (Million) Forecast, by Application 2019 & 2032
- Table 28: Spain Supercomputers Market Volume (K Unit) Forecast, by Application 2019 & 2032
- Table 29: Belgium Supercomputers Market Revenue (Million) Forecast, by Application 2019 & 2032
- Table 30: Belgium Supercomputers Market Volume (K Unit) Forecast, by Application 2019 & 2032
- Table 31: Netherland Supercomputers Market Revenue (Million) Forecast, by Application 2019 & 2032
- Table 32: Netherland Supercomputers Market Volume (K Unit) Forecast, by Application 2019 & 2032
- Table 33: Nordics Supercomputers Market Revenue (Million) Forecast, by Application 2019 & 2032
- Table 34: Nordics Supercomputers Market Volume (K Unit) Forecast, by Application 2019 & 2032
- Table 35: Rest of Europe Supercomputers Market Revenue (Million) Forecast, by Application 2019 & 2032
- Table 36: Rest of Europe Supercomputers Market Volume (K Unit) Forecast, by Application 2019 & 2032
- Table 37: Global Supercomputers Market Revenue Million Forecast, by Country 2019 & 2032
- Table 38: Global Supercomputers Market Volume K Unit Forecast, by Country 2019 & 2032
- Table 39: China Supercomputers Market Revenue (Million) Forecast, by Application 2019 & 2032
- Table 40: China Supercomputers Market Volume (K Unit) Forecast, by Application 2019 & 2032
- Table 41: Japan Supercomputers Market Revenue (Million) Forecast, by Application 2019 & 2032
- Table 42: Japan Supercomputers Market Volume (K Unit) Forecast, by Application 2019 & 2032
- Table 43: India Supercomputers Market Revenue (Million) Forecast, by Application 2019 & 2032
- Table 44: India Supercomputers Market Volume (K Unit) Forecast, by Application 2019 & 2032
- Table 45: South Korea Supercomputers Market Revenue (Million) Forecast, by Application 2019 & 2032
- Table 46: South Korea Supercomputers Market Volume (K Unit) Forecast, by Application 2019 & 2032
- Table 47: Southeast Asia Supercomputers Market Revenue (Million) Forecast, by Application 2019 & 2032
- Table 48: Southeast Asia Supercomputers Market Volume (K Unit) Forecast, by Application 2019 & 2032
- Table 49: Australia Supercomputers Market Revenue (Million) Forecast, by Application 2019 & 2032
- Table 50: Australia Supercomputers Market Volume (K Unit) Forecast, by Application 2019 & 2032
- Table 51: Indonesia Supercomputers Market Revenue (Million) Forecast, by Application 2019 & 2032
- Table 52: Indonesia Supercomputers Market Volume (K Unit) Forecast, by Application 2019 & 2032
- Table 53: Phillipes Supercomputers Market Revenue (Million) Forecast, by Application 2019 & 2032
- Table 54: Phillipes Supercomputers Market Volume (K Unit) Forecast, by Application 2019 & 2032
- Table 55: Singapore Supercomputers Market Revenue (Million) Forecast, by Application 2019 & 2032
- Table 56: Singapore Supercomputers Market Volume (K Unit) Forecast, by Application 2019 & 2032
- Table 57: Thailandc Supercomputers Market Revenue (Million) Forecast, by Application 2019 & 2032
- Table 58: Thailandc Supercomputers Market Volume (K Unit) Forecast, by Application 2019 & 2032
- Table 59: Rest of Asia Pacific Supercomputers Market Revenue (Million) Forecast, by Application 2019 & 2032
- Table 60: Rest of Asia Pacific Supercomputers Market Volume (K Unit) Forecast, by Application 2019 & 2032
- Table 61: Global Supercomputers Market Revenue Million Forecast, by Country 2019 & 2032
- Table 62: Global Supercomputers Market Volume K Unit Forecast, by Country 2019 & 2032
- Table 63: Brazil Supercomputers Market Revenue (Million) Forecast, by Application 2019 & 2032
- Table 64: Brazil Supercomputers Market Volume (K Unit) Forecast, by Application 2019 & 2032
- Table 65: Argentina Supercomputers Market Revenue (Million) Forecast, by Application 2019 & 2032
- Table 66: Argentina Supercomputers Market Volume (K Unit) Forecast, by Application 2019 & 2032
- Table 67: Peru Supercomputers Market Revenue (Million) Forecast, by Application 2019 & 2032
- Table 68: Peru Supercomputers Market Volume (K Unit) Forecast, by Application 2019 & 2032
- Table 69: Chile Supercomputers Market Revenue (Million) Forecast, by Application 2019 & 2032
- Table 70: Chile Supercomputers Market Volume (K Unit) Forecast, by Application 2019 & 2032
- Table 71: Colombia Supercomputers Market Revenue (Million) Forecast, by Application 2019 & 2032
- Table 72: Colombia Supercomputers Market Volume (K Unit) Forecast, by Application 2019 & 2032
- Table 73: Ecuador Supercomputers Market Revenue (Million) Forecast, by Application 2019 & 2032
- Table 74: Ecuador Supercomputers Market Volume (K Unit) Forecast, by Application 2019 & 2032
- Table 75: Venezuela Supercomputers Market Revenue (Million) Forecast, by Application 2019 & 2032
- Table 76: Venezuela Supercomputers Market Volume (K Unit) Forecast, by Application 2019 & 2032
- Table 77: Rest of South America Supercomputers Market Revenue (Million) Forecast, by Application 2019 & 2032
- Table 78: Rest of South America Supercomputers Market Volume (K Unit) Forecast, by Application 2019 & 2032
- Table 79: Global Supercomputers Market Revenue Million Forecast, by Country 2019 & 2032
- Table 80: Global Supercomputers Market Volume K Unit Forecast, by Country 2019 & 2032
- Table 81: United States Supercomputers Market Revenue (Million) Forecast, by Application 2019 & 2032
- Table 82: United States Supercomputers Market Volume (K Unit) Forecast, by Application 2019 & 2032
- Table 83: Canada Supercomputers Market Revenue (Million) Forecast, by Application 2019 & 2032
- Table 84: Canada Supercomputers Market Volume (K Unit) Forecast, by Application 2019 & 2032
- Table 85: Mexico Supercomputers Market Revenue (Million) Forecast, by Application 2019 & 2032
- Table 86: Mexico Supercomputers Market Volume (K Unit) Forecast, by Application 2019 & 2032
- Table 87: Global Supercomputers Market Revenue Million Forecast, by Country 2019 & 2032
- Table 88: Global Supercomputers Market Volume K Unit Forecast, by Country 2019 & 2032
- Table 89: United Arab Emirates Supercomputers Market Revenue (Million) Forecast, by Application 2019 & 2032
- Table 90: United Arab Emirates Supercomputers Market Volume (K Unit) Forecast, by Application 2019 & 2032
- Table 91: Saudi Arabia Supercomputers Market Revenue (Million) Forecast, by Application 2019 & 2032
- Table 92: Saudi Arabia Supercomputers Market Volume (K Unit) Forecast, by Application 2019 & 2032
- Table 93: South Africa Supercomputers Market Revenue (Million) Forecast, by Application 2019 & 2032
- Table 94: South Africa Supercomputers Market Volume (K Unit) Forecast, by Application 2019 & 2032
- Table 95: Rest of Middle East and Africa Supercomputers Market Revenue (Million) Forecast, by Application 2019 & 2032
- Table 96: Rest of Middle East and Africa Supercomputers Market Volume (K Unit) Forecast, by Application 2019 & 2032
- Table 97: Global Supercomputers Market Revenue Million Forecast, by End User 2019 & 2032
- Table 98: Global Supercomputers Market Volume K Unit Forecast, by End User 2019 & 2032
- Table 99: Global Supercomputers Market Revenue Million Forecast, by Country 2019 & 2032
- Table 100: Global Supercomputers Market Volume K Unit Forecast, by Country 2019 & 2032
- Table 101: Global Supercomputers Market Revenue Million Forecast, by End User 2019 & 2032
- Table 102: Global Supercomputers Market Volume K Unit Forecast, by End User 2019 & 2032
- Table 103: Global Supercomputers Market Revenue Million Forecast, by Country 2019 & 2032
- Table 104: Global Supercomputers Market Volume K Unit Forecast, by Country 2019 & 2032
- Table 105: Global Supercomputers Market Revenue Million Forecast, by End User 2019 & 2032
- Table 106: Global Supercomputers Market Volume K Unit Forecast, by End User 2019 & 2032
- Table 107: Global Supercomputers Market Revenue Million Forecast, by Country 2019 & 2032
- Table 108: Global Supercomputers Market Volume K Unit Forecast, by Country 2019 & 2032
- Table 109: Global Supercomputers Market Revenue Million Forecast, by End User 2019 & 2032
- Table 110: Global Supercomputers Market Volume K Unit Forecast, by End User 2019 & 2032
- Table 111: Global Supercomputers Market Revenue Million Forecast, by Country 2019 & 2032
- Table 112: Global Supercomputers Market Volume K Unit Forecast, by Country 2019 & 2032
- Table 113: Global Supercomputers Market Revenue Million Forecast, by End User 2019 & 2032
- Table 114: Global Supercomputers Market Volume K Unit Forecast, by End User 2019 & 2032
- Table 115: Global Supercomputers Market Revenue Million Forecast, by Country 2019 & 2032
- Table 116: Global Supercomputers Market Volume K Unit Forecast, by Country 2019 & 2032
- Table 117: Global Supercomputers Market Revenue Million Forecast, by End User 2019 & 2032
- Table 118: Global Supercomputers Market Volume K Unit Forecast, by End User 2019 & 2032
- Table 119: Global Supercomputers Market Revenue Million Forecast, by Country 2019 & 2032
- Table 120: Global Supercomputers Market Volume K Unit Forecast, by Country 2019 & 2032
Frequently Asked Questions
1. What is the projected Compound Annual Growth Rate (CAGR) of the Supercomputers Market?
The projected CAGR is approximately 0.09%.
2. Which companies are prominent players in the Supercomputers Market?
Key companies in the market include IBM Corporation, Fujitsu Ltd, Hewlett Packard Enterprise, Dell EMC (Dell Technologies Inc ), NEC Technologies India Private Limite, Atos SE, Lenovo Inc, Intel Corporation.
3. What are the main segments of the Supercomputers Market?
The market segments include End User.
4. Can you provide details about the market size?
The market size is estimated to be USD 12.10 Million as of 2022.
5. What are some drivers contributing to market growth?
Increasing Demand for Higher Processing Power; Increasing Investments in Research.
6. What are the notable trends driving market growth?
Increasing Demand for Higher Processing Power to Drive the Market.
7. Are there any restraints impacting market growth?
High Initial Setup Cost; Large Installation Space.
8. Can you provide examples of recent developments in the market?
N/A
9. What pricing options are available for accessing the report?
Pricing options include single-user, multi-user, and enterprise licenses priced at USD 4750, USD 5250, and USD 8750 respectively.
10. Is the market size provided in terms of value or volume?
The market size is provided in terms of value, measured in Million and volume, measured in K Unit.
11. Are there any specific market keywords associated with the report?
Yes, the market keyword associated with the report is "Supercomputers Market," which aids in identifying and referencing the specific market segment covered.
12. How do I determine which pricing option suits my needs best?
The pricing options vary based on user requirements and access needs. Individual users may opt for single-user licenses, while businesses requiring broader access may choose multi-user or enterprise licenses for cost-effective access to the report.
13. Are there any additional resources or data provided in the Supercomputers Market report?
While the report offers comprehensive insights, it's advisable to review the specific contents or supplementary materials provided to ascertain if additional resources or data are available.
14. How can I stay updated on further developments or reports in the Supercomputers Market?
To stay informed about further developments, trends, and reports in the Supercomputers Market, consider subscribing to industry newsletters, following relevant companies and organizations, or regularly checking reputable industry news sources and publications.
Methodology
Step 1 - Identification of Relevant Samples Size from Population Database


Step 2 - Approaches for Defining Global Market Size (Value, Volume* & Price*)

Note*: In applicable scenarios
Step 3 - Data Sources
Primary Research
- Web Analytics
- Survey Reports
- Research Institute
- Latest Research Reports
- Opinion Leaders
Secondary Research
- Annual Reports
- White Paper
- Latest Press Release
- Industry Association
- Paid Database
- Investor Presentations

Step 4 - Data Triangulation
Involves using different sources of information in order to increase the validity of a study
These sources are likely to be stakeholders in a program - participants, other researchers, program staff, other community members, and so on.
Then we put all data in single framework & apply various statistical tools to find out the dynamic on the market.
During the analysis stage, feedback from the stakeholder groups would be compared to determine areas of agreement as well as areas of divergence


