
Key Insights
The global telecom cable market, valued at approximately $XX million in 2025, is projected to experience robust growth, driven by the escalating demand for high-speed internet and data communication across various sectors. A compound annual growth rate (CAGR) of 7.30% from 2025 to 2033 indicates a significant expansion, primarily fueled by the increasing adoption of 5G networks, the proliferation of data centers, and the expanding reach of fiber optic technologies. The market segmentation reveals substantial opportunities within fiber optic cables, driven by their superior bandwidth and long-distance transmission capabilities. Data center cables are another key segment benefiting from the surge in cloud computing and big data analytics. Geographically, North America and Asia-Pacific are expected to remain dominant regions, owing to their advanced technological infrastructure and substantial investments in telecom infrastructure development. However, significant growth is anticipated in other regions, such as Europe and South America, as investments in digital infrastructure accelerate. Competitive pressures amongst established players like Belden Inc., Prysmian Group, and Sumitomo Electric Industries Ltd., coupled with the emergence of new players, will further shape market dynamics. Challenges such as the high initial investment costs associated with fiber optic infrastructure deployment and the need for continuous technological upgrades to maintain network efficiency may pose some restraints, but the overall market outlook remains optimistic due to the sustained growth in data consumption and connectivity demands.
The telecom cable industry is characterized by a dynamic interplay of technological advancements and evolving consumer demands. The increasing prevalence of smart devices, IoT applications, and streaming services are significant catalysts for market growth. The shift towards cloud-based solutions is further propelling the demand for high-bandwidth cables, particularly fiber optic cables. The continuous research and development in cable technology, focusing on enhanced performance, durability, and cost-effectiveness, will likely influence market segmentation. Government initiatives to improve digital infrastructure and connectivity across nations are contributing significantly to market expansion, especially in emerging economies. Furthermore, the strategic partnerships and mergers and acquisitions within the industry will continue shaping the competitive landscape, with a focus on expanding geographical reach and technological capabilities. While challenges related to material costs and supply chain disruptions persist, the long-term prospects for the telecom cable industry remain positive, supported by the sustained global demand for enhanced connectivity and data transmission.
Telecom Cable Industry Market Report: 2019-2033
This comprehensive report provides an in-depth analysis of the global telecom cable industry, offering invaluable insights for industry professionals, investors, and strategic decision-makers. With a study period spanning 2019-2033, a base year of 2025, and a forecast period of 2025-2033, this report leverages rigorous data analysis and expert insights to illuminate current market dynamics and future growth trajectories. The report covers key segments, leading players, and emerging trends, providing a holistic view of this vital sector. The market is projected to reach xx Million by 2033, exhibiting a CAGR of xx% during the forecast period.
Telecom Cable Industry Market Structure & Innovation Trends
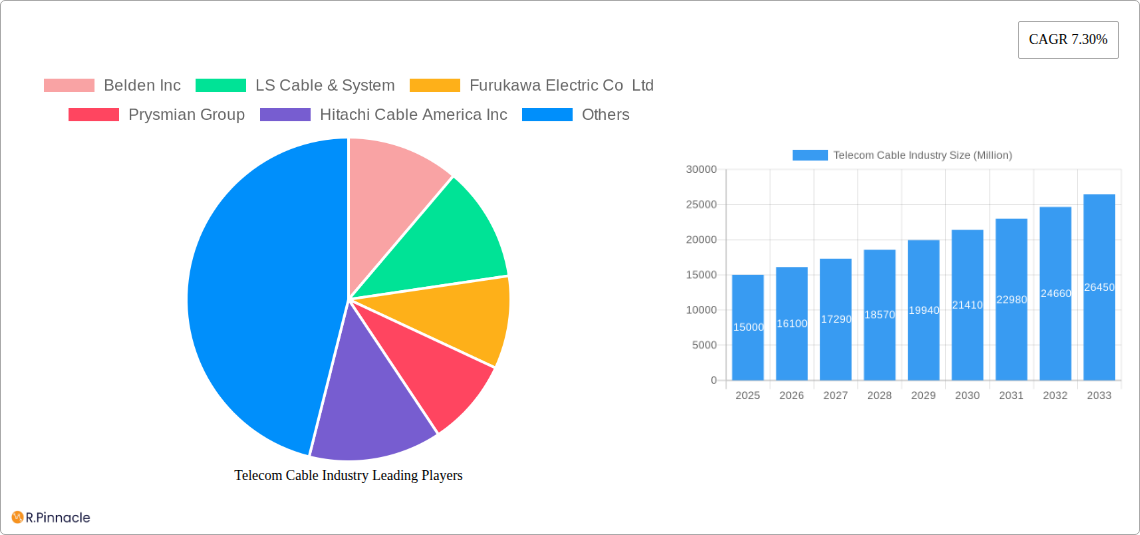
The global telecom cable market is characterized by a moderately concentrated structure, with a few major players holding significant market share. Belden Inc, LS Cable & System, Furukawa Electric Co Ltd, Prysmian Group, and Sumitomo Electric Industries Ltd are among the key players, collectively accounting for an estimated xx% of the global market share in 2024. Market concentration is influenced by factors such as economies of scale, technological advancements, and access to raw materials.
Innovation is a critical driver within the industry, with ongoing R&D efforts focused on enhancing bandwidth capacity, improving signal quality, and developing more efficient and sustainable cable solutions. Regulatory frameworks, particularly concerning spectrum allocation and environmental regulations, play a significant role in shaping market dynamics. Product substitutes, such as wireless technologies, present competitive pressures, though fiber optic cables maintain a strong advantage in high-bandwidth applications. End-user demographics are evolving, with a growing demand for high-speed internet access driving the expansion of fiber optic networks. M&A activity has been relatively active in recent years, with deal values ranging from tens to hundreds of Millions of USD, primarily aimed at expanding market reach and technological capabilities. Several notable M&A transactions during the historical period resulted in a consolidation of the market share and further increased market concentration.
Telecom Cable Industry Market Dynamics & Trends
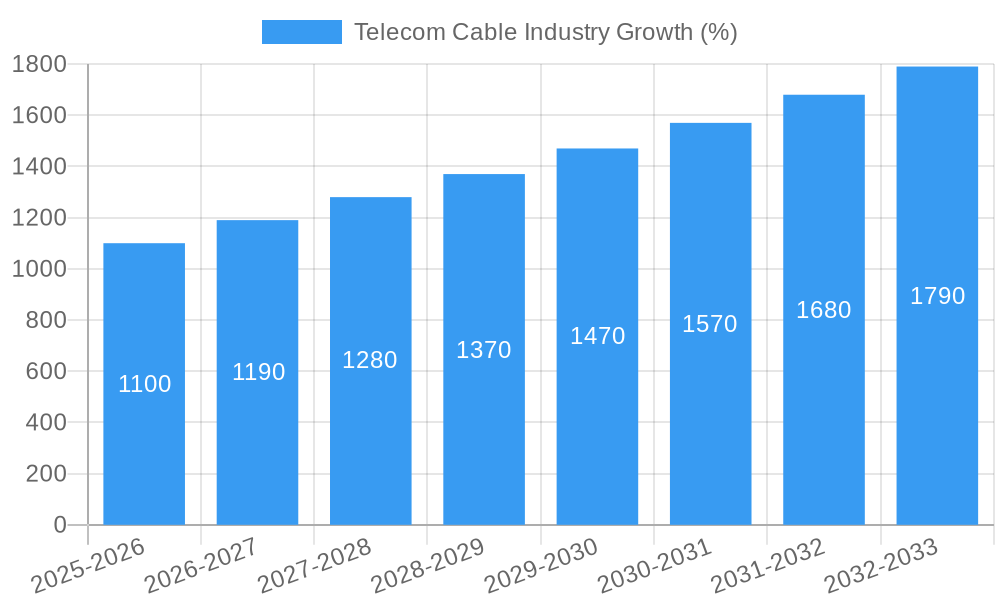
The telecom cable industry is experiencing robust growth, driven by several key factors. The increasing demand for high-speed internet and data services, fueled by the proliferation of smart devices and cloud computing, is a primary growth driver. Technological disruptions, such as the advancements in fiber optic technology and the development of 5G networks, are reshaping market dynamics. Consumer preferences are shifting towards higher bandwidth and more reliable connectivity solutions. Competitive dynamics are intense, with companies vying for market share through product innovation, strategic partnerships, and geographic expansion. The market is estimated to grow at a CAGR of xx% between 2025 and 2033, with significant market penetration expected in developing economies. The overall market size is projected to reach xx Million USD by 2033. Fiber optic cables are expected to dominate the market due to their superior bandwidth capacity, reliability, and increasing affordability.
Dominant Regions & Segments in Telecom Cable Industry
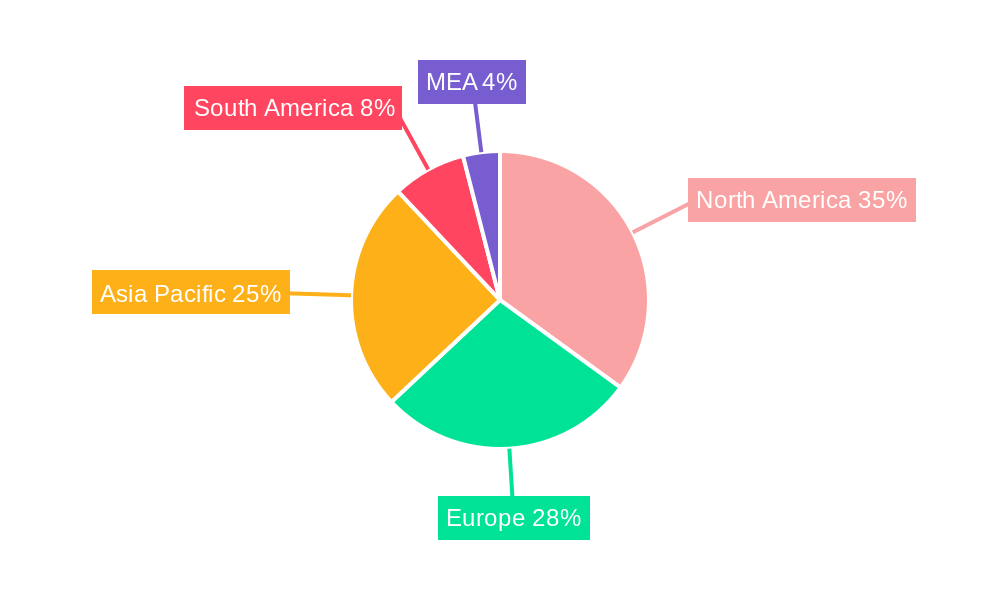
Leading Region: North America and Asia-Pacific are the dominant regions, driven by robust infrastructure investments and the high penetration of internet and mobile services.
Leading Segments (By Type): Fiber optic cables are the leading segment, driven by their superior bandwidth and long-distance transmission capabilities. Data center cables are also experiencing significant growth due to the increasing demand for data center capacity.
Leading Segments (By Application): Telecommunication applications and data centers constitute the largest application segments, reflecting the significant role of cable infrastructure in supporting communication networks and data storage facilities.
Key Drivers:
North America: Government initiatives supporting broadband infrastructure expansion, strong private sector investment in telecommunication networks.
Asia-Pacific: Rapid economic growth, increasing urbanization, rising disposable incomes, and government-led initiatives to expand digital connectivity.
The dominance of these regions and segments is primarily attributed to robust economic growth, favorable regulatory environments, and substantial infrastructure investments.
Telecom Cable Industry Product Innovations
Recent product developments focus on high-bandwidth fiber optic cables, improved shielding for data center cables to minimize signal interference, and environmentally friendly materials to reduce the industry's carbon footprint. These innovations address the growing need for faster, more reliable, and sustainable communication solutions. The development of advanced connectors and splicing technologies enhances the efficiency and cost-effectiveness of cable installations. Such improvements offer significant competitive advantages in terms of performance, reliability, and cost-effectiveness.
Report Scope & Segmentation Analysis
This report segments the telecom cable market by type (Coaxial Cable, Fiber Optic Cable, Data Center Cables, Mobile Networks Cables, Twisted Pair Cable, LAN Cables) and by application (Telecommunication applications, Data Centers, CATV, Computer Network, Others). Each segment exhibits unique growth characteristics, market sizes, and competitive dynamics. The fiber optic cable segment is projected to grow at the fastest rate due to its superior bandwidth capabilities and increasing demand for high-speed data transmission. The data center cable segment is also experiencing significant growth, propelled by the expansion of cloud computing and big data applications.
Key Drivers of Telecom Cable Industry Growth
The growth of the telecom cable industry is fueled by several key factors, including:
- Technological advancements: Development of high-bandwidth fiber optic cables and advanced connector technologies.
- Economic growth: Rising disposable incomes, increasing urbanization, and expanding digital economies in developing countries.
- Government regulations: Government initiatives promoting broadband infrastructure expansion and digital inclusion.
Challenges in the Telecom Cable Industry Sector
The telecom cable industry faces several challenges, including:
- Regulatory hurdles: Navigating complex regulatory frameworks concerning spectrum allocation and environmental compliance can be costly and time-consuming.
- Supply chain issues: Geopolitical instability and disruptions in the supply chain of raw materials can impact production costs and delivery timelines.
- Competitive pressures: Intense competition from alternative technologies and established players necessitates continuous innovation and cost optimization.
Emerging Opportunities in Telecom Cable Industry
Emerging opportunities include:
- Expansion into new markets: Untapped potential exists in developing economies with limited broadband infrastructure.
- Development of new technologies: Innovation in materials science, fiber optics, and network technologies offers opportunities for enhanced performance and efficiency.
- Focus on sustainability: Growing demand for environmentally friendly cable solutions presents opportunities for manufacturers committed to sustainability.
Leading Players in the Telecom Cable Industry Market
- Belden Inc
- LS Cable & System
- Furukawa Electric Co Ltd
- Prysmian Group
- Hitachi Cable America Inc
- Fujikura Ltd
- Leoni AG
- Commscope Inc
- Hengtong Group Co Ltd
- Sumitomo Electric Industries Ltd
Key Developments in Telecom Cable Industry
April 2021: Hitachi Cable America completed the roll-out of CableSuite, an innovative IT platform called CableERP, a comprehensive ERP solution for wire and cable manufacturers based on Microsoft Dynamics D365.
May 2022: Prysmian Group invested an additional USD 30 million (on top of USD 85 million from the previous year) to boost optical fiber cable capacity in North American plants, driven by government stimulus packages.
Future Outlook for Telecom Cable Industry Market
The telecom cable industry is poised for continued growth, driven by ongoing technological advancements, expanding digital economies, and increased investments in broadband infrastructure. Strategic opportunities lie in developing innovative products, expanding into new markets, and capitalizing on the growing demand for high-bandwidth and sustainable cable solutions. The market’s future growth will be shaped by the interplay of technological innovation, regulatory policies, and evolving consumer preferences.
Telecom Cable Industry Segmentation
-
1. Type
- 1.1. Coaxial Cable
- 1.2. Fiber Optic
- 1.3. Data Center Cables
- 1.4. Mobile Networks
- 1.5. Twisted Pair Cable
- 1.6. LAN Cables
-
2. Application
- 2.1. Telecommunication applications
- 2.2. Data Centers
- 2.3. CATV
- 2.4. Computer Network
- 2.5. Others
Telecom Cable Industry Segmentation By Geography
-
1. North America
- 1.1. United States
- 1.2. Canada
- 1.3. Mexico
-
2. Europe
- 2.1. Germany
- 2.2. France
- 2.3. Uk
- 2.4. Rest of Europe
-
3. Asia Pacific
- 3.1. Japan
- 3.2. China
- 3.3. India
- 3.4. Rest of Asia Pacific
- 4. Rest of the World
Telecom Cable Industry REPORT HIGHLIGHTS
| Aspects | Details |
|---|---|
| Study Period | 2019-2033 |
| Base Year | 2024 |
| Estimated Year | 2025 |
| Forecast Period | 2025-2033 |
| Historical Period | 2019-2024 |
| Growth Rate | CAGR of 7.30% from 2019-2033 |
| Segmentation |
|
Table of Contents
- 1. Introduction
- 1.1. Research Scope
- 1.2. Market Segmentation
- 1.3. Research Methodology
- 1.4. Definitions and Assumptions
- 2. Executive Summary
- 2.1. Introduction
- 3. Market Dynamics
- 3.1. Introduction
- 3.2. Market Drivers
- 3.2.1. Rise in the use of Internet and increasing acceptance of smartphones; Increased demand for Internet of Things (IoT)
- 3.3. Market Restrains
- 3.3.1. High cost of operation and maintenance of Telecom Cable
- 3.4. Market Trends
- 3.4.1. Rising Internet Penetration and Adoption of Smartphones
- 4. Market Factor Analysis
- 4.1. Porters Five Forces
- 4.2. Supply/Value Chain
- 4.3. PESTEL analysis
- 4.4. Market Entropy
- 4.5. Patent/Trademark Analysis
- 5. Global Telecom Cable Industry Analysis, Insights and Forecast, 2019-2031
- 5.1. Market Analysis, Insights and Forecast - by Type
- 5.1.1. Coaxial Cable
- 5.1.2. Fiber Optic
- 5.1.3. Data Center Cables
- 5.1.4. Mobile Networks
- 5.1.5. Twisted Pair Cable
- 5.1.6. LAN Cables
- 5.2. Market Analysis, Insights and Forecast - by Application
- 5.2.1. Telecommunication applications
- 5.2.2. Data Centers
- 5.2.3. CATV
- 5.2.4. Computer Network
- 5.2.5. Others
- 5.3. Market Analysis, Insights and Forecast - by Region
- 5.3.1. North America
- 5.3.2. Europe
- 5.3.3. Asia Pacific
- 5.3.4. Rest of the World
- 5.1. Market Analysis, Insights and Forecast - by Type
- 6. North America Telecom Cable Industry Analysis, Insights and Forecast, 2019-2031
- 6.1. Market Analysis, Insights and Forecast - by Type
- 6.1.1. Coaxial Cable
- 6.1.2. Fiber Optic
- 6.1.3. Data Center Cables
- 6.1.4. Mobile Networks
- 6.1.5. Twisted Pair Cable
- 6.1.6. LAN Cables
- 6.2. Market Analysis, Insights and Forecast - by Application
- 6.2.1. Telecommunication applications
- 6.2.2. Data Centers
- 6.2.3. CATV
- 6.2.4. Computer Network
- 6.2.5. Others
- 6.1. Market Analysis, Insights and Forecast - by Type
- 7. Europe Telecom Cable Industry Analysis, Insights and Forecast, 2019-2031
- 7.1. Market Analysis, Insights and Forecast - by Type
- 7.1.1. Coaxial Cable
- 7.1.2. Fiber Optic
- 7.1.3. Data Center Cables
- 7.1.4. Mobile Networks
- 7.1.5. Twisted Pair Cable
- 7.1.6. LAN Cables
- 7.2. Market Analysis, Insights and Forecast - by Application
- 7.2.1. Telecommunication applications
- 7.2.2. Data Centers
- 7.2.3. CATV
- 7.2.4. Computer Network
- 7.2.5. Others
- 7.1. Market Analysis, Insights and Forecast - by Type
- 8. Asia Pacific Telecom Cable Industry Analysis, Insights and Forecast, 2019-2031
- 8.1. Market Analysis, Insights and Forecast - by Type
- 8.1.1. Coaxial Cable
- 8.1.2. Fiber Optic
- 8.1.3. Data Center Cables
- 8.1.4. Mobile Networks
- 8.1.5. Twisted Pair Cable
- 8.1.6. LAN Cables
- 8.2. Market Analysis, Insights and Forecast - by Application
- 8.2.1. Telecommunication applications
- 8.2.2. Data Centers
- 8.2.3. CATV
- 8.2.4. Computer Network
- 8.2.5. Others
- 8.1. Market Analysis, Insights and Forecast - by Type
- 9. Rest of the World Telecom Cable Industry Analysis, Insights and Forecast, 2019-2031
- 9.1. Market Analysis, Insights and Forecast - by Type
- 9.1.1. Coaxial Cable
- 9.1.2. Fiber Optic
- 9.1.3. Data Center Cables
- 9.1.4. Mobile Networks
- 9.1.5. Twisted Pair Cable
- 9.1.6. LAN Cables
- 9.2. Market Analysis, Insights and Forecast - by Application
- 9.2.1. Telecommunication applications
- 9.2.2. Data Centers
- 9.2.3. CATV
- 9.2.4. Computer Network
- 9.2.5. Others
- 9.1. Market Analysis, Insights and Forecast - by Type
- 10. North America Telecom Cable Industry Analysis, Insights and Forecast, 2019-2031
- 10.1. Market Analysis, Insights and Forecast - By Country/Sub-region
- 10.1.1 United States
- 10.1.2 Canada
- 10.1.3 Mexico
- 11. Europe Telecom Cable Industry Analysis, Insights and Forecast, 2019-2031
- 11.1. Market Analysis, Insights and Forecast - By Country/Sub-region
- 11.1.1 Germany
- 11.1.2 United Kingdom
- 11.1.3 France
- 11.1.4 Spain
- 11.1.5 Italy
- 11.1.6 Spain
- 11.1.7 Belgium
- 11.1.8 Netherland
- 11.1.9 Nordics
- 11.1.10 Rest of Europe
- 12. Asia Pacific Telecom Cable Industry Analysis, Insights and Forecast, 2019-2031
- 12.1. Market Analysis, Insights and Forecast - By Country/Sub-region
- 12.1.1 China
- 12.1.2 Japan
- 12.1.3 India
- 12.1.4 South Korea
- 12.1.5 Southeast Asia
- 12.1.6 Australia
- 12.1.7 Indonesia
- 12.1.8 Phillipes
- 12.1.9 Singapore
- 12.1.10 Thailandc
- 12.1.11 Rest of Asia Pacific
- 13. South America Telecom Cable Industry Analysis, Insights and Forecast, 2019-2031
- 13.1. Market Analysis, Insights and Forecast - By Country/Sub-region
- 13.1.1 Brazil
- 13.1.2 Argentina
- 13.1.3 Peru
- 13.1.4 Chile
- 13.1.5 Colombia
- 13.1.6 Ecuador
- 13.1.7 Venezuela
- 13.1.8 Rest of South America
- 14. North America Telecom Cable Industry Analysis, Insights and Forecast, 2019-2031
- 14.1. Market Analysis, Insights and Forecast - By Country/Sub-region
- 14.1.1 United States
- 14.1.2 Canada
- 14.1.3 Mexico
- 15. MEA Telecom Cable Industry Analysis, Insights and Forecast, 2019-2031
- 15.1. Market Analysis, Insights and Forecast - By Country/Sub-region
- 15.1.1 United Arab Emirates
- 15.1.2 Saudi Arabia
- 15.1.3 South Africa
- 15.1.4 Rest of Middle East and Africa
- 16. Competitive Analysis
- 16.1. Global Market Share Analysis 2024
- 16.2. Company Profiles
- 16.2.1 Belden Inc
- 16.2.1.1. Overview
- 16.2.1.2. Products
- 16.2.1.3. SWOT Analysis
- 16.2.1.4. Recent Developments
- 16.2.1.5. Financials (Based on Availability)
- 16.2.2 LS Cable & System
- 16.2.2.1. Overview
- 16.2.2.2. Products
- 16.2.2.3. SWOT Analysis
- 16.2.2.4. Recent Developments
- 16.2.2.5. Financials (Based on Availability)
- 16.2.3 Furukawa Electric Co Ltd
- 16.2.3.1. Overview
- 16.2.3.2. Products
- 16.2.3.3. SWOT Analysis
- 16.2.3.4. Recent Developments
- 16.2.3.5. Financials (Based on Availability)
- 16.2.4 Prysmian Group
- 16.2.4.1. Overview
- 16.2.4.2. Products
- 16.2.4.3. SWOT Analysis
- 16.2.4.4. Recent Developments
- 16.2.4.5. Financials (Based on Availability)
- 16.2.5 Hitachi Cable America Inc
- 16.2.5.1. Overview
- 16.2.5.2. Products
- 16.2.5.3. SWOT Analysis
- 16.2.5.4. Recent Developments
- 16.2.5.5. Financials (Based on Availability)
- 16.2.6 Fujikura Ltd
- 16.2.6.1. Overview
- 16.2.6.2. Products
- 16.2.6.3. SWOT Analysis
- 16.2.6.4. Recent Developments
- 16.2.6.5. Financials (Based on Availability)
- 16.2.7 Leoni AG
- 16.2.7.1. Overview
- 16.2.7.2. Products
- 16.2.7.3. SWOT Analysis
- 16.2.7.4. Recent Developments
- 16.2.7.5. Financials (Based on Availability)
- 16.2.8 Commscope Inc
- 16.2.8.1. Overview
- 16.2.8.2. Products
- 16.2.8.3. SWOT Analysis
- 16.2.8.4. Recent Developments
- 16.2.8.5. Financials (Based on Availability)
- 16.2.9 Hengtong Group Co Ltd
- 16.2.9.1. Overview
- 16.2.9.2. Products
- 16.2.9.3. SWOT Analysis
- 16.2.9.4. Recent Developments
- 16.2.9.5. Financials (Based on Availability)
- 16.2.10 Sumitomo Electric Industries Ltd
- 16.2.10.1. Overview
- 16.2.10.2. Products
- 16.2.10.3. SWOT Analysis
- 16.2.10.4. Recent Developments
- 16.2.10.5. Financials (Based on Availability)
- 16.2.1 Belden Inc
List of Figures
- Figure 1: Global Telecom Cable Industry Revenue Breakdown (Million, %) by Region 2024 & 2032
- Figure 2: North America Telecom Cable Industry Revenue (Million), by Country 2024 & 2032
- Figure 3: North America Telecom Cable Industry Revenue Share (%), by Country 2024 & 2032
- Figure 4: Europe Telecom Cable Industry Revenue (Million), by Country 2024 & 2032
- Figure 5: Europe Telecom Cable Industry Revenue Share (%), by Country 2024 & 2032
- Figure 6: Asia Pacific Telecom Cable Industry Revenue (Million), by Country 2024 & 2032
- Figure 7: Asia Pacific Telecom Cable Industry Revenue Share (%), by Country 2024 & 2032
- Figure 8: South America Telecom Cable Industry Revenue (Million), by Country 2024 & 2032
- Figure 9: South America Telecom Cable Industry Revenue Share (%), by Country 2024 & 2032
- Figure 10: North America Telecom Cable Industry Revenue (Million), by Country 2024 & 2032
- Figure 11: North America Telecom Cable Industry Revenue Share (%), by Country 2024 & 2032
- Figure 12: MEA Telecom Cable Industry Revenue (Million), by Country 2024 & 2032
- Figure 13: MEA Telecom Cable Industry Revenue Share (%), by Country 2024 & 2032
- Figure 14: North America Telecom Cable Industry Revenue (Million), by Type 2024 & 2032
- Figure 15: North America Telecom Cable Industry Revenue Share (%), by Type 2024 & 2032
- Figure 16: North America Telecom Cable Industry Revenue (Million), by Application 2024 & 2032
- Figure 17: North America Telecom Cable Industry Revenue Share (%), by Application 2024 & 2032
- Figure 18: North America Telecom Cable Industry Revenue (Million), by Country 2024 & 2032
- Figure 19: North America Telecom Cable Industry Revenue Share (%), by Country 2024 & 2032
- Figure 20: Europe Telecom Cable Industry Revenue (Million), by Type 2024 & 2032
- Figure 21: Europe Telecom Cable Industry Revenue Share (%), by Type 2024 & 2032
- Figure 22: Europe Telecom Cable Industry Revenue (Million), by Application 2024 & 2032
- Figure 23: Europe Telecom Cable Industry Revenue Share (%), by Application 2024 & 2032
- Figure 24: Europe Telecom Cable Industry Revenue (Million), by Country 2024 & 2032
- Figure 25: Europe Telecom Cable Industry Revenue Share (%), by Country 2024 & 2032
- Figure 26: Asia Pacific Telecom Cable Industry Revenue (Million), by Type 2024 & 2032
- Figure 27: Asia Pacific Telecom Cable Industry Revenue Share (%), by Type 2024 & 2032
- Figure 28: Asia Pacific Telecom Cable Industry Revenue (Million), by Application 2024 & 2032
- Figure 29: Asia Pacific Telecom Cable Industry Revenue Share (%), by Application 2024 & 2032
- Figure 30: Asia Pacific Telecom Cable Industry Revenue (Million), by Country 2024 & 2032
- Figure 31: Asia Pacific Telecom Cable Industry Revenue Share (%), by Country 2024 & 2032
- Figure 32: Rest of the World Telecom Cable Industry Revenue (Million), by Type 2024 & 2032
- Figure 33: Rest of the World Telecom Cable Industry Revenue Share (%), by Type 2024 & 2032
- Figure 34: Rest of the World Telecom Cable Industry Revenue (Million), by Application 2024 & 2032
- Figure 35: Rest of the World Telecom Cable Industry Revenue Share (%), by Application 2024 & 2032
- Figure 36: Rest of the World Telecom Cable Industry Revenue (Million), by Country 2024 & 2032
- Figure 37: Rest of the World Telecom Cable Industry Revenue Share (%), by Country 2024 & 2032
List of Tables
- Table 1: Global Telecom Cable Industry Revenue Million Forecast, by Region 2019 & 2032
- Table 2: Global Telecom Cable Industry Revenue Million Forecast, by Type 2019 & 2032
- Table 3: Global Telecom Cable Industry Revenue Million Forecast, by Application 2019 & 2032
- Table 4: Global Telecom Cable Industry Revenue Million Forecast, by Region 2019 & 2032
- Table 5: Global Telecom Cable Industry Revenue Million Forecast, by Country 2019 & 2032
- Table 6: United States Telecom Cable Industry Revenue (Million) Forecast, by Application 2019 & 2032
- Table 7: Canada Telecom Cable Industry Revenue (Million) Forecast, by Application 2019 & 2032
- Table 8: Mexico Telecom Cable Industry Revenue (Million) Forecast, by Application 2019 & 2032
- Table 9: Global Telecom Cable Industry Revenue Million Forecast, by Country 2019 & 2032
- Table 10: Germany Telecom Cable Industry Revenue (Million) Forecast, by Application 2019 & 2032
- Table 11: United Kingdom Telecom Cable Industry Revenue (Million) Forecast, by Application 2019 & 2032
- Table 12: France Telecom Cable Industry Revenue (Million) Forecast, by Application 2019 & 2032
- Table 13: Spain Telecom Cable Industry Revenue (Million) Forecast, by Application 2019 & 2032
- Table 14: Italy Telecom Cable Industry Revenue (Million) Forecast, by Application 2019 & 2032
- Table 15: Spain Telecom Cable Industry Revenue (Million) Forecast, by Application 2019 & 2032
- Table 16: Belgium Telecom Cable Industry Revenue (Million) Forecast, by Application 2019 & 2032
- Table 17: Netherland Telecom Cable Industry Revenue (Million) Forecast, by Application 2019 & 2032
- Table 18: Nordics Telecom Cable Industry Revenue (Million) Forecast, by Application 2019 & 2032
- Table 19: Rest of Europe Telecom Cable Industry Revenue (Million) Forecast, by Application 2019 & 2032
- Table 20: Global Telecom Cable Industry Revenue Million Forecast, by Country 2019 & 2032
- Table 21: China Telecom Cable Industry Revenue (Million) Forecast, by Application 2019 & 2032
- Table 22: Japan Telecom Cable Industry Revenue (Million) Forecast, by Application 2019 & 2032
- Table 23: India Telecom Cable Industry Revenue (Million) Forecast, by Application 2019 & 2032
- Table 24: South Korea Telecom Cable Industry Revenue (Million) Forecast, by Application 2019 & 2032
- Table 25: Southeast Asia Telecom Cable Industry Revenue (Million) Forecast, by Application 2019 & 2032
- Table 26: Australia Telecom Cable Industry Revenue (Million) Forecast, by Application 2019 & 2032
- Table 27: Indonesia Telecom Cable Industry Revenue (Million) Forecast, by Application 2019 & 2032
- Table 28: Phillipes Telecom Cable Industry Revenue (Million) Forecast, by Application 2019 & 2032
- Table 29: Singapore Telecom Cable Industry Revenue (Million) Forecast, by Application 2019 & 2032
- Table 30: Thailandc Telecom Cable Industry Revenue (Million) Forecast, by Application 2019 & 2032
- Table 31: Rest of Asia Pacific Telecom Cable Industry Revenue (Million) Forecast, by Application 2019 & 2032
- Table 32: Global Telecom Cable Industry Revenue Million Forecast, by Country 2019 & 2032
- Table 33: Brazil Telecom Cable Industry Revenue (Million) Forecast, by Application 2019 & 2032
- Table 34: Argentina Telecom Cable Industry Revenue (Million) Forecast, by Application 2019 & 2032
- Table 35: Peru Telecom Cable Industry Revenue (Million) Forecast, by Application 2019 & 2032
- Table 36: Chile Telecom Cable Industry Revenue (Million) Forecast, by Application 2019 & 2032
- Table 37: Colombia Telecom Cable Industry Revenue (Million) Forecast, by Application 2019 & 2032
- Table 38: Ecuador Telecom Cable Industry Revenue (Million) Forecast, by Application 2019 & 2032
- Table 39: Venezuela Telecom Cable Industry Revenue (Million) Forecast, by Application 2019 & 2032
- Table 40: Rest of South America Telecom Cable Industry Revenue (Million) Forecast, by Application 2019 & 2032
- Table 41: Global Telecom Cable Industry Revenue Million Forecast, by Country 2019 & 2032
- Table 42: United States Telecom Cable Industry Revenue (Million) Forecast, by Application 2019 & 2032
- Table 43: Canada Telecom Cable Industry Revenue (Million) Forecast, by Application 2019 & 2032
- Table 44: Mexico Telecom Cable Industry Revenue (Million) Forecast, by Application 2019 & 2032
- Table 45: Global Telecom Cable Industry Revenue Million Forecast, by Country 2019 & 2032
- Table 46: United Arab Emirates Telecom Cable Industry Revenue (Million) Forecast, by Application 2019 & 2032
- Table 47: Saudi Arabia Telecom Cable Industry Revenue (Million) Forecast, by Application 2019 & 2032
- Table 48: South Africa Telecom Cable Industry Revenue (Million) Forecast, by Application 2019 & 2032
- Table 49: Rest of Middle East and Africa Telecom Cable Industry Revenue (Million) Forecast, by Application 2019 & 2032
- Table 50: Global Telecom Cable Industry Revenue Million Forecast, by Type 2019 & 2032
- Table 51: Global Telecom Cable Industry Revenue Million Forecast, by Application 2019 & 2032
- Table 52: Global Telecom Cable Industry Revenue Million Forecast, by Country 2019 & 2032
- Table 53: United States Telecom Cable Industry Revenue (Million) Forecast, by Application 2019 & 2032
- Table 54: Canada Telecom Cable Industry Revenue (Million) Forecast, by Application 2019 & 2032
- Table 55: Mexico Telecom Cable Industry Revenue (Million) Forecast, by Application 2019 & 2032
- Table 56: Global Telecom Cable Industry Revenue Million Forecast, by Type 2019 & 2032
- Table 57: Global Telecom Cable Industry Revenue Million Forecast, by Application 2019 & 2032
- Table 58: Global Telecom Cable Industry Revenue Million Forecast, by Country 2019 & 2032
- Table 59: Germany Telecom Cable Industry Revenue (Million) Forecast, by Application 2019 & 2032
- Table 60: France Telecom Cable Industry Revenue (Million) Forecast, by Application 2019 & 2032
- Table 61: Uk Telecom Cable Industry Revenue (Million) Forecast, by Application 2019 & 2032
- Table 62: Rest of Europe Telecom Cable Industry Revenue (Million) Forecast, by Application 2019 & 2032
- Table 63: Global Telecom Cable Industry Revenue Million Forecast, by Type 2019 & 2032
- Table 64: Global Telecom Cable Industry Revenue Million Forecast, by Application 2019 & 2032
- Table 65: Global Telecom Cable Industry Revenue Million Forecast, by Country 2019 & 2032
- Table 66: Japan Telecom Cable Industry Revenue (Million) Forecast, by Application 2019 & 2032
- Table 67: China Telecom Cable Industry Revenue (Million) Forecast, by Application 2019 & 2032
- Table 68: India Telecom Cable Industry Revenue (Million) Forecast, by Application 2019 & 2032
- Table 69: Rest of Asia Pacific Telecom Cable Industry Revenue (Million) Forecast, by Application 2019 & 2032
- Table 70: Global Telecom Cable Industry Revenue Million Forecast, by Type 2019 & 2032
- Table 71: Global Telecom Cable Industry Revenue Million Forecast, by Application 2019 & 2032
- Table 72: Global Telecom Cable Industry Revenue Million Forecast, by Country 2019 & 2032
Frequently Asked Questions
1. What is the projected Compound Annual Growth Rate (CAGR) of the Telecom Cable Industry?
The projected CAGR is approximately 7.30%.
2. Which companies are prominent players in the Telecom Cable Industry?
Key companies in the market include Belden Inc, LS Cable & System, Furukawa Electric Co Ltd, Prysmian Group, Hitachi Cable America Inc, Fujikura Ltd, Leoni AG, Commscope Inc, Hengtong Group Co Ltd, Sumitomo Electric Industries Ltd.
3. What are the main segments of the Telecom Cable Industry?
The market segments include Type, Application.
4. Can you provide details about the market size?
The market size is estimated to be USD XX Million as of 2022.
5. What are some drivers contributing to market growth?
Rise in the use of Internet and increasing acceptance of smartphones; Increased demand for Internet of Things (IoT).
6. What are the notable trends driving market growth?
Rising Internet Penetration and Adoption of Smartphones.
7. Are there any restraints impacting market growth?
High cost of operation and maintenance of Telecom Cable.
8. Can you provide examples of recent developments in the market?
April 2021 - Hitachi Cable America completed the roll-out of CableSuite as an innovative IT platform called CableERP. It is the complete ERP solution for wire and cable manufacturers, based on the advanced Microsoft Dynamics D365. It comes with all features that are needed for this specific industry.
9. What pricing options are available for accessing the report?
Pricing options include single-user, multi-user, and enterprise licenses priced at USD 4750, USD 5250, and USD 8750 respectively.
10. Is the market size provided in terms of value or volume?
The market size is provided in terms of value, measured in Million.
11. Are there any specific market keywords associated with the report?
Yes, the market keyword associated with the report is "Telecom Cable Industry," which aids in identifying and referencing the specific market segment covered.
12. How do I determine which pricing option suits my needs best?
The pricing options vary based on user requirements and access needs. Individual users may opt for single-user licenses, while businesses requiring broader access may choose multi-user or enterprise licenses for cost-effective access to the report.
13. Are there any additional resources or data provided in the Telecom Cable Industry report?
While the report offers comprehensive insights, it's advisable to review the specific contents or supplementary materials provided to ascertain if additional resources or data are available.
14. How can I stay updated on further developments or reports in the Telecom Cable Industry?
To stay informed about further developments, trends, and reports in the Telecom Cable Industry, consider subscribing to industry newsletters, following relevant companies and organizations, or regularly checking reputable industry news sources and publications.
Methodology
Step 1 - Identification of Relevant Samples Size from Population Database


Step 2 - Approaches for Defining Global Market Size (Value, Volume* & Price*)

Note*: In applicable scenarios
Step 3 - Data Sources
Primary Research
- Web Analytics
- Survey Reports
- Research Institute
- Latest Research Reports
- Opinion Leaders
Secondary Research
- Annual Reports
- White Paper
- Latest Press Release
- Industry Association
- Paid Database
- Investor Presentations

Step 4 - Data Triangulation
Involves using different sources of information in order to increase the validity of a study
These sources are likely to be stakeholders in a program - participants, other researchers, program staff, other community members, and so on.
Then we put all data in single framework & apply various statistical tools to find out the dynamic on the market.
During the analysis stage, feedback from the stakeholder groups would be compared to determine areas of agreement as well as areas of divergence


