
Key Insights
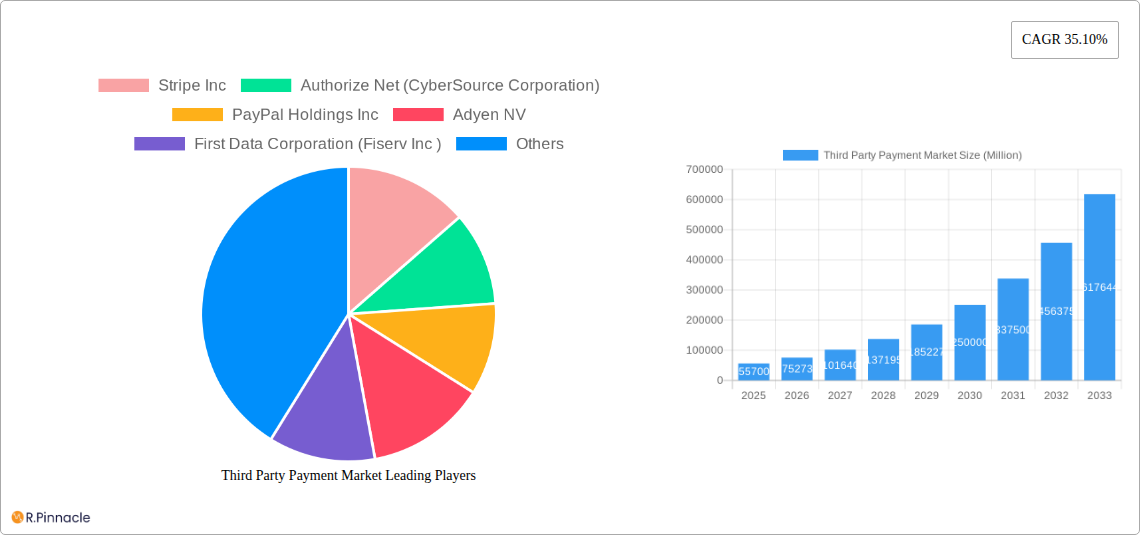
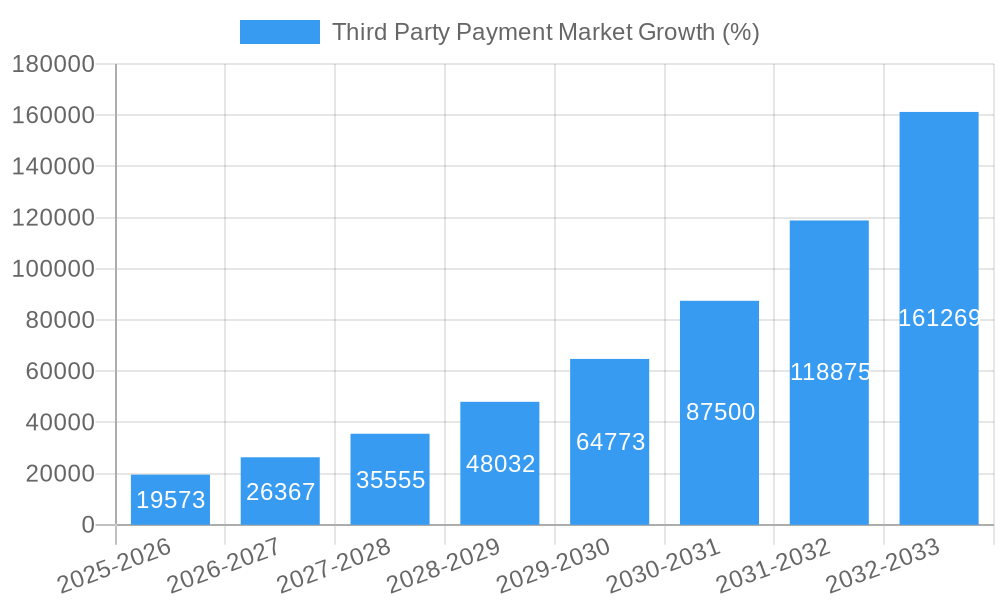
The global third-party payment market, currently valued at $55.70 billion in 2025, is projected to experience robust growth, exhibiting a Compound Annual Growth Rate (CAGR) of 35.10% from 2025 to 2033. This explosive expansion is fueled by several key drivers. The surge in e-commerce and digital transactions, coupled with the increasing adoption of mobile payment solutions and the growing preference for contactless payments, are significantly boosting market demand. Furthermore, the expansion of the financial technology (Fintech) sector and the continuous innovation in payment technologies, such as biometric authentication and blockchain integration, are contributing to market growth. The rising penetration of smartphones and internet access globally, particularly in emerging economies, is further expanding the addressable market for third-party payment providers. While regulatory hurdles and security concerns pose some challenges, the overall market outlook remains exceptionally positive.
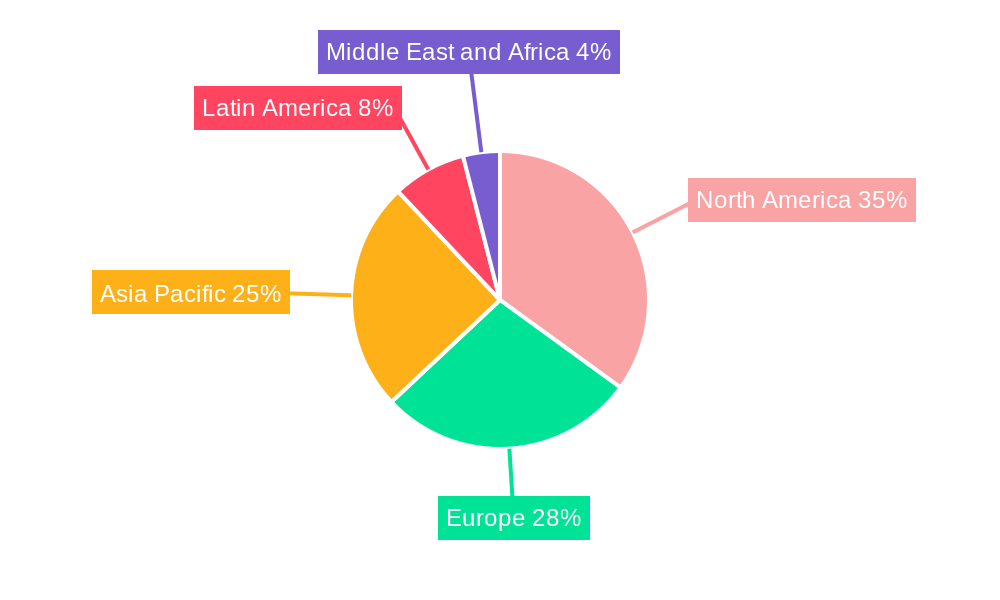
The market segmentation reveals significant opportunities across various types of payment methods and end-user industries. Online and mobile payments dominate the market share, driven by consumer preference for convenience and accessibility. However, point-of-sale (POS) systems continue to maintain a considerable presence, particularly in traditional retail settings. The BFSI (Banking, Financial Services, and Insurance) sector constitutes a major end-user segment, leveraging third-party payment gateways for seamless transaction processing. Retail and e-commerce also drive significant demand, indicating substantial growth potential across all segments. Competitive dynamics are intense, with established players like PayPal, Stripe, and Adyen competing alongside emerging Fintech companies. The market's geographical distribution is diverse, with North America and Europe currently holding significant market shares, but rapid growth is anticipated in the Asia-Pacific region due to its expanding digital economy. This dynamic interplay of factors suggests a future characterized by continued innovation, competition, and significant market expansion.
Third Party Payment Market Report: 2019-2033
This comprehensive report provides a detailed analysis of the Third Party Payment Market, offering invaluable insights for industry professionals, investors, and strategic decision-makers. Covering the period from 2019 to 2033, with a base year of 2025 and a forecast period extending to 2033, this report unveils the market's structure, dynamics, dominant segments, and key players. The market is projected to reach xx Million by 2033, exhibiting a robust CAGR of xx% during the forecast period.
Third Party Payment Market Market Structure & Innovation Trends
The Third Party Payment Market is characterized by a dynamic interplay of established giants and emerging players. Market concentration is moderate, with a few dominant players holding significant market share, while numerous smaller players compete in niche segments. Stripe Inc. and PayPal Holdings Inc. currently hold the largest market shares, estimated at xx% and xx%, respectively, in 2025. Innovation is driven by advancements in mobile technology, increasing demand for secure payment solutions, and the rising adoption of digital wallets. Regulatory frameworks, varying across jurisdictions, significantly impact market dynamics. The increasing prevalence of digital payment methods acts as a substitute for traditional methods, fueling market growth. Recent M&A activities, such as the xx Million acquisition of X by Y in 2024, indicate consolidation trends within the industry. End-user demographics show a strong correlation between younger generations and digital payment adoption.
- Market Share (2025): Stripe Inc. (xx%), PayPal Holdings Inc. (xx%), Adyen NV (xx%), Others (xx%)
- Key Innovation Drivers: Mobile payments, biometric authentication, blockchain technology, AI-powered fraud detection.
- M&A Activity (2019-2024): Total deal value exceeding xx Million.
Third Party Payment Market Market Dynamics & Trends
The Third Party Payment Market is experiencing significant growth fueled by several factors. The increasing penetration of smartphones and internet access globally is a primary driver, leading to higher adoption of mobile and online payment methods. Technological disruptions, such as the emergence of new payment technologies (e.g., cryptocurrencies, BNPL), are transforming the industry landscape. Consumer preference shifts towards contactless and cashless transactions are bolstering market growth. Competitive dynamics are intense, with companies focusing on innovation, partnerships, and geographic expansion to gain a competitive edge. The market penetration of digital payments is increasing steadily, with an estimated xx% of total transactions in 2025, projected to rise to xx% by 2033.
Dominant Regions & Segments in Third Party Payment Market
North America currently holds the largest market share in the Third Party Payment Market, driven by high internet and smartphone penetration, robust e-commerce sector, and advanced technological infrastructure. Within the segments, the online payment method dominates, followed closely by mobile payments. In terms of end-users, the e-commerce sector represents the largest market segment.
- Key Drivers for North America: Strong e-commerce ecosystem, high consumer adoption of digital payments, advanced technological infrastructure.
- Key Drivers for E-commerce Segment: Rapid growth of online retail, increasing consumer preference for online shopping, convenience and ease of use of online payment methods.
Third Party Payment Market Product Innovations
Recent product innovations focus on enhanced security features, improved user experience, and broader payment acceptance. The integration of biometrics, AI-powered fraud detection, and blockchain technology is enhancing security and trust. Companies are focusing on developing seamless payment experiences across various platforms and devices. The market is witnessing the emergence of new payment methods tailored to specific niches, reflecting evolving consumer needs.
Report Scope & Segmentation Analysis
This report segments the Third Party Payment Market by Type (Online, Mobile, Point of Sale) and by End User (BFSI, Retail, E-commerce, Other End User). Each segment's market size, growth projections, and competitive dynamics are analyzed in detail. The Online segment is projected to witness the highest growth rate due to increasing e-commerce adoption. The BFSI sector constitutes a major share of the end-user segment, due to the rising demand for secure and efficient payment processing solutions from financial institutions.
Key Drivers of Third Party Payment Market Growth
The Third Party Payment Market's growth is propelled by several key factors: The increasing adoption of smartphones and internet penetration worldwide fuels the demand for mobile and online payment solutions. Government initiatives promoting digitalization and cashless transactions in various countries contribute significantly. Advancements in technology, such as biometric authentication and AI-driven fraud detection, enhance security and user experience, further driving market expansion.
Challenges in the Third Party Payment Market Sector
The Third Party Payment Market faces challenges such as stringent regulatory compliance requirements that vary across different regions. Data security and privacy concerns pose a significant hurdle, demanding robust security measures. Intense competition from established players and new entrants creates pressure on profit margins. Fraudulent activities and chargebacks represent another significant challenge for companies in this industry.
Emerging Opportunities in Third Party Payment Market
The Third Party Payment Market presents several emerging opportunities. The growing adoption of BNPL (Buy Now, Pay Later) solutions is creating a lucrative niche. The expansion into underserved markets and developing economies offers significant potential. Integration with emerging technologies, such as blockchain and AI, offers opportunities for innovation and competitive advantage.
Leading Players in the Third Party Payment Market Market
- Stripe Inc
- Authorize.Net (CyberSource Corporation)
- PayPal Holdings Inc
- Adyen NV
- First Data Corporation (Fiserv Inc)
- Amazon Payments Inc
- Alipay com Co Ltd
- 2checkout Com Inc (Avangate BV)
- One 97 Communications Limite
- WePay Inc (JPMorgan Chase & Co)
Key Developments in Third Party Payment Market Industry
- October 2023: PayPal Holdings Inc. announced integration with Apple Wallet, enhancing payment convenience.
- May 2023: Stripe Inc. partnered with Lotus, enhancing the customer experience in electric vehicle sales.
Future Outlook for Third Party Payment Market Market
The Third Party Payment Market is poised for continued growth, driven by technological advancements, expanding digital adoption, and evolving consumer preferences. Strategic partnerships, product innovation, and geographic expansion will be crucial for companies to succeed in this highly competitive market. The increasing focus on security and regulatory compliance will shape the industry's future trajectory.
Third Party Payment Market Segmentation
-
1. Type
- 1.1. Online
- 1.2. Mobile
- 1.3. Point of Sale
-
2. End User
- 2.1. BFSI
- 2.2. Retail
- 2.3. E-Commerce
- 2.4. Other End Users
Third Party Payment Market Segmentation By Geography
- 1. North America
- 2. Europe
- 3. Asia
- 4. Australia and New Zealand
- 5. Latin America
- 6. Middle East and Africa
Third Party Payment Market REPORT HIGHLIGHTS
| Aspects | Details |
|---|---|
| Study Period | 2019-2033 |
| Base Year | 2024 |
| Estimated Year | 2025 |
| Forecast Period | 2025-2033 |
| Historical Period | 2019-2024 |
| Growth Rate | CAGR of 35.10% from 2019-2033 |
| Segmentation |
|
Table of Contents
- 1. Introduction
- 1.1. Research Scope
- 1.2. Market Segmentation
- 1.3. Research Methodology
- 1.4. Definitions and Assumptions
- 2. Executive Summary
- 2.1. Introduction
- 3. Market Dynamics
- 3.1. Introduction
- 3.2. Market Drivers
- 3.2.1. Penetration of Internet Leading to Proliferation of Digital Payments; Cloud Based Systems Leading to Growth of B2B Sales and also Higher Sales in the POS Segment; Growth of E-Commerce Across the High Growth Regions of the World
- 3.3. Market Restrains
- 3.3.1. Security and Privacy Concerns to Restrain the Market
- 3.4. Market Trends
- 3.4.1. The Point of Sale Segment is Expected to Drive the Market
- 4. Market Factor Analysis
- 4.1. Porters Five Forces
- 4.2. Supply/Value Chain
- 4.3. PESTEL analysis
- 4.4. Market Entropy
- 4.5. Patent/Trademark Analysis
- 5. Global Third Party Payment Market Analysis, Insights and Forecast, 2019-2031
- 5.1. Market Analysis, Insights and Forecast - by Type
- 5.1.1. Online
- 5.1.2. Mobile
- 5.1.3. Point of Sale
- 5.2. Market Analysis, Insights and Forecast - by End User
- 5.2.1. BFSI
- 5.2.2. Retail
- 5.2.3. E-Commerce
- 5.2.4. Other End Users
- 5.3. Market Analysis, Insights and Forecast - by Region
- 5.3.1. North America
- 5.3.2. Europe
- 5.3.3. Asia
- 5.3.4. Australia and New Zealand
- 5.3.5. Latin America
- 5.3.6. Middle East and Africa
- 5.1. Market Analysis, Insights and Forecast - by Type
- 6. North America Third Party Payment Market Analysis, Insights and Forecast, 2019-2031
- 6.1. Market Analysis, Insights and Forecast - by Type
- 6.1.1. Online
- 6.1.2. Mobile
- 6.1.3. Point of Sale
- 6.2. Market Analysis, Insights and Forecast - by End User
- 6.2.1. BFSI
- 6.2.2. Retail
- 6.2.3. E-Commerce
- 6.2.4. Other End Users
- 6.1. Market Analysis, Insights and Forecast - by Type
- 7. Europe Third Party Payment Market Analysis, Insights and Forecast, 2019-2031
- 7.1. Market Analysis, Insights and Forecast - by Type
- 7.1.1. Online
- 7.1.2. Mobile
- 7.1.3. Point of Sale
- 7.2. Market Analysis, Insights and Forecast - by End User
- 7.2.1. BFSI
- 7.2.2. Retail
- 7.2.3. E-Commerce
- 7.2.4. Other End Users
- 7.1. Market Analysis, Insights and Forecast - by Type
- 8. Asia Third Party Payment Market Analysis, Insights and Forecast, 2019-2031
- 8.1. Market Analysis, Insights and Forecast - by Type
- 8.1.1. Online
- 8.1.2. Mobile
- 8.1.3. Point of Sale
- 8.2. Market Analysis, Insights and Forecast - by End User
- 8.2.1. BFSI
- 8.2.2. Retail
- 8.2.3. E-Commerce
- 8.2.4. Other End Users
- 8.1. Market Analysis, Insights and Forecast - by Type
- 9. Australia and New Zealand Third Party Payment Market Analysis, Insights and Forecast, 2019-2031
- 9.1. Market Analysis, Insights and Forecast - by Type
- 9.1.1. Online
- 9.1.2. Mobile
- 9.1.3. Point of Sale
- 9.2. Market Analysis, Insights and Forecast - by End User
- 9.2.1. BFSI
- 9.2.2. Retail
- 9.2.3. E-Commerce
- 9.2.4. Other End Users
- 9.1. Market Analysis, Insights and Forecast - by Type
- 10. Latin America Third Party Payment Market Analysis, Insights and Forecast, 2019-2031
- 10.1. Market Analysis, Insights and Forecast - by Type
- 10.1.1. Online
- 10.1.2. Mobile
- 10.1.3. Point of Sale
- 10.2. Market Analysis, Insights and Forecast - by End User
- 10.2.1. BFSI
- 10.2.2. Retail
- 10.2.3. E-Commerce
- 10.2.4. Other End Users
- 10.1. Market Analysis, Insights and Forecast - by Type
- 11. Middle East and Africa Third Party Payment Market Analysis, Insights and Forecast, 2019-2031
- 11.1. Market Analysis, Insights and Forecast - by Type
- 11.1.1. Online
- 11.1.2. Mobile
- 11.1.3. Point of Sale
- 11.2. Market Analysis, Insights and Forecast - by End User
- 11.2.1. BFSI
- 11.2.2. Retail
- 11.2.3. E-Commerce
- 11.2.4. Other End Users
- 11.1. Market Analysis, Insights and Forecast - by Type
- 12. North America Third Party Payment Market Analysis, Insights and Forecast, 2019-2031
- 12.1. Market Analysis, Insights and Forecast - By Country/Sub-region
- 12.1.1.
- 13. Europe Third Party Payment Market Analysis, Insights and Forecast, 2019-2031
- 13.1. Market Analysis, Insights and Forecast - By Country/Sub-region
- 13.1.1.
- 14. Asia Pacific Third Party Payment Market Analysis, Insights and Forecast, 2019-2031
- 14.1. Market Analysis, Insights and Forecast - By Country/Sub-region
- 14.1.1.
- 15. Latin America Third Party Payment Market Analysis, Insights and Forecast, 2019-2031
- 15.1. Market Analysis, Insights and Forecast - By Country/Sub-region
- 15.1.1.
- 16. Middle East and Africa Third Party Payment Market Analysis, Insights and Forecast, 2019-2031
- 16.1. Market Analysis, Insights and Forecast - By Country/Sub-region
- 16.1.1.
- 17. Competitive Analysis
- 17.1. Global Market Share Analysis 2024
- 17.2. Company Profiles
- 17.2.1 Stripe Inc
- 17.2.1.1. Overview
- 17.2.1.2. Products
- 17.2.1.3. SWOT Analysis
- 17.2.1.4. Recent Developments
- 17.2.1.5. Financials (Based on Availability)
- 17.2.2 Authorize Net (CyberSource Corporation)
- 17.2.2.1. Overview
- 17.2.2.2. Products
- 17.2.2.3. SWOT Analysis
- 17.2.2.4. Recent Developments
- 17.2.2.5. Financials (Based on Availability)
- 17.2.3 PayPal Holdings Inc
- 17.2.3.1. Overview
- 17.2.3.2. Products
- 17.2.3.3. SWOT Analysis
- 17.2.3.4. Recent Developments
- 17.2.3.5. Financials (Based on Availability)
- 17.2.4 Adyen NV
- 17.2.4.1. Overview
- 17.2.4.2. Products
- 17.2.4.3. SWOT Analysis
- 17.2.4.4. Recent Developments
- 17.2.4.5. Financials (Based on Availability)
- 17.2.5 First Data Corporation (Fiserv Inc )
- 17.2.5.1. Overview
- 17.2.5.2. Products
- 17.2.5.3. SWOT Analysis
- 17.2.5.4. Recent Developments
- 17.2.5.5. Financials (Based on Availability)
- 17.2.6 Amazon Payments Inc
- 17.2.6.1. Overview
- 17.2.6.2. Products
- 17.2.6.3. SWOT Analysis
- 17.2.6.4. Recent Developments
- 17.2.6.5. Financials (Based on Availability)
- 17.2.7 Alipay com Co Ltd
- 17.2.7.1. Overview
- 17.2.7.2. Products
- 17.2.7.3. SWOT Analysis
- 17.2.7.4. Recent Developments
- 17.2.7.5. Financials (Based on Availability)
- 17.2.8 2checkout Com Inc (Avangate BV)
- 17.2.8.1. Overview
- 17.2.8.2. Products
- 17.2.8.3. SWOT Analysis
- 17.2.8.4. Recent Developments
- 17.2.8.5. Financials (Based on Availability)
- 17.2.9 One 97 Communications Limite
- 17.2.9.1. Overview
- 17.2.9.2. Products
- 17.2.9.3. SWOT Analysis
- 17.2.9.4. Recent Developments
- 17.2.9.5. Financials (Based on Availability)
- 17.2.10 WePay Inc (JPMorgan Chase & Co )
- 17.2.10.1. Overview
- 17.2.10.2. Products
- 17.2.10.3. SWOT Analysis
- 17.2.10.4. Recent Developments
- 17.2.10.5. Financials (Based on Availability)
- 17.2.1 Stripe Inc
List of Figures
- Figure 1: Global Third Party Payment Market Revenue Breakdown (Million, %) by Region 2024 & 2032
- Figure 2: North America Third Party Payment Market Revenue (Million), by Country 2024 & 2032
- Figure 3: North America Third Party Payment Market Revenue Share (%), by Country 2024 & 2032
- Figure 4: Europe Third Party Payment Market Revenue (Million), by Country 2024 & 2032
- Figure 5: Europe Third Party Payment Market Revenue Share (%), by Country 2024 & 2032
- Figure 6: Asia Pacific Third Party Payment Market Revenue (Million), by Country 2024 & 2032
- Figure 7: Asia Pacific Third Party Payment Market Revenue Share (%), by Country 2024 & 2032
- Figure 8: Latin America Third Party Payment Market Revenue (Million), by Country 2024 & 2032
- Figure 9: Latin America Third Party Payment Market Revenue Share (%), by Country 2024 & 2032
- Figure 10: Middle East and Africa Third Party Payment Market Revenue (Million), by Country 2024 & 2032
- Figure 11: Middle East and Africa Third Party Payment Market Revenue Share (%), by Country 2024 & 2032
- Figure 12: North America Third Party Payment Market Revenue (Million), by Type 2024 & 2032
- Figure 13: North America Third Party Payment Market Revenue Share (%), by Type 2024 & 2032
- Figure 14: North America Third Party Payment Market Revenue (Million), by End User 2024 & 2032
- Figure 15: North America Third Party Payment Market Revenue Share (%), by End User 2024 & 2032
- Figure 16: North America Third Party Payment Market Revenue (Million), by Country 2024 & 2032
- Figure 17: North America Third Party Payment Market Revenue Share (%), by Country 2024 & 2032
- Figure 18: Europe Third Party Payment Market Revenue (Million), by Type 2024 & 2032
- Figure 19: Europe Third Party Payment Market Revenue Share (%), by Type 2024 & 2032
- Figure 20: Europe Third Party Payment Market Revenue (Million), by End User 2024 & 2032
- Figure 21: Europe Third Party Payment Market Revenue Share (%), by End User 2024 & 2032
- Figure 22: Europe Third Party Payment Market Revenue (Million), by Country 2024 & 2032
- Figure 23: Europe Third Party Payment Market Revenue Share (%), by Country 2024 & 2032
- Figure 24: Asia Third Party Payment Market Revenue (Million), by Type 2024 & 2032
- Figure 25: Asia Third Party Payment Market Revenue Share (%), by Type 2024 & 2032
- Figure 26: Asia Third Party Payment Market Revenue (Million), by End User 2024 & 2032
- Figure 27: Asia Third Party Payment Market Revenue Share (%), by End User 2024 & 2032
- Figure 28: Asia Third Party Payment Market Revenue (Million), by Country 2024 & 2032
- Figure 29: Asia Third Party Payment Market Revenue Share (%), by Country 2024 & 2032
- Figure 30: Australia and New Zealand Third Party Payment Market Revenue (Million), by Type 2024 & 2032
- Figure 31: Australia and New Zealand Third Party Payment Market Revenue Share (%), by Type 2024 & 2032
- Figure 32: Australia and New Zealand Third Party Payment Market Revenue (Million), by End User 2024 & 2032
- Figure 33: Australia and New Zealand Third Party Payment Market Revenue Share (%), by End User 2024 & 2032
- Figure 34: Australia and New Zealand Third Party Payment Market Revenue (Million), by Country 2024 & 2032
- Figure 35: Australia and New Zealand Third Party Payment Market Revenue Share (%), by Country 2024 & 2032
- Figure 36: Latin America Third Party Payment Market Revenue (Million), by Type 2024 & 2032
- Figure 37: Latin America Third Party Payment Market Revenue Share (%), by Type 2024 & 2032
- Figure 38: Latin America Third Party Payment Market Revenue (Million), by End User 2024 & 2032
- Figure 39: Latin America Third Party Payment Market Revenue Share (%), by End User 2024 & 2032
- Figure 40: Latin America Third Party Payment Market Revenue (Million), by Country 2024 & 2032
- Figure 41: Latin America Third Party Payment Market Revenue Share (%), by Country 2024 & 2032
- Figure 42: Middle East and Africa Third Party Payment Market Revenue (Million), by Type 2024 & 2032
- Figure 43: Middle East and Africa Third Party Payment Market Revenue Share (%), by Type 2024 & 2032
- Figure 44: Middle East and Africa Third Party Payment Market Revenue (Million), by End User 2024 & 2032
- Figure 45: Middle East and Africa Third Party Payment Market Revenue Share (%), by End User 2024 & 2032
- Figure 46: Middle East and Africa Third Party Payment Market Revenue (Million), by Country 2024 & 2032
- Figure 47: Middle East and Africa Third Party Payment Market Revenue Share (%), by Country 2024 & 2032
List of Tables
- Table 1: Global Third Party Payment Market Revenue Million Forecast, by Region 2019 & 2032
- Table 2: Global Third Party Payment Market Revenue Million Forecast, by Type 2019 & 2032
- Table 3: Global Third Party Payment Market Revenue Million Forecast, by End User 2019 & 2032
- Table 4: Global Third Party Payment Market Revenue Million Forecast, by Region 2019 & 2032
- Table 5: Global Third Party Payment Market Revenue Million Forecast, by Country 2019 & 2032
- Table 6: Third Party Payment Market Revenue (Million) Forecast, by Application 2019 & 2032
- Table 7: Global Third Party Payment Market Revenue Million Forecast, by Country 2019 & 2032
- Table 8: Third Party Payment Market Revenue (Million) Forecast, by Application 2019 & 2032
- Table 9: Global Third Party Payment Market Revenue Million Forecast, by Country 2019 & 2032
- Table 10: Third Party Payment Market Revenue (Million) Forecast, by Application 2019 & 2032
- Table 11: Global Third Party Payment Market Revenue Million Forecast, by Country 2019 & 2032
- Table 12: Third Party Payment Market Revenue (Million) Forecast, by Application 2019 & 2032
- Table 13: Global Third Party Payment Market Revenue Million Forecast, by Country 2019 & 2032
- Table 14: Third Party Payment Market Revenue (Million) Forecast, by Application 2019 & 2032
- Table 15: Global Third Party Payment Market Revenue Million Forecast, by Type 2019 & 2032
- Table 16: Global Third Party Payment Market Revenue Million Forecast, by End User 2019 & 2032
- Table 17: Global Third Party Payment Market Revenue Million Forecast, by Country 2019 & 2032
- Table 18: Global Third Party Payment Market Revenue Million Forecast, by Type 2019 & 2032
- Table 19: Global Third Party Payment Market Revenue Million Forecast, by End User 2019 & 2032
- Table 20: Global Third Party Payment Market Revenue Million Forecast, by Country 2019 & 2032
- Table 21: Global Third Party Payment Market Revenue Million Forecast, by Type 2019 & 2032
- Table 22: Global Third Party Payment Market Revenue Million Forecast, by End User 2019 & 2032
- Table 23: Global Third Party Payment Market Revenue Million Forecast, by Country 2019 & 2032
- Table 24: Global Third Party Payment Market Revenue Million Forecast, by Type 2019 & 2032
- Table 25: Global Third Party Payment Market Revenue Million Forecast, by End User 2019 & 2032
- Table 26: Global Third Party Payment Market Revenue Million Forecast, by Country 2019 & 2032
- Table 27: Global Third Party Payment Market Revenue Million Forecast, by Type 2019 & 2032
- Table 28: Global Third Party Payment Market Revenue Million Forecast, by End User 2019 & 2032
- Table 29: Global Third Party Payment Market Revenue Million Forecast, by Country 2019 & 2032
- Table 30: Global Third Party Payment Market Revenue Million Forecast, by Type 2019 & 2032
- Table 31: Global Third Party Payment Market Revenue Million Forecast, by End User 2019 & 2032
- Table 32: Global Third Party Payment Market Revenue Million Forecast, by Country 2019 & 2032
Frequently Asked Questions
1. What is the projected Compound Annual Growth Rate (CAGR) of the Third Party Payment Market?
The projected CAGR is approximately 35.10%.
2. Which companies are prominent players in the Third Party Payment Market?
Key companies in the market include Stripe Inc, Authorize Net (CyberSource Corporation), PayPal Holdings Inc, Adyen NV, First Data Corporation (Fiserv Inc ), Amazon Payments Inc, Alipay com Co Ltd, 2checkout Com Inc (Avangate BV), One 97 Communications Limite, WePay Inc (JPMorgan Chase & Co ).
3. What are the main segments of the Third Party Payment Market?
The market segments include Type, End User.
4. Can you provide details about the market size?
The market size is estimated to be USD 55.70 Million as of 2022.
5. What are some drivers contributing to market growth?
Penetration of Internet Leading to Proliferation of Digital Payments; Cloud Based Systems Leading to Growth of B2B Sales and also Higher Sales in the POS Segment; Growth of E-Commerce Across the High Growth Regions of the World.
6. What are the notable trends driving market growth?
The Point of Sale Segment is Expected to Drive the Market.
7. Are there any restraints impacting market growth?
Security and Privacy Concerns to Restrain the Market.
8. Can you provide examples of recent developments in the market?
October 2023: PayPal Holdings Inc. announced that customers can add their eligible PayPal and Venmo credit or debit cards to Apple Wallet and begin making payments. Customers can tap their iPhone and Apple Watch. PayPal and Venmo credit or debit card holders can make payments quickly and securely in-store, online, or on their favorite apps using Apple Pay.
9. What pricing options are available for accessing the report?
Pricing options include single-user, multi-user, and enterprise licenses priced at USD 4750, USD 5250, and USD 8750 respectively.
10. Is the market size provided in terms of value or volume?
The market size is provided in terms of value, measured in Million.
11. Are there any specific market keywords associated with the report?
Yes, the market keyword associated with the report is "Third Party Payment Market," which aids in identifying and referencing the specific market segment covered.
12. How do I determine which pricing option suits my needs best?
The pricing options vary based on user requirements and access needs. Individual users may opt for single-user licenses, while businesses requiring broader access may choose multi-user or enterprise licenses for cost-effective access to the report.
13. Are there any additional resources or data provided in the Third Party Payment Market report?
While the report offers comprehensive insights, it's advisable to review the specific contents or supplementary materials provided to ascertain if additional resources or data are available.
14. How can I stay updated on further developments or reports in the Third Party Payment Market?
To stay informed about further developments, trends, and reports in the Third Party Payment Market, consider subscribing to industry newsletters, following relevant companies and organizations, or regularly checking reputable industry news sources and publications.
Methodology
Step 1 - Identification of Relevant Samples Size from Population Database


Step 2 - Approaches for Defining Global Market Size (Value, Volume* & Price*)

Note*: In applicable scenarios
Step 3 - Data Sources
Primary Research
- Web Analytics
- Survey Reports
- Research Institute
- Latest Research Reports
- Opinion Leaders
Secondary Research
- Annual Reports
- White Paper
- Latest Press Release
- Industry Association
- Paid Database
- Investor Presentations

Step 4 - Data Triangulation
Involves using different sources of information in order to increase the validity of a study
These sources are likely to be stakeholders in a program - participants, other researchers, program staff, other community members, and so on.
Then we put all data in single framework & apply various statistical tools to find out the dynamic on the market.
During the analysis stage, feedback from the stakeholder groups would be compared to determine areas of agreement as well as areas of divergence


