
Key Insights
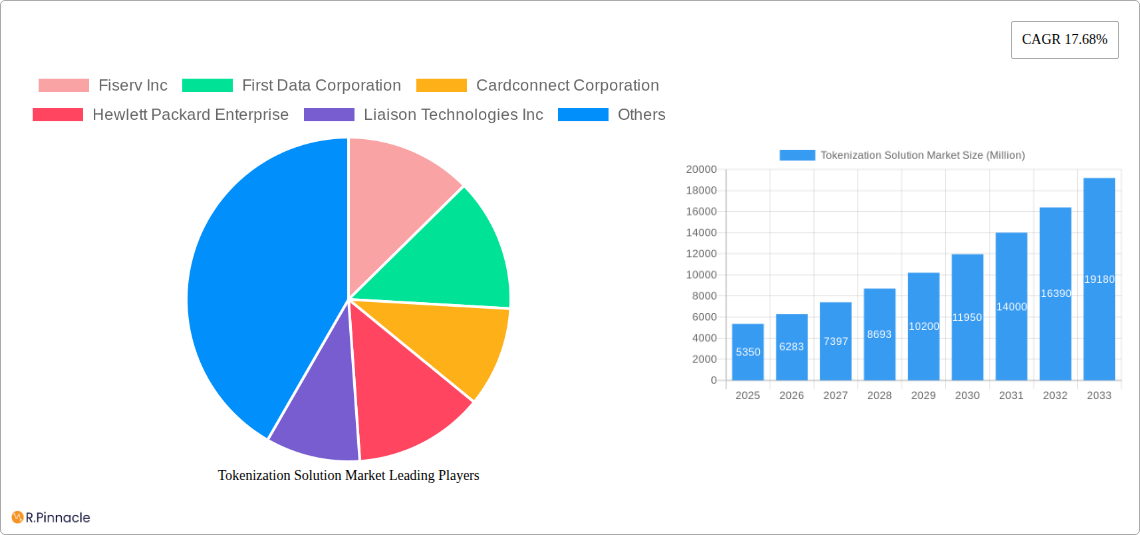
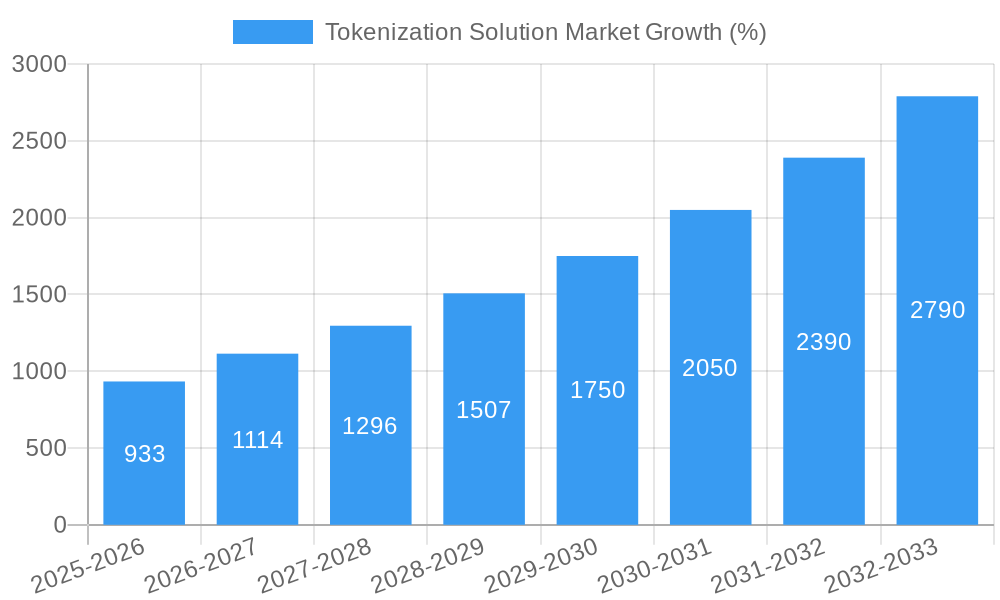
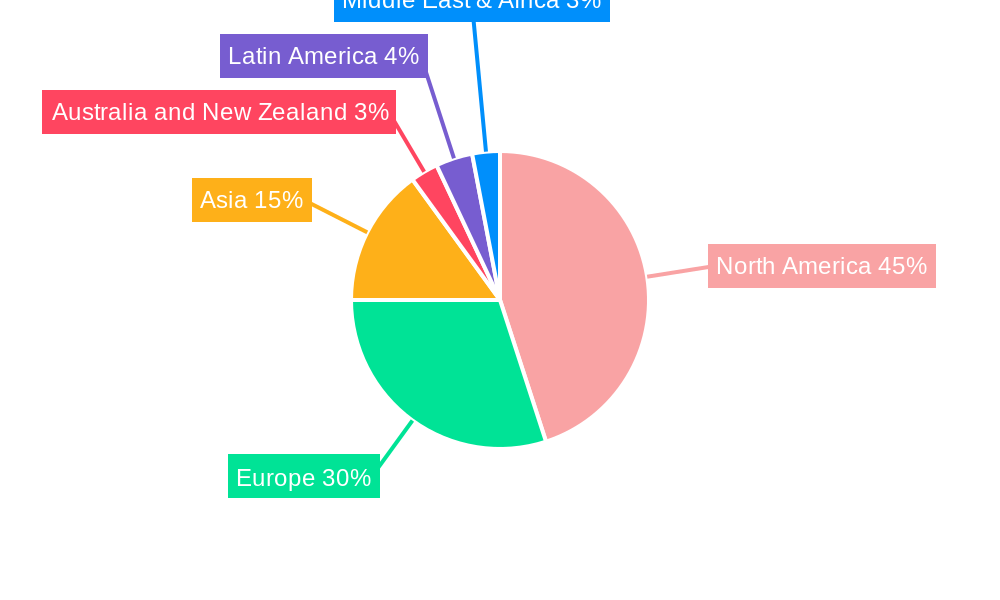
The Tokenization Solution Market is experiencing robust growth, projected to reach $5.35 billion in 2025 and maintain a Compound Annual Growth Rate (CAGR) of 17.68% from 2025 to 2033. This expansion is driven by several key factors. Increasing concerns about data breaches and the rising adoption of cloud-based solutions are fueling demand for secure data management practices. The financial services industry (BFSI), retail & e-commerce, and healthcare sectors are significant adopters, leveraging tokenization to protect sensitive customer information like credit card details and personal health records. Regulations like GDPR and CCPA are further incentivizing businesses to adopt robust data protection strategies, boosting the market. The market is segmented by type (solutions and services) and deployment (on-premise and cloud), with the cloud segment anticipated to dominate due to its scalability, cost-effectiveness, and accessibility. Leading companies like Fiserv, First Data, and others are actively developing and deploying innovative tokenization solutions, driving competition and fostering market innovation. Geographical expansion is also a significant contributing factor, with North America currently holding a substantial market share, followed by Europe and Asia. However, increasing awareness and adoption in developing regions present significant growth opportunities in the coming years.
The market's continued growth is expected to be influenced by advancements in technology, particularly in areas such as artificial intelligence (AI) and blockchain. Integration of AI can improve the efficiency and effectiveness of tokenization solutions, while blockchain can further enhance security and transparency. However, challenges remain, such as the initial investment costs associated with implementing tokenization systems and the need for skilled professionals to manage and maintain these solutions. Nevertheless, the overall market outlook remains positive, driven by the increasing need for robust data security measures in a rapidly digitizing world. The competitive landscape is dynamic, with existing players focusing on strategic partnerships and acquisitions to expand their market reach and service offerings. The long-term forecast suggests consistent growth, fueled by continuous technological advancements and the ongoing need for data protection across diverse industries.
Tokenization Solution Market: A Comprehensive Report (2019-2033)
This in-depth report provides a comprehensive analysis of the Tokenization Solution Market, offering invaluable insights for industry professionals, investors, and strategists. Covering the period from 2019 to 2033, with a focus on 2025, this report meticulously examines market dynamics, key players, and future growth potential. The market is projected to reach xx Million by 2033, showcasing significant growth opportunities.
Tokenization Solution Market Market Structure & Innovation Trends
The Tokenization Solution Market exhibits a moderately fragmented structure with several key players vying for market share. While precise market share figures for individual companies remain proprietary, major players like Fiserv Inc, First Data Corporation, and others mentioned below, command significant portions of the market. The market's concentration is further analyzed within the full report, including metrics like market share and M&A deal values (estimated at xx Million in total for the period 2019-2024). Innovation is driven by the increasing need for enhanced security, improved efficiency, and regulatory compliance across various industries. Key innovation drivers include:
- Advancements in blockchain technology: Enabling secure and transparent tokenization processes.
- Growing adoption of cloud computing: Facilitating scalability and accessibility of tokenization solutions.
- Stringent data privacy regulations: Driving the demand for secure tokenization methods.
Mergers and acquisitions (M&A) activities play a significant role in shaping market dynamics, with several strategic acquisitions reported within the studied period (detailed analysis available in the full report). Substitute products, mainly legacy security solutions, are gradually being replaced due to the limitations in security and efficiency provided by tokenization. The end-user demographic is diversified, encompassing various industries, including BFSI, healthcare, and government sectors, each with unique needs and adoption rates (detailed demographics are included in the full report).
Tokenization Solution Market Market Dynamics & Trends
The Tokenization Solution Market is experiencing robust growth, propelled by several key factors. The Compound Annual Growth Rate (CAGR) for the forecast period (2025-2033) is estimated at xx%, driven by factors such as:
- Increasing adoption of digital transactions: Across various sectors boosting the demand for secure solutions.
- Rising concerns about data security and privacy: Driving the adoption of tokenization for safeguarding sensitive information.
- Expansion of regulatory frameworks: Mandating enhanced security measures across different industries.
Technological disruptions, particularly the advancements in blockchain and artificial intelligence (AI), are reshaping the competitive landscape. Consumer preferences are shifting towards secure and efficient solutions, leading to greater adoption of tokenization across different industries. Market penetration varies significantly across different segments and regions, with the BFSI sector exhibiting high adoption rates, as elaborated in the full report.
Dominant Regions & Segments in Tokenization Solution Market
The North American region currently dominates the Tokenization Solution Market, followed by Europe and Asia-Pacific. This dominance is largely attributed to:
- Stronger regulatory frameworks: Encouraging the adoption of tokenization technologies.
- High level of technological advancement: Facilitating faster implementation and innovation.
- Early adoption of blockchain technologies: Contributing to faster growth in the region.
Dominant Segments:
- By Type: Solutions segment leads, driven by high demand for versatile and robust offerings.
- By Deployment: The Cloud segment is exhibiting rapid growth due to its scalability and cost-effectiveness.
- By End-User Industry: BFSI (Banking, Financial Services, and Insurance) and Retail & E-commerce sectors are the leading adopters, due to high volume transactions and the need for security and compliance.
Detailed regional and segmental breakdowns, including key drivers such as economic policies and infrastructure development, are available in the full report.
Tokenization Solution Market Product Innovations
Recent product innovations include enhanced security features, improved interoperability with existing systems, and integrated AI-powered analytics for better risk management and fraud detection. These innovations are driven by the need for secure, efficient, and scalable solutions that meet the evolving needs of different industries. Key advancements align with industry trends toward greater automation, data privacy, and regulatory compliance.
Report Scope & Segmentation Analysis
This report covers the Tokenization Solution Market across various segments:
- By Type: Solutions and Services, with growth projections and competitive dynamics outlined for each.
- By Deployment: On-Premise and Cloud, detailing market size and growth opportunities.
- By End-User Industry: Retail & E-commerce, Transportation & Logistics, BFSI, IT & Telecommunications, Healthcare, Government, Energy & Utilities, and Other End-User Industries, each with specific market size estimates and competitive landscapes.
Key Drivers of Tokenization Solution Market Growth
Several factors are driving the growth of the Tokenization Solution Market:
- Increased demand for secure data management: Amidst growing cyber threats.
- Rising adoption of digital currencies and crypto assets: Further driving the need for robust tokenization technologies.
- Growing regulatory scrutiny: Mandating improved data protection and transparency.
Challenges in the Tokenization Solution Market Sector
The Tokenization Solution Market faces challenges such as:
- High initial investment costs: Potentially hindering widespread adoption.
- Lack of standardization and interoperability: Across different platforms and systems.
- Concerns about scalability and performance: Especially with increasing transaction volumes.
Emerging Opportunities in Tokenization Solution Market
Emerging opportunities include:
- Integration with emerging technologies: Like IoT and AI.
- Expansion into new markets: Particularly in developing economies.
- Development of specialized tokenization solutions: For specific industries with unique security needs.
Leading Players in the Tokenization Solution Market Market
- Fiserv Inc
- First Data Corporation
- Cardconnect Corporation
- Hewlett Packard Enterprise
- Liaison Technologies Inc
- Thales Group
- Ciphercloud Incorporation
- Broadcom Inc
- Paymetric Inc (A Worldpay Company)
- Cybersource Corporation
- Protegrity USA Inc
- 3delta Systems Inc
- Tokenex LLC
- *List Not Exhaustive
Key Developments in Tokenization Solution Market Industry
- May 2023: EY launches EY OpsChain ESG on its blockchain SaaS platform, utilizing tokenization for carbon emission tracking.
- April 2022: Newrl introduces tokenized equity alternatives for unlisted firms in India, pioneering Web3 ESOP solutions.
Future Outlook for Tokenization Solution Market Market
The Tokenization Solution Market is poised for significant growth, driven by technological advancements, increasing regulatory pressures, and growing demand for secure digital transactions. Strategic partnerships, product innovation, and expansion into new markets are expected to further fuel market growth in the coming years.
Tokenization Solution Market Segmentation
-
1. Type
- 1.1. Solutions
- 1.2. Services
-
2. Deployment
- 2.1. On-Premise
- 2.2. Cloud
-
3. End-User Industry
- 3.1. Retail & E-commerce
- 3.2. Transportation & Logistics
- 3.3. BFSI
- 3.4. IT & Telecommunications
- 3.5. Healthcare
- 3.6. Government
- 3.7. Energy & Utilities
- 3.8. Other End-User Industries
Tokenization Solution Market Segmentation By Geography
-
1. North America
- 1.1. United States
- 1.2. Canada
-
2. Europe
- 2.1. United Kingdom
- 2.2. Germany
- 2.3. France
-
3. Asia
- 3.1. China
- 3.2. India
- 4. Australia and New Zealand
-
5. Latin America
- 5.1. Brazil
- 5.2. Mexico
- 5.3. Argentina
- 6. Middle East
-
7. United Arab Emirates
- 7.1. Saudi Arabia
- 7.2. South Africa
Tokenization Solution Market REPORT HIGHLIGHTS
| Aspects | Details |
|---|---|
| Study Period | 2019-2033 |
| Base Year | 2024 |
| Estimated Year | 2025 |
| Forecast Period | 2025-2033 |
| Historical Period | 2019-2024 |
| Growth Rate | CAGR of 17.68% from 2019-2033 |
| Segmentation |
|
Table of Contents
- 1. Introduction
- 1.1. Research Scope
- 1.2. Market Segmentation
- 1.3. Research Methodology
- 1.4. Definitions and Assumptions
- 2. Executive Summary
- 2.1. Introduction
- 3. Market Dynamics
- 3.1. Introduction
- 3.2. Market Drivers
- 3.2.1. Growing Demand for Secure Payment Gateways; Rising Adoption in E-commerce and Mobile payments; Growing Government Regulations On Data Security
- 3.3. Market Restrains
- 3.3.1. Addressing Vulnerabilities From EMV Standards; Lack of Awareness Due to Similar Products
- 3.4. Market Trends
- 3.4.1. BFSI to hold the largest market size
- 4. Market Factor Analysis
- 4.1. Porters Five Forces
- 4.2. Supply/Value Chain
- 4.3. PESTEL analysis
- 4.4. Market Entropy
- 4.5. Patent/Trademark Analysis
- 5. Global Tokenization Solution Market Analysis, Insights and Forecast, 2019-2031
- 5.1. Market Analysis, Insights and Forecast - by Type
- 5.1.1. Solutions
- 5.1.2. Services
- 5.2. Market Analysis, Insights and Forecast - by Deployment
- 5.2.1. On-Premise
- 5.2.2. Cloud
- 5.3. Market Analysis, Insights and Forecast - by End-User Industry
- 5.3.1. Retail & E-commerce
- 5.3.2. Transportation & Logistics
- 5.3.3. BFSI
- 5.3.4. IT & Telecommunications
- 5.3.5. Healthcare
- 5.3.6. Government
- 5.3.7. Energy & Utilities
- 5.3.8. Other End-User Industries
- 5.4. Market Analysis, Insights and Forecast - by Region
- 5.4.1. North America
- 5.4.2. Europe
- 5.4.3. Asia
- 5.4.4. Australia and New Zealand
- 5.4.5. Latin America
- 5.4.6. Middle East
- 5.4.7. United Arab Emirates
- 5.1. Market Analysis, Insights and Forecast - by Type
- 6. North America Tokenization Solution Market Analysis, Insights and Forecast, 2019-2031
- 6.1. Market Analysis, Insights and Forecast - by Type
- 6.1.1. Solutions
- 6.1.2. Services
- 6.2. Market Analysis, Insights and Forecast - by Deployment
- 6.2.1. On-Premise
- 6.2.2. Cloud
- 6.3. Market Analysis, Insights and Forecast - by End-User Industry
- 6.3.1. Retail & E-commerce
- 6.3.2. Transportation & Logistics
- 6.3.3. BFSI
- 6.3.4. IT & Telecommunications
- 6.3.5. Healthcare
- 6.3.6. Government
- 6.3.7. Energy & Utilities
- 6.3.8. Other End-User Industries
- 6.1. Market Analysis, Insights and Forecast - by Type
- 7. Europe Tokenization Solution Market Analysis, Insights and Forecast, 2019-2031
- 7.1. Market Analysis, Insights and Forecast - by Type
- 7.1.1. Solutions
- 7.1.2. Services
- 7.2. Market Analysis, Insights and Forecast - by Deployment
- 7.2.1. On-Premise
- 7.2.2. Cloud
- 7.3. Market Analysis, Insights and Forecast - by End-User Industry
- 7.3.1. Retail & E-commerce
- 7.3.2. Transportation & Logistics
- 7.3.3. BFSI
- 7.3.4. IT & Telecommunications
- 7.3.5. Healthcare
- 7.3.6. Government
- 7.3.7. Energy & Utilities
- 7.3.8. Other End-User Industries
- 7.1. Market Analysis, Insights and Forecast - by Type
- 8. Asia Tokenization Solution Market Analysis, Insights and Forecast, 2019-2031
- 8.1. Market Analysis, Insights and Forecast - by Type
- 8.1.1. Solutions
- 8.1.2. Services
- 8.2. Market Analysis, Insights and Forecast - by Deployment
- 8.2.1. On-Premise
- 8.2.2. Cloud
- 8.3. Market Analysis, Insights and Forecast - by End-User Industry
- 8.3.1. Retail & E-commerce
- 8.3.2. Transportation & Logistics
- 8.3.3. BFSI
- 8.3.4. IT & Telecommunications
- 8.3.5. Healthcare
- 8.3.6. Government
- 8.3.7. Energy & Utilities
- 8.3.8. Other End-User Industries
- 8.1. Market Analysis, Insights and Forecast - by Type
- 9. Australia and New Zealand Tokenization Solution Market Analysis, Insights and Forecast, 2019-2031
- 9.1. Market Analysis, Insights and Forecast - by Type
- 9.1.1. Solutions
- 9.1.2. Services
- 9.2. Market Analysis, Insights and Forecast - by Deployment
- 9.2.1. On-Premise
- 9.2.2. Cloud
- 9.3. Market Analysis, Insights and Forecast - by End-User Industry
- 9.3.1. Retail & E-commerce
- 9.3.2. Transportation & Logistics
- 9.3.3. BFSI
- 9.3.4. IT & Telecommunications
- 9.3.5. Healthcare
- 9.3.6. Government
- 9.3.7. Energy & Utilities
- 9.3.8. Other End-User Industries
- 9.1. Market Analysis, Insights and Forecast - by Type
- 10. Latin America Tokenization Solution Market Analysis, Insights and Forecast, 2019-2031
- 10.1. Market Analysis, Insights and Forecast - by Type
- 10.1.1. Solutions
- 10.1.2. Services
- 10.2. Market Analysis, Insights and Forecast - by Deployment
- 10.2.1. On-Premise
- 10.2.2. Cloud
- 10.3. Market Analysis, Insights and Forecast - by End-User Industry
- 10.3.1. Retail & E-commerce
- 10.3.2. Transportation & Logistics
- 10.3.3. BFSI
- 10.3.4. IT & Telecommunications
- 10.3.5. Healthcare
- 10.3.6. Government
- 10.3.7. Energy & Utilities
- 10.3.8. Other End-User Industries
- 10.1. Market Analysis, Insights and Forecast - by Type
- 11. Middle East Tokenization Solution Market Analysis, Insights and Forecast, 2019-2031
- 11.1. Market Analysis, Insights and Forecast - by Type
- 11.1.1. Solutions
- 11.1.2. Services
- 11.2. Market Analysis, Insights and Forecast - by Deployment
- 11.2.1. On-Premise
- 11.2.2. Cloud
- 11.3. Market Analysis, Insights and Forecast - by End-User Industry
- 11.3.1. Retail & E-commerce
- 11.3.2. Transportation & Logistics
- 11.3.3. BFSI
- 11.3.4. IT & Telecommunications
- 11.3.5. Healthcare
- 11.3.6. Government
- 11.3.7. Energy & Utilities
- 11.3.8. Other End-User Industries
- 11.1. Market Analysis, Insights and Forecast - by Type
- 12. United Arab Emirates Tokenization Solution Market Analysis, Insights and Forecast, 2019-2031
- 12.1. Market Analysis, Insights and Forecast - by Type
- 12.1.1. Solutions
- 12.1.2. Services
- 12.2. Market Analysis, Insights and Forecast - by Deployment
- 12.2.1. On-Premise
- 12.2.2. Cloud
- 12.3. Market Analysis, Insights and Forecast - by End-User Industry
- 12.3.1. Retail & E-commerce
- 12.3.2. Transportation & Logistics
- 12.3.3. BFSI
- 12.3.4. IT & Telecommunications
- 12.3.5. Healthcare
- 12.3.6. Government
- 12.3.7. Energy & Utilities
- 12.3.8. Other End-User Industries
- 12.1. Market Analysis, Insights and Forecast - by Type
- 13. North America Tokenization Solution Market Analysis, Insights and Forecast, 2019-2031
- 13.1. Market Analysis, Insights and Forecast - By Country/Sub-region
- 13.1.1 United States
- 13.1.2 Canada
- 14. Europe Tokenization Solution Market Analysis, Insights and Forecast, 2019-2031
- 14.1. Market Analysis, Insights and Forecast - By Country/Sub-region
- 14.1.1 United Kingdom
- 14.1.2 Germany
- 14.1.3 France
- 15. Asia Tokenization Solution Market Analysis, Insights and Forecast, 2019-2031
- 15.1. Market Analysis, Insights and Forecast - By Country/Sub-region
- 15.1.1 China
- 15.1.2 India
- 16. Australia and New Zealand Tokenization Solution Market Analysis, Insights and Forecast, 2019-2031
- 16.1. Market Analysis, Insights and Forecast - By Country/Sub-region
- 16.1.1.
- 17. Latin America Tokenization Solution Market Analysis, Insights and Forecast, 2019-2031
- 17.1. Market Analysis, Insights and Forecast - By Country/Sub-region
- 17.1.1 Brazil
- 17.1.2 Mexico
- 17.1.3 Argentina
- 18. Middle East Tokenization Solution Market Analysis, Insights and Forecast, 2019-2031
- 18.1. Market Analysis, Insights and Forecast - By Country/Sub-region
- 18.1.1.
- 19. United Arab Emirates Tokenization Solution Market Analysis, Insights and Forecast, 2019-2031
- 19.1. Market Analysis, Insights and Forecast - By Country/Sub-region
- 19.1.1 Saudi Arabia
- 19.1.2 South Africa
- 20. Competitive Analysis
- 20.1. Global Market Share Analysis 2024
- 20.2. Company Profiles
- 20.2.1 Fiserv Inc
- 20.2.1.1. Overview
- 20.2.1.2. Products
- 20.2.1.3. SWOT Analysis
- 20.2.1.4. Recent Developments
- 20.2.1.5. Financials (Based on Availability)
- 20.2.2 First Data Corporation
- 20.2.2.1. Overview
- 20.2.2.2. Products
- 20.2.2.3. SWOT Analysis
- 20.2.2.4. Recent Developments
- 20.2.2.5. Financials (Based on Availability)
- 20.2.3 Cardconnect Corporation
- 20.2.3.1. Overview
- 20.2.3.2. Products
- 20.2.3.3. SWOT Analysis
- 20.2.3.4. Recent Developments
- 20.2.3.5. Financials (Based on Availability)
- 20.2.4 Hewlett Packard Enterprise
- 20.2.4.1. Overview
- 20.2.4.2. Products
- 20.2.4.3. SWOT Analysis
- 20.2.4.4. Recent Developments
- 20.2.4.5. Financials (Based on Availability)
- 20.2.5 Liaison Technologies Inc
- 20.2.5.1. Overview
- 20.2.5.2. Products
- 20.2.5.3. SWOT Analysis
- 20.2.5.4. Recent Developments
- 20.2.5.5. Financials (Based on Availability)
- 20.2.6 Thales Group
- 20.2.6.1. Overview
- 20.2.6.2. Products
- 20.2.6.3. SWOT Analysis
- 20.2.6.4. Recent Developments
- 20.2.6.5. Financials (Based on Availability)
- 20.2.7 Ciphercloud Incorporation
- 20.2.7.1. Overview
- 20.2.7.2. Products
- 20.2.7.3. SWOT Analysis
- 20.2.7.4. Recent Developments
- 20.2.7.5. Financials (Based on Availability)
- 20.2.8 Broadcom Inc
- 20.2.8.1. Overview
- 20.2.8.2. Products
- 20.2.8.3. SWOT Analysis
- 20.2.8.4. Recent Developments
- 20.2.8.5. Financials (Based on Availability)
- 20.2.9 Paymetric Inc (A Worldpay Company)
- 20.2.9.1. Overview
- 20.2.9.2. Products
- 20.2.9.3. SWOT Analysis
- 20.2.9.4. Recent Developments
- 20.2.9.5. Financials (Based on Availability)
- 20.2.10 Cybersource Corporation
- 20.2.10.1. Overview
- 20.2.10.2. Products
- 20.2.10.3. SWOT Analysis
- 20.2.10.4. Recent Developments
- 20.2.10.5. Financials (Based on Availability)
- 20.2.11 Protegrity USA Inc
- 20.2.11.1. Overview
- 20.2.11.2. Products
- 20.2.11.3. SWOT Analysis
- 20.2.11.4. Recent Developments
- 20.2.11.5. Financials (Based on Availability)
- 20.2.12 3delta Systems Inc
- 20.2.12.1. Overview
- 20.2.12.2. Products
- 20.2.12.3. SWOT Analysis
- 20.2.12.4. Recent Developments
- 20.2.12.5. Financials (Based on Availability)
- 20.2.13 Tokenex LLC*List Not Exhaustive
- 20.2.13.1. Overview
- 20.2.13.2. Products
- 20.2.13.3. SWOT Analysis
- 20.2.13.4. Recent Developments
- 20.2.13.5. Financials (Based on Availability)
- 20.2.1 Fiserv Inc
List of Figures
- Figure 1: Global Tokenization Solution Market Revenue Breakdown (Million, %) by Region 2024 & 2032
- Figure 2: North America Tokenization Solution Market Revenue (Million), by Country 2024 & 2032
- Figure 3: North America Tokenization Solution Market Revenue Share (%), by Country 2024 & 2032
- Figure 4: Europe Tokenization Solution Market Revenue (Million), by Country 2024 & 2032
- Figure 5: Europe Tokenization Solution Market Revenue Share (%), by Country 2024 & 2032
- Figure 6: Asia Tokenization Solution Market Revenue (Million), by Country 2024 & 2032
- Figure 7: Asia Tokenization Solution Market Revenue Share (%), by Country 2024 & 2032
- Figure 8: Australia and New Zealand Tokenization Solution Market Revenue (Million), by Country 2024 & 2032
- Figure 9: Australia and New Zealand Tokenization Solution Market Revenue Share (%), by Country 2024 & 2032
- Figure 10: Latin America Tokenization Solution Market Revenue (Million), by Country 2024 & 2032
- Figure 11: Latin America Tokenization Solution Market Revenue Share (%), by Country 2024 & 2032
- Figure 12: Middle East Tokenization Solution Market Revenue (Million), by Country 2024 & 2032
- Figure 13: Middle East Tokenization Solution Market Revenue Share (%), by Country 2024 & 2032
- Figure 14: United Arab Emirates Tokenization Solution Market Revenue (Million), by Country 2024 & 2032
- Figure 15: United Arab Emirates Tokenization Solution Market Revenue Share (%), by Country 2024 & 2032
- Figure 16: North America Tokenization Solution Market Revenue (Million), by Type 2024 & 2032
- Figure 17: North America Tokenization Solution Market Revenue Share (%), by Type 2024 & 2032
- Figure 18: North America Tokenization Solution Market Revenue (Million), by Deployment 2024 & 2032
- Figure 19: North America Tokenization Solution Market Revenue Share (%), by Deployment 2024 & 2032
- Figure 20: North America Tokenization Solution Market Revenue (Million), by End-User Industry 2024 & 2032
- Figure 21: North America Tokenization Solution Market Revenue Share (%), by End-User Industry 2024 & 2032
- Figure 22: North America Tokenization Solution Market Revenue (Million), by Country 2024 & 2032
- Figure 23: North America Tokenization Solution Market Revenue Share (%), by Country 2024 & 2032
- Figure 24: Europe Tokenization Solution Market Revenue (Million), by Type 2024 & 2032
- Figure 25: Europe Tokenization Solution Market Revenue Share (%), by Type 2024 & 2032
- Figure 26: Europe Tokenization Solution Market Revenue (Million), by Deployment 2024 & 2032
- Figure 27: Europe Tokenization Solution Market Revenue Share (%), by Deployment 2024 & 2032
- Figure 28: Europe Tokenization Solution Market Revenue (Million), by End-User Industry 2024 & 2032
- Figure 29: Europe Tokenization Solution Market Revenue Share (%), by End-User Industry 2024 & 2032
- Figure 30: Europe Tokenization Solution Market Revenue (Million), by Country 2024 & 2032
- Figure 31: Europe Tokenization Solution Market Revenue Share (%), by Country 2024 & 2032
- Figure 32: Asia Tokenization Solution Market Revenue (Million), by Type 2024 & 2032
- Figure 33: Asia Tokenization Solution Market Revenue Share (%), by Type 2024 & 2032
- Figure 34: Asia Tokenization Solution Market Revenue (Million), by Deployment 2024 & 2032
- Figure 35: Asia Tokenization Solution Market Revenue Share (%), by Deployment 2024 & 2032
- Figure 36: Asia Tokenization Solution Market Revenue (Million), by End-User Industry 2024 & 2032
- Figure 37: Asia Tokenization Solution Market Revenue Share (%), by End-User Industry 2024 & 2032
- Figure 38: Asia Tokenization Solution Market Revenue (Million), by Country 2024 & 2032
- Figure 39: Asia Tokenization Solution Market Revenue Share (%), by Country 2024 & 2032
- Figure 40: Australia and New Zealand Tokenization Solution Market Revenue (Million), by Type 2024 & 2032
- Figure 41: Australia and New Zealand Tokenization Solution Market Revenue Share (%), by Type 2024 & 2032
- Figure 42: Australia and New Zealand Tokenization Solution Market Revenue (Million), by Deployment 2024 & 2032
- Figure 43: Australia and New Zealand Tokenization Solution Market Revenue Share (%), by Deployment 2024 & 2032
- Figure 44: Australia and New Zealand Tokenization Solution Market Revenue (Million), by End-User Industry 2024 & 2032
- Figure 45: Australia and New Zealand Tokenization Solution Market Revenue Share (%), by End-User Industry 2024 & 2032
- Figure 46: Australia and New Zealand Tokenization Solution Market Revenue (Million), by Country 2024 & 2032
- Figure 47: Australia and New Zealand Tokenization Solution Market Revenue Share (%), by Country 2024 & 2032
- Figure 48: Latin America Tokenization Solution Market Revenue (Million), by Type 2024 & 2032
- Figure 49: Latin America Tokenization Solution Market Revenue Share (%), by Type 2024 & 2032
- Figure 50: Latin America Tokenization Solution Market Revenue (Million), by Deployment 2024 & 2032
- Figure 51: Latin America Tokenization Solution Market Revenue Share (%), by Deployment 2024 & 2032
- Figure 52: Latin America Tokenization Solution Market Revenue (Million), by End-User Industry 2024 & 2032
- Figure 53: Latin America Tokenization Solution Market Revenue Share (%), by End-User Industry 2024 & 2032
- Figure 54: Latin America Tokenization Solution Market Revenue (Million), by Country 2024 & 2032
- Figure 55: Latin America Tokenization Solution Market Revenue Share (%), by Country 2024 & 2032
- Figure 56: Middle East Tokenization Solution Market Revenue (Million), by Type 2024 & 2032
- Figure 57: Middle East Tokenization Solution Market Revenue Share (%), by Type 2024 & 2032
- Figure 58: Middle East Tokenization Solution Market Revenue (Million), by Deployment 2024 & 2032
- Figure 59: Middle East Tokenization Solution Market Revenue Share (%), by Deployment 2024 & 2032
- Figure 60: Middle East Tokenization Solution Market Revenue (Million), by End-User Industry 2024 & 2032
- Figure 61: Middle East Tokenization Solution Market Revenue Share (%), by End-User Industry 2024 & 2032
- Figure 62: Middle East Tokenization Solution Market Revenue (Million), by Country 2024 & 2032
- Figure 63: Middle East Tokenization Solution Market Revenue Share (%), by Country 2024 & 2032
- Figure 64: United Arab Emirates Tokenization Solution Market Revenue (Million), by Type 2024 & 2032
- Figure 65: United Arab Emirates Tokenization Solution Market Revenue Share (%), by Type 2024 & 2032
- Figure 66: United Arab Emirates Tokenization Solution Market Revenue (Million), by Deployment 2024 & 2032
- Figure 67: United Arab Emirates Tokenization Solution Market Revenue Share (%), by Deployment 2024 & 2032
- Figure 68: United Arab Emirates Tokenization Solution Market Revenue (Million), by End-User Industry 2024 & 2032
- Figure 69: United Arab Emirates Tokenization Solution Market Revenue Share (%), by End-User Industry 2024 & 2032
- Figure 70: United Arab Emirates Tokenization Solution Market Revenue (Million), by Country 2024 & 2032
- Figure 71: United Arab Emirates Tokenization Solution Market Revenue Share (%), by Country 2024 & 2032
List of Tables
- Table 1: Global Tokenization Solution Market Revenue Million Forecast, by Region 2019 & 2032
- Table 2: Global Tokenization Solution Market Revenue Million Forecast, by Type 2019 & 2032
- Table 3: Global Tokenization Solution Market Revenue Million Forecast, by Deployment 2019 & 2032
- Table 4: Global Tokenization Solution Market Revenue Million Forecast, by End-User Industry 2019 & 2032
- Table 5: Global Tokenization Solution Market Revenue Million Forecast, by Region 2019 & 2032
- Table 6: Global Tokenization Solution Market Revenue Million Forecast, by Country 2019 & 2032
- Table 7: United States Tokenization Solution Market Revenue (Million) Forecast, by Application 2019 & 2032
- Table 8: Canada Tokenization Solution Market Revenue (Million) Forecast, by Application 2019 & 2032
- Table 9: Global Tokenization Solution Market Revenue Million Forecast, by Country 2019 & 2032
- Table 10: United Kingdom Tokenization Solution Market Revenue (Million) Forecast, by Application 2019 & 2032
- Table 11: Germany Tokenization Solution Market Revenue (Million) Forecast, by Application 2019 & 2032
- Table 12: France Tokenization Solution Market Revenue (Million) Forecast, by Application 2019 & 2032
- Table 13: Global Tokenization Solution Market Revenue Million Forecast, by Country 2019 & 2032
- Table 14: China Tokenization Solution Market Revenue (Million) Forecast, by Application 2019 & 2032
- Table 15: India Tokenization Solution Market Revenue (Million) Forecast, by Application 2019 & 2032
- Table 16: Global Tokenization Solution Market Revenue Million Forecast, by Country 2019 & 2032
- Table 17: Tokenization Solution Market Revenue (Million) Forecast, by Application 2019 & 2032
- Table 18: Global Tokenization Solution Market Revenue Million Forecast, by Country 2019 & 2032
- Table 19: Brazil Tokenization Solution Market Revenue (Million) Forecast, by Application 2019 & 2032
- Table 20: Mexico Tokenization Solution Market Revenue (Million) Forecast, by Application 2019 & 2032
- Table 21: Argentina Tokenization Solution Market Revenue (Million) Forecast, by Application 2019 & 2032
- Table 22: Global Tokenization Solution Market Revenue Million Forecast, by Country 2019 & 2032
- Table 23: Tokenization Solution Market Revenue (Million) Forecast, by Application 2019 & 2032
- Table 24: Global Tokenization Solution Market Revenue Million Forecast, by Country 2019 & 2032
- Table 25: Saudi Arabia Tokenization Solution Market Revenue (Million) Forecast, by Application 2019 & 2032
- Table 26: South Africa Tokenization Solution Market Revenue (Million) Forecast, by Application 2019 & 2032
- Table 27: Global Tokenization Solution Market Revenue Million Forecast, by Type 2019 & 2032
- Table 28: Global Tokenization Solution Market Revenue Million Forecast, by Deployment 2019 & 2032
- Table 29: Global Tokenization Solution Market Revenue Million Forecast, by End-User Industry 2019 & 2032
- Table 30: Global Tokenization Solution Market Revenue Million Forecast, by Country 2019 & 2032
- Table 31: United States Tokenization Solution Market Revenue (Million) Forecast, by Application 2019 & 2032
- Table 32: Canada Tokenization Solution Market Revenue (Million) Forecast, by Application 2019 & 2032
- Table 33: Global Tokenization Solution Market Revenue Million Forecast, by Type 2019 & 2032
- Table 34: Global Tokenization Solution Market Revenue Million Forecast, by Deployment 2019 & 2032
- Table 35: Global Tokenization Solution Market Revenue Million Forecast, by End-User Industry 2019 & 2032
- Table 36: Global Tokenization Solution Market Revenue Million Forecast, by Country 2019 & 2032
- Table 37: United Kingdom Tokenization Solution Market Revenue (Million) Forecast, by Application 2019 & 2032
- Table 38: Germany Tokenization Solution Market Revenue (Million) Forecast, by Application 2019 & 2032
- Table 39: France Tokenization Solution Market Revenue (Million) Forecast, by Application 2019 & 2032
- Table 40: Global Tokenization Solution Market Revenue Million Forecast, by Type 2019 & 2032
- Table 41: Global Tokenization Solution Market Revenue Million Forecast, by Deployment 2019 & 2032
- Table 42: Global Tokenization Solution Market Revenue Million Forecast, by End-User Industry 2019 & 2032
- Table 43: Global Tokenization Solution Market Revenue Million Forecast, by Country 2019 & 2032
- Table 44: China Tokenization Solution Market Revenue (Million) Forecast, by Application 2019 & 2032
- Table 45: India Tokenization Solution Market Revenue (Million) Forecast, by Application 2019 & 2032
- Table 46: Global Tokenization Solution Market Revenue Million Forecast, by Type 2019 & 2032
- Table 47: Global Tokenization Solution Market Revenue Million Forecast, by Deployment 2019 & 2032
- Table 48: Global Tokenization Solution Market Revenue Million Forecast, by End-User Industry 2019 & 2032
- Table 49: Global Tokenization Solution Market Revenue Million Forecast, by Country 2019 & 2032
- Table 50: Global Tokenization Solution Market Revenue Million Forecast, by Type 2019 & 2032
- Table 51: Global Tokenization Solution Market Revenue Million Forecast, by Deployment 2019 & 2032
- Table 52: Global Tokenization Solution Market Revenue Million Forecast, by End-User Industry 2019 & 2032
- Table 53: Global Tokenization Solution Market Revenue Million Forecast, by Country 2019 & 2032
- Table 54: Brazil Tokenization Solution Market Revenue (Million) Forecast, by Application 2019 & 2032
- Table 55: Mexico Tokenization Solution Market Revenue (Million) Forecast, by Application 2019 & 2032
- Table 56: Argentina Tokenization Solution Market Revenue (Million) Forecast, by Application 2019 & 2032
- Table 57: Global Tokenization Solution Market Revenue Million Forecast, by Type 2019 & 2032
- Table 58: Global Tokenization Solution Market Revenue Million Forecast, by Deployment 2019 & 2032
- Table 59: Global Tokenization Solution Market Revenue Million Forecast, by End-User Industry 2019 & 2032
- Table 60: Global Tokenization Solution Market Revenue Million Forecast, by Country 2019 & 2032
- Table 61: Global Tokenization Solution Market Revenue Million Forecast, by Type 2019 & 2032
- Table 62: Global Tokenization Solution Market Revenue Million Forecast, by Deployment 2019 & 2032
- Table 63: Global Tokenization Solution Market Revenue Million Forecast, by End-User Industry 2019 & 2032
- Table 64: Global Tokenization Solution Market Revenue Million Forecast, by Country 2019 & 2032
- Table 65: Saudi Arabia Tokenization Solution Market Revenue (Million) Forecast, by Application 2019 & 2032
- Table 66: South Africa Tokenization Solution Market Revenue (Million) Forecast, by Application 2019 & 2032
Frequently Asked Questions
1. What is the projected Compound Annual Growth Rate (CAGR) of the Tokenization Solution Market?
The projected CAGR is approximately 17.68%.
2. Which companies are prominent players in the Tokenization Solution Market?
Key companies in the market include Fiserv Inc, First Data Corporation, Cardconnect Corporation, Hewlett Packard Enterprise, Liaison Technologies Inc, Thales Group, Ciphercloud Incorporation, Broadcom Inc, Paymetric Inc (A Worldpay Company), Cybersource Corporation, Protegrity USA Inc, 3delta Systems Inc, Tokenex LLC*List Not Exhaustive.
3. What are the main segments of the Tokenization Solution Market?
The market segments include Type, Deployment, End-User Industry.
4. Can you provide details about the market size?
The market size is estimated to be USD 5.35 Million as of 2022.
5. What are some drivers contributing to market growth?
Growing Demand for Secure Payment Gateways; Rising Adoption in E-commerce and Mobile payments; Growing Government Regulations On Data Security.
6. What are the notable trends driving market growth?
BFSI to hold the largest market size.
7. Are there any restraints impacting market growth?
Addressing Vulnerabilities From EMV Standards; Lack of Awareness Due to Similar Products.
8. Can you provide examples of recent developments in the market?
May 2023 - The EY company announced that EY OpsChain ESG is now usable in beta form on the EY Blockchain SaaS platform. The new solution, created on the Ethereum blockchain, would give businesses that find it difficult to precisely measure and manage their carbon footprint a single, verified picture of CO2 emissions (CO2e). Through tokenization, it will also give customers, business partners, and regulators the transparency required to trace emissions and carbon credits throughout an ecosystem.
9. What pricing options are available for accessing the report?
Pricing options include single-user, multi-user, and enterprise licenses priced at USD 4750, USD 5250, and USD 8750 respectively.
10. Is the market size provided in terms of value or volume?
The market size is provided in terms of value, measured in Million.
11. Are there any specific market keywords associated with the report?
Yes, the market keyword associated with the report is "Tokenization Solution Market," which aids in identifying and referencing the specific market segment covered.
12. How do I determine which pricing option suits my needs best?
The pricing options vary based on user requirements and access needs. Individual users may opt for single-user licenses, while businesses requiring broader access may choose multi-user or enterprise licenses for cost-effective access to the report.
13. Are there any additional resources or data provided in the Tokenization Solution Market report?
While the report offers comprehensive insights, it's advisable to review the specific contents or supplementary materials provided to ascertain if additional resources or data are available.
14. How can I stay updated on further developments or reports in the Tokenization Solution Market?
To stay informed about further developments, trends, and reports in the Tokenization Solution Market, consider subscribing to industry newsletters, following relevant companies and organizations, or regularly checking reputable industry news sources and publications.
Methodology
Step 1 - Identification of Relevant Samples Size from Population Database


Step 2 - Approaches for Defining Global Market Size (Value, Volume* & Price*)

Note*: In applicable scenarios
Step 3 - Data Sources
Primary Research
- Web Analytics
- Survey Reports
- Research Institute
- Latest Research Reports
- Opinion Leaders
Secondary Research
- Annual Reports
- White Paper
- Latest Press Release
- Industry Association
- Paid Database
- Investor Presentations

Step 4 - Data Triangulation
Involves using different sources of information in order to increase the validity of a study
These sources are likely to be stakeholders in a program - participants, other researchers, program staff, other community members, and so on.
Then we put all data in single framework & apply various statistical tools to find out the dynamic on the market.
During the analysis stage, feedback from the stakeholder groups would be compared to determine areas of agreement as well as areas of divergence


