
Key Insights
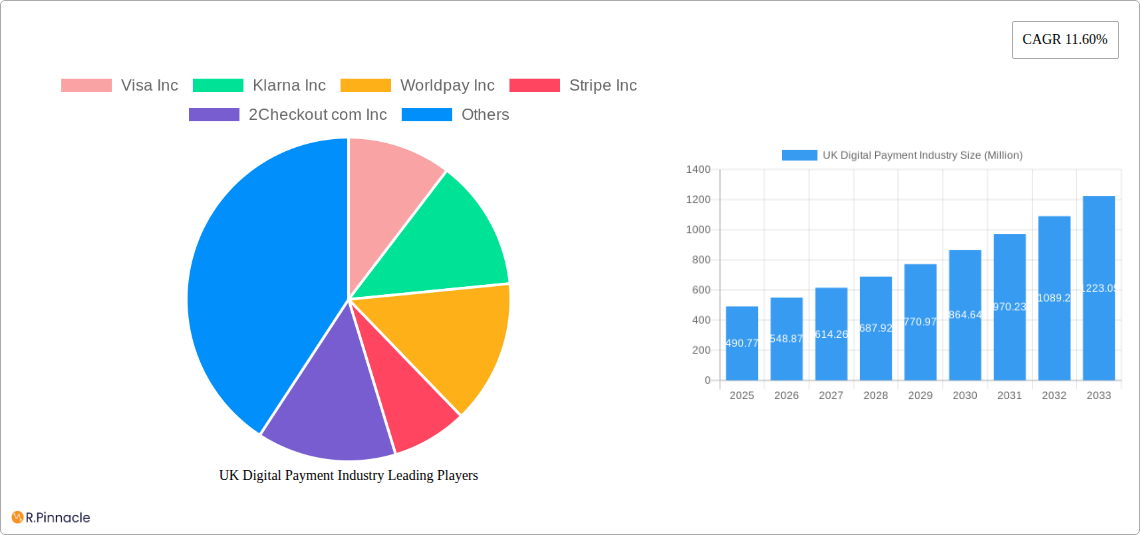
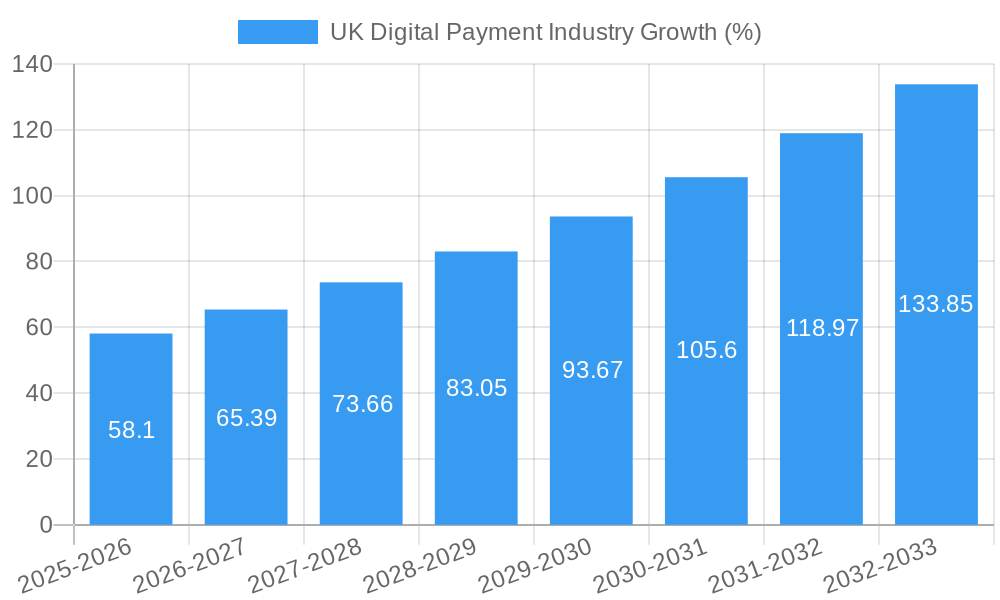
The UK digital payment industry is experiencing robust growth, projected to reach £490.77 million in 2025 and exhibiting a Compound Annual Growth Rate (CAGR) of 11.60% from 2025 to 2033. This expansion is fueled by several key drivers. Increasing smartphone penetration and internet usage across all demographics are significantly boosting the adoption of contactless and mobile payment methods. Furthermore, the rise of e-commerce and online shopping continues to propel demand for secure and convenient digital payment solutions. Government initiatives promoting digital transactions and a growing preference for cashless transactions among consumers also contribute to market growth. The retail sector remains a dominant end-user industry, but significant growth is also observed in entertainment, healthcare, and hospitality, reflecting the broader adoption of digital payments across various sectors. While challenges exist, such as concerns regarding data security and fraud, the industry is proactively addressing these issues through advanced security protocols and regulatory frameworks. The competitive landscape is dynamic, with both established players like Visa, Mastercard, and PayPal, as well as innovative fintech companies like Klarna and Stripe, vying for market share. This competition fosters innovation and drives down costs, ultimately benefiting consumers.
The forecast period (2025-2033) anticipates continued expansion, with the market likely exceeding £1 billion by 2030. This growth will be influenced by the ongoing development of new payment technologies, such as Buy Now Pay Later (BNPL) services, and the increasing integration of digital payments into everyday life. The segmentation by payment mode (point-of-sale versus online) and end-user industry will continue to provide valuable insights into market dynamics. The UK’s relatively advanced digital infrastructure and supportive regulatory environment positions the nation as a leading market for digital payment innovation and growth within Europe. Future success will hinge on addressing security concerns, fostering consumer trust, and adapting to evolving technological advancements.
UK Digital Payment Industry: Market Report 2019-2033
This comprehensive report provides a detailed analysis of the UK digital payment industry, offering invaluable insights for industry professionals, investors, and strategists. With a study period spanning 2019-2033, a base year of 2025, and a forecast period of 2025-2033, this report unveils the market's structure, dynamics, and future trajectory. The report leverages extensive data and analysis to present a clear picture of the UK's rapidly evolving digital payments landscape. The market size is projected to reach xx Million by 2033.
UK Digital Payment Industry Market Structure & Innovation Trends
This section analyzes the UK digital payment market's competitive landscape, highlighting key players and their market shares. We explore the drivers of innovation, regulatory influences, and the impact of mergers and acquisitions (M&A) activity. The analysis considers factors like product substitutes, end-user demographics, and evolving technological trends.
- Market Concentration: The UK digital payment market exhibits a moderately concentrated structure, with major players like Visa, Mastercard, PayPal, and others holding significant market share. Precise market share data is not publicly available, but estimates suggest that the top 5 players account for over xx% of the market.
- Innovation Drivers: Key drivers of innovation include advancements in mobile technology, the rise of Buy Now Pay Later (BNPL) services, and increasing demand for secure and convenient payment solutions. Open banking initiatives also contribute significantly.
- Regulatory Frameworks: The Payment Services Directive 2 (PSD2) and other regulations significantly impact market operations, influencing security standards and data privacy practices. The regulatory environment is constantly evolving, posing both challenges and opportunities for industry players.
- M&A Activity: The UK has witnessed significant M&A activity in recent years, with large players acquiring smaller fintech firms to expand their product portfolios and market reach. Deal values have varied, with some transactions exceeding xx Million.
UK Digital Payment Industry Market Dynamics & Trends
This section delves into the market's dynamic forces, examining growth drivers, technological disruptions, evolving consumer preferences, and the intensity of competition. We provide a detailed analysis, including Compound Annual Growth Rate (CAGR) and market penetration rates.
The UK digital payment market is experiencing robust growth, driven by increasing smartphone penetration, rising e-commerce adoption, and a shift towards cashless transactions. The CAGR for the forecast period (2025-2033) is estimated at xx%. Market penetration is currently at xx%, projected to reach xx% by 2033. Technological disruptions, such as the emergence of BNPL and cryptocurrencies, are reshaping the market landscape. Consumer preferences are shifting toward seamless, secure, and personalized payment experiences. The competitive landscape is highly dynamic, with both established players and new entrants vying for market share.
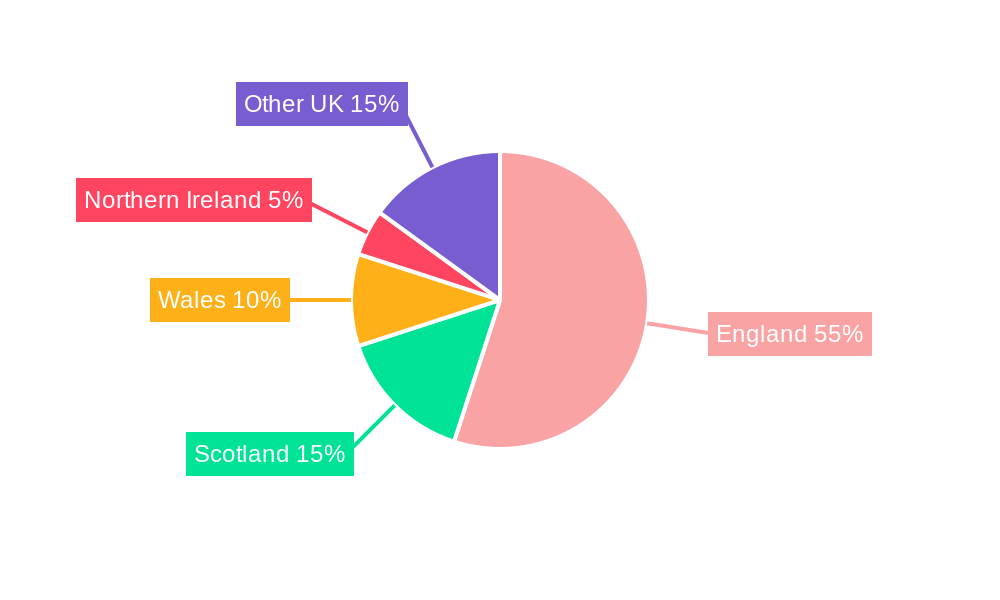
Dominant Regions & Segments in UK Digital Payment Industry
This section identifies the leading regions, countries, and segments within the UK digital payment market. We analyze key growth drivers across different payment modes (Point of Sale, Online Sale) and end-user industries (Retail, Entertainment, Healthcare, Hospitality, Others).
- By Mode of Payment:
- Point of Sale (POS): The POS segment dominates, fueled by the increasing adoption of contactless payments and mobile POS solutions. Key drivers include growing retail activity and government initiatives to promote digital payments.
- Online Sale: The online segment is experiencing rapid growth, driven by the surge in e-commerce and the expanding digital economy. Factors such as improved internet infrastructure and increased online shopping contribute to this dominance.
- By End-user Industry:
- Retail: The retail sector remains the largest segment, owing to the high volume of transactions and the widespread adoption of digital payment methods.
- Other End-user Industries: Growth in sectors like healthcare, hospitality, and entertainment is contributing significantly to overall market expansion.
UK Digital Payment Industry Product Innovations
This section examines recent product developments, their applications, and the competitive advantages they offer. We emphasize technological advancements and their market relevance.
Recent innovations include the rise of super apps integrating various financial services, advancements in biometric authentication, and the increasing use of artificial intelligence (AI) to enhance security and fraud prevention. The integration of BNPL solutions within e-commerce platforms is another significant development. These innovations are improving the user experience and driving market growth.
Report Scope & Segmentation Analysis
This section details the market segmentation by payment mode and end-user industry, providing growth projections, market sizes, and competitive dynamics.
By Mode of Payment: The report segments the market into Point of Sale (POS) and Online Sale, providing detailed analysis of each segment's market size, growth rate, and competitive landscape.
By End-user Industry: The report segments the market into Retail, Entertainment, Healthcare, Hospitality, and Other End-user Industries, providing detailed analysis of each segment's market size, growth rate, and competitive landscape.
Key Drivers of UK Digital Payment Industry Growth
This section outlines the key factors driving the growth of the UK digital payment industry.
Technological advancements, government initiatives promoting digitalization, increased smartphone penetration, and rising e-commerce adoption are the major drivers of growth. The shift towards cashless transactions and the growing preference for convenient payment methods further contribute to the market's expansion.
Challenges in the UK Digital Payment Industry Sector
This section highlights the challenges faced by the UK digital payment industry.
The major challenges include regulatory complexities, security concerns, and the need to maintain data privacy. Competition among industry players and potential disruption from new technologies also pose significant challenges. The industry also faces the challenge of addressing fraud and ensuring the security of transactions.
Emerging Opportunities in UK Digital Payment Industry
This section identifies emerging opportunities for growth in the UK digital payment industry.
Opportunities lie in expanding into underserved markets, adopting innovative payment technologies (e.g., blockchain, AI), and catering to evolving consumer preferences for personalized and seamless payment experiences. The growth of the BNPL market also presents a substantial opportunity.
Leading Players in the UK Digital Payment Industry Market
- Visa Inc
- Klarna Inc
- Worldpay Inc
- Stripe Inc
- 2Checkout com Inc
- PayPoint plc
- Amazon Payments Inc
- SumUp Inc
- PayPal Payments Private Limited
- Mastercard Inc
Key Developments in UK Digital Payment Industry
- November 2023: Square launched Tap to Pay on iPhone across the UK, enabling sellers to accept contactless payments directly through their iPhones.
- February 2023: ECOMMPAY launched a BNPL payment solution for UK travel companies.
Future Outlook for UK Digital Payment Industry Market
The UK digital payment market is poised for continued growth, driven by technological innovations, increasing e-commerce adoption, and a shift towards cashless transactions. The market presents significant opportunities for players who can adapt to evolving consumer preferences and regulatory landscapes. The future outlook is positive, with projections indicating sustained market expansion and innovation.
UK Digital Payment Industry Segmentation
-
1. Mode of Payment
-
1.1. Point of Sale
- 1.1.1. Card Pay
- 1.1.2. Digital Wallet (includes Mobile Wallets)
- 1.1.3. Cash
- 1.1.4. Others
-
1.2. Online Sale
- 1.2.1. Others (
-
1.1. Point of Sale
-
2. End-user Industry
- 2.1. Retail
- 2.2. Entertainment
- 2.3. Healthcare
- 2.4. Hospitality
- 2.5. Other End-user Industries
UK Digital Payment Industry Segmentation By Geography
-
1. North America
- 1.1. United States
- 1.2. Canada
- 1.3. Mexico
-
2. South America
- 2.1. Brazil
- 2.2. Argentina
- 2.3. Rest of South America
-
3. Europe
- 3.1. United Kingdom
- 3.2. Germany
- 3.3. France
- 3.4. Italy
- 3.5. Spain
- 3.6. Russia
- 3.7. Benelux
- 3.8. Nordics
- 3.9. Rest of Europe
-
4. Middle East & Africa
- 4.1. Turkey
- 4.2. Israel
- 4.3. GCC
- 4.4. North Africa
- 4.5. South Africa
- 4.6. Rest of Middle East & Africa
-
5. Asia Pacific
- 5.1. China
- 5.2. India
- 5.3. Japan
- 5.4. South Korea
- 5.5. ASEAN
- 5.6. Oceania
- 5.7. Rest of Asia Pacific
UK Digital Payment Industry REPORT HIGHLIGHTS
| Aspects | Details |
|---|---|
| Study Period | 2019-2033 |
| Base Year | 2024 |
| Estimated Year | 2025 |
| Forecast Period | 2025-2033 |
| Historical Period | 2019-2024 |
| Growth Rate | CAGR of 11.60% from 2019-2033 |
| Segmentation |
|
Table of Contents
- 1. Introduction
- 1.1. Research Scope
- 1.2. Market Segmentation
- 1.3. Research Methodology
- 1.4. Definitions and Assumptions
- 2. Executive Summary
- 2.1. Introduction
- 3. Market Dynamics
- 3.1. Introduction
- 3.2. Market Drivers
- 3.2.1 High Proliferation of E-commerce
- 3.2.2 including the rise of m-commerce and cross-border e-commerce supported by the increase in purchasing power; Enablement Programs by Key Retailers and Government encouraging digitization of the market; Growth of Real-time Payments
- 3.2.3 especially Buy Now Pay Later in the country
- 3.3. Market Restrains
- 3.3.1. ; Stringent Regulations in the Payments Industry
- 3.4. Market Trends
- 3.4.1. Card Payments to Witness Significant Growth
- 4. Market Factor Analysis
- 4.1. Porters Five Forces
- 4.2. Supply/Value Chain
- 4.3. PESTEL analysis
- 4.4. Market Entropy
- 4.5. Patent/Trademark Analysis
- 5. Global UK Digital Payment Industry Analysis, Insights and Forecast, 2019-2031
- 5.1. Market Analysis, Insights and Forecast - by Mode of Payment
- 5.1.1. Point of Sale
- 5.1.1.1. Card Pay
- 5.1.1.2. Digital Wallet (includes Mobile Wallets)
- 5.1.1.3. Cash
- 5.1.1.4. Others
- 5.1.2. Online Sale
- 5.1.2.1. Others (
- 5.1.1. Point of Sale
- 5.2. Market Analysis, Insights and Forecast - by End-user Industry
- 5.2.1. Retail
- 5.2.2. Entertainment
- 5.2.3. Healthcare
- 5.2.4. Hospitality
- 5.2.5. Other End-user Industries
- 5.3. Market Analysis, Insights and Forecast - by Region
- 5.3.1. North America
- 5.3.2. South America
- 5.3.3. Europe
- 5.3.4. Middle East & Africa
- 5.3.5. Asia Pacific
- 5.1. Market Analysis, Insights and Forecast - by Mode of Payment
- 6. North America UK Digital Payment Industry Analysis, Insights and Forecast, 2019-2031
- 6.1. Market Analysis, Insights and Forecast - by Mode of Payment
- 6.1.1. Point of Sale
- 6.1.1.1. Card Pay
- 6.1.1.2. Digital Wallet (includes Mobile Wallets)
- 6.1.1.3. Cash
- 6.1.1.4. Others
- 6.1.2. Online Sale
- 6.1.2.1. Others (
- 6.1.1. Point of Sale
- 6.2. Market Analysis, Insights and Forecast - by End-user Industry
- 6.2.1. Retail
- 6.2.2. Entertainment
- 6.2.3. Healthcare
- 6.2.4. Hospitality
- 6.2.5. Other End-user Industries
- 6.1. Market Analysis, Insights and Forecast - by Mode of Payment
- 7. South America UK Digital Payment Industry Analysis, Insights and Forecast, 2019-2031
- 7.1. Market Analysis, Insights and Forecast - by Mode of Payment
- 7.1.1. Point of Sale
- 7.1.1.1. Card Pay
- 7.1.1.2. Digital Wallet (includes Mobile Wallets)
- 7.1.1.3. Cash
- 7.1.1.4. Others
- 7.1.2. Online Sale
- 7.1.2.1. Others (
- 7.1.1. Point of Sale
- 7.2. Market Analysis, Insights and Forecast - by End-user Industry
- 7.2.1. Retail
- 7.2.2. Entertainment
- 7.2.3. Healthcare
- 7.2.4. Hospitality
- 7.2.5. Other End-user Industries
- 7.1. Market Analysis, Insights and Forecast - by Mode of Payment
- 8. Europe UK Digital Payment Industry Analysis, Insights and Forecast, 2019-2031
- 8.1. Market Analysis, Insights and Forecast - by Mode of Payment
- 8.1.1. Point of Sale
- 8.1.1.1. Card Pay
- 8.1.1.2. Digital Wallet (includes Mobile Wallets)
- 8.1.1.3. Cash
- 8.1.1.4. Others
- 8.1.2. Online Sale
- 8.1.2.1. Others (
- 8.1.1. Point of Sale
- 8.2. Market Analysis, Insights and Forecast - by End-user Industry
- 8.2.1. Retail
- 8.2.2. Entertainment
- 8.2.3. Healthcare
- 8.2.4. Hospitality
- 8.2.5. Other End-user Industries
- 8.1. Market Analysis, Insights and Forecast - by Mode of Payment
- 9. Middle East & Africa UK Digital Payment Industry Analysis, Insights and Forecast, 2019-2031
- 9.1. Market Analysis, Insights and Forecast - by Mode of Payment
- 9.1.1. Point of Sale
- 9.1.1.1. Card Pay
- 9.1.1.2. Digital Wallet (includes Mobile Wallets)
- 9.1.1.3. Cash
- 9.1.1.4. Others
- 9.1.2. Online Sale
- 9.1.2.1. Others (
- 9.1.1. Point of Sale
- 9.2. Market Analysis, Insights and Forecast - by End-user Industry
- 9.2.1. Retail
- 9.2.2. Entertainment
- 9.2.3. Healthcare
- 9.2.4. Hospitality
- 9.2.5. Other End-user Industries
- 9.1. Market Analysis, Insights and Forecast - by Mode of Payment
- 10. Asia Pacific UK Digital Payment Industry Analysis, Insights and Forecast, 2019-2031
- 10.1. Market Analysis, Insights and Forecast - by Mode of Payment
- 10.1.1. Point of Sale
- 10.1.1.1. Card Pay
- 10.1.1.2. Digital Wallet (includes Mobile Wallets)
- 10.1.1.3. Cash
- 10.1.1.4. Others
- 10.1.2. Online Sale
- 10.1.2.1. Others (
- 10.1.1. Point of Sale
- 10.2. Market Analysis, Insights and Forecast - by End-user Industry
- 10.2.1. Retail
- 10.2.2. Entertainment
- 10.2.3. Healthcare
- 10.2.4. Hospitality
- 10.2.5. Other End-user Industries
- 10.1. Market Analysis, Insights and Forecast - by Mode of Payment
- 11. England UK Digital Payment Industry Analysis, Insights and Forecast, 2019-2031
- 12. Wales UK Digital Payment Industry Analysis, Insights and Forecast, 2019-2031
- 13. Scotland UK Digital Payment Industry Analysis, Insights and Forecast, 2019-2031
- 14. Northern UK Digital Payment Industry Analysis, Insights and Forecast, 2019-2031
- 15. Ireland UK Digital Payment Industry Analysis, Insights and Forecast, 2019-2031
- 16. Competitive Analysis
- 16.1. Global Market Share Analysis 2024
- 16.2. Company Profiles
- 16.2.1 Visa Inc
- 16.2.1.1. Overview
- 16.2.1.2. Products
- 16.2.1.3. SWOT Analysis
- 16.2.1.4. Recent Developments
- 16.2.1.5. Financials (Based on Availability)
- 16.2.2 Klarna Inc
- 16.2.2.1. Overview
- 16.2.2.2. Products
- 16.2.2.3. SWOT Analysis
- 16.2.2.4. Recent Developments
- 16.2.2.5. Financials (Based on Availability)
- 16.2.3 Worldpay Inc
- 16.2.3.1. Overview
- 16.2.3.2. Products
- 16.2.3.3. SWOT Analysis
- 16.2.3.4. Recent Developments
- 16.2.3.5. Financials (Based on Availability)
- 16.2.4 Stripe Inc
- 16.2.4.1. Overview
- 16.2.4.2. Products
- 16.2.4.3. SWOT Analysis
- 16.2.4.4. Recent Developments
- 16.2.4.5. Financials (Based on Availability)
- 16.2.5 2Checkout com Inc
- 16.2.5.1. Overview
- 16.2.5.2. Products
- 16.2.5.3. SWOT Analysis
- 16.2.5.4. Recent Developments
- 16.2.5.5. Financials (Based on Availability)
- 16.2.6 PayPoint plc
- 16.2.6.1. Overview
- 16.2.6.2. Products
- 16.2.6.3. SWOT Analysis
- 16.2.6.4. Recent Developments
- 16.2.6.5. Financials (Based on Availability)
- 16.2.7 Amazon Payments Inc
- 16.2.7.1. Overview
- 16.2.7.2. Products
- 16.2.7.3. SWOT Analysis
- 16.2.7.4. Recent Developments
- 16.2.7.5. Financials (Based on Availability)
- 16.2.8 SumUp Inc *List Not Exhaustive
- 16.2.8.1. Overview
- 16.2.8.2. Products
- 16.2.8.3. SWOT Analysis
- 16.2.8.4. Recent Developments
- 16.2.8.5. Financials (Based on Availability)
- 16.2.9 PayPal Payments Private Limited
- 16.2.9.1. Overview
- 16.2.9.2. Products
- 16.2.9.3. SWOT Analysis
- 16.2.9.4. Recent Developments
- 16.2.9.5. Financials (Based on Availability)
- 16.2.10 Mastercard Inc
- 16.2.10.1. Overview
- 16.2.10.2. Products
- 16.2.10.3. SWOT Analysis
- 16.2.10.4. Recent Developments
- 16.2.10.5. Financials (Based on Availability)
- 16.2.1 Visa Inc
List of Figures
- Figure 1: Global UK Digital Payment Industry Revenue Breakdown (Million, %) by Region 2024 & 2032
- Figure 2: United kingdom Region UK Digital Payment Industry Revenue (Million), by Country 2024 & 2032
- Figure 3: United kingdom Region UK Digital Payment Industry Revenue Share (%), by Country 2024 & 2032
- Figure 4: North America UK Digital Payment Industry Revenue (Million), by Mode of Payment 2024 & 2032
- Figure 5: North America UK Digital Payment Industry Revenue Share (%), by Mode of Payment 2024 & 2032
- Figure 6: North America UK Digital Payment Industry Revenue (Million), by End-user Industry 2024 & 2032
- Figure 7: North America UK Digital Payment Industry Revenue Share (%), by End-user Industry 2024 & 2032
- Figure 8: North America UK Digital Payment Industry Revenue (Million), by Country 2024 & 2032
- Figure 9: North America UK Digital Payment Industry Revenue Share (%), by Country 2024 & 2032
- Figure 10: South America UK Digital Payment Industry Revenue (Million), by Mode of Payment 2024 & 2032
- Figure 11: South America UK Digital Payment Industry Revenue Share (%), by Mode of Payment 2024 & 2032
- Figure 12: South America UK Digital Payment Industry Revenue (Million), by End-user Industry 2024 & 2032
- Figure 13: South America UK Digital Payment Industry Revenue Share (%), by End-user Industry 2024 & 2032
- Figure 14: South America UK Digital Payment Industry Revenue (Million), by Country 2024 & 2032
- Figure 15: South America UK Digital Payment Industry Revenue Share (%), by Country 2024 & 2032
- Figure 16: Europe UK Digital Payment Industry Revenue (Million), by Mode of Payment 2024 & 2032
- Figure 17: Europe UK Digital Payment Industry Revenue Share (%), by Mode of Payment 2024 & 2032
- Figure 18: Europe UK Digital Payment Industry Revenue (Million), by End-user Industry 2024 & 2032
- Figure 19: Europe UK Digital Payment Industry Revenue Share (%), by End-user Industry 2024 & 2032
- Figure 20: Europe UK Digital Payment Industry Revenue (Million), by Country 2024 & 2032
- Figure 21: Europe UK Digital Payment Industry Revenue Share (%), by Country 2024 & 2032
- Figure 22: Middle East & Africa UK Digital Payment Industry Revenue (Million), by Mode of Payment 2024 & 2032
- Figure 23: Middle East & Africa UK Digital Payment Industry Revenue Share (%), by Mode of Payment 2024 & 2032
- Figure 24: Middle East & Africa UK Digital Payment Industry Revenue (Million), by End-user Industry 2024 & 2032
- Figure 25: Middle East & Africa UK Digital Payment Industry Revenue Share (%), by End-user Industry 2024 & 2032
- Figure 26: Middle East & Africa UK Digital Payment Industry Revenue (Million), by Country 2024 & 2032
- Figure 27: Middle East & Africa UK Digital Payment Industry Revenue Share (%), by Country 2024 & 2032
- Figure 28: Asia Pacific UK Digital Payment Industry Revenue (Million), by Mode of Payment 2024 & 2032
- Figure 29: Asia Pacific UK Digital Payment Industry Revenue Share (%), by Mode of Payment 2024 & 2032
- Figure 30: Asia Pacific UK Digital Payment Industry Revenue (Million), by End-user Industry 2024 & 2032
- Figure 31: Asia Pacific UK Digital Payment Industry Revenue Share (%), by End-user Industry 2024 & 2032
- Figure 32: Asia Pacific UK Digital Payment Industry Revenue (Million), by Country 2024 & 2032
- Figure 33: Asia Pacific UK Digital Payment Industry Revenue Share (%), by Country 2024 & 2032
List of Tables
- Table 1: Global UK Digital Payment Industry Revenue Million Forecast, by Region 2019 & 2032
- Table 2: Global UK Digital Payment Industry Revenue Million Forecast, by Mode of Payment 2019 & 2032
- Table 3: Global UK Digital Payment Industry Revenue Million Forecast, by End-user Industry 2019 & 2032
- Table 4: Global UK Digital Payment Industry Revenue Million Forecast, by Region 2019 & 2032
- Table 5: Global UK Digital Payment Industry Revenue Million Forecast, by Country 2019 & 2032
- Table 6: England UK Digital Payment Industry Revenue (Million) Forecast, by Application 2019 & 2032
- Table 7: Wales UK Digital Payment Industry Revenue (Million) Forecast, by Application 2019 & 2032
- Table 8: Scotland UK Digital Payment Industry Revenue (Million) Forecast, by Application 2019 & 2032
- Table 9: Northern UK Digital Payment Industry Revenue (Million) Forecast, by Application 2019 & 2032
- Table 10: Ireland UK Digital Payment Industry Revenue (Million) Forecast, by Application 2019 & 2032
- Table 11: Global UK Digital Payment Industry Revenue Million Forecast, by Mode of Payment 2019 & 2032
- Table 12: Global UK Digital Payment Industry Revenue Million Forecast, by End-user Industry 2019 & 2032
- Table 13: Global UK Digital Payment Industry Revenue Million Forecast, by Country 2019 & 2032
- Table 14: United States UK Digital Payment Industry Revenue (Million) Forecast, by Application 2019 & 2032
- Table 15: Canada UK Digital Payment Industry Revenue (Million) Forecast, by Application 2019 & 2032
- Table 16: Mexico UK Digital Payment Industry Revenue (Million) Forecast, by Application 2019 & 2032
- Table 17: Global UK Digital Payment Industry Revenue Million Forecast, by Mode of Payment 2019 & 2032
- Table 18: Global UK Digital Payment Industry Revenue Million Forecast, by End-user Industry 2019 & 2032
- Table 19: Global UK Digital Payment Industry Revenue Million Forecast, by Country 2019 & 2032
- Table 20: Brazil UK Digital Payment Industry Revenue (Million) Forecast, by Application 2019 & 2032
- Table 21: Argentina UK Digital Payment Industry Revenue (Million) Forecast, by Application 2019 & 2032
- Table 22: Rest of South America UK Digital Payment Industry Revenue (Million) Forecast, by Application 2019 & 2032
- Table 23: Global UK Digital Payment Industry Revenue Million Forecast, by Mode of Payment 2019 & 2032
- Table 24: Global UK Digital Payment Industry Revenue Million Forecast, by End-user Industry 2019 & 2032
- Table 25: Global UK Digital Payment Industry Revenue Million Forecast, by Country 2019 & 2032
- Table 26: United Kingdom UK Digital Payment Industry Revenue (Million) Forecast, by Application 2019 & 2032
- Table 27: Germany UK Digital Payment Industry Revenue (Million) Forecast, by Application 2019 & 2032
- Table 28: France UK Digital Payment Industry Revenue (Million) Forecast, by Application 2019 & 2032
- Table 29: Italy UK Digital Payment Industry Revenue (Million) Forecast, by Application 2019 & 2032
- Table 30: Spain UK Digital Payment Industry Revenue (Million) Forecast, by Application 2019 & 2032
- Table 31: Russia UK Digital Payment Industry Revenue (Million) Forecast, by Application 2019 & 2032
- Table 32: Benelux UK Digital Payment Industry Revenue (Million) Forecast, by Application 2019 & 2032
- Table 33: Nordics UK Digital Payment Industry Revenue (Million) Forecast, by Application 2019 & 2032
- Table 34: Rest of Europe UK Digital Payment Industry Revenue (Million) Forecast, by Application 2019 & 2032
- Table 35: Global UK Digital Payment Industry Revenue Million Forecast, by Mode of Payment 2019 & 2032
- Table 36: Global UK Digital Payment Industry Revenue Million Forecast, by End-user Industry 2019 & 2032
- Table 37: Global UK Digital Payment Industry Revenue Million Forecast, by Country 2019 & 2032
- Table 38: Turkey UK Digital Payment Industry Revenue (Million) Forecast, by Application 2019 & 2032
- Table 39: Israel UK Digital Payment Industry Revenue (Million) Forecast, by Application 2019 & 2032
- Table 40: GCC UK Digital Payment Industry Revenue (Million) Forecast, by Application 2019 & 2032
- Table 41: North Africa UK Digital Payment Industry Revenue (Million) Forecast, by Application 2019 & 2032
- Table 42: South Africa UK Digital Payment Industry Revenue (Million) Forecast, by Application 2019 & 2032
- Table 43: Rest of Middle East & Africa UK Digital Payment Industry Revenue (Million) Forecast, by Application 2019 & 2032
- Table 44: Global UK Digital Payment Industry Revenue Million Forecast, by Mode of Payment 2019 & 2032
- Table 45: Global UK Digital Payment Industry Revenue Million Forecast, by End-user Industry 2019 & 2032
- Table 46: Global UK Digital Payment Industry Revenue Million Forecast, by Country 2019 & 2032
- Table 47: China UK Digital Payment Industry Revenue (Million) Forecast, by Application 2019 & 2032
- Table 48: India UK Digital Payment Industry Revenue (Million) Forecast, by Application 2019 & 2032
- Table 49: Japan UK Digital Payment Industry Revenue (Million) Forecast, by Application 2019 & 2032
- Table 50: South Korea UK Digital Payment Industry Revenue (Million) Forecast, by Application 2019 & 2032
- Table 51: ASEAN UK Digital Payment Industry Revenue (Million) Forecast, by Application 2019 & 2032
- Table 52: Oceania UK Digital Payment Industry Revenue (Million) Forecast, by Application 2019 & 2032
- Table 53: Rest of Asia Pacific UK Digital Payment Industry Revenue (Million) Forecast, by Application 2019 & 2032
Frequently Asked Questions
1. What is the projected Compound Annual Growth Rate (CAGR) of the UK Digital Payment Industry?
The projected CAGR is approximately 11.60%.
2. Which companies are prominent players in the UK Digital Payment Industry?
Key companies in the market include Visa Inc, Klarna Inc, Worldpay Inc, Stripe Inc, 2Checkout com Inc, PayPoint plc, Amazon Payments Inc, SumUp Inc *List Not Exhaustive, PayPal Payments Private Limited, Mastercard Inc.
3. What are the main segments of the UK Digital Payment Industry?
The market segments include Mode of Payment, End-user Industry.
4. Can you provide details about the market size?
The market size is estimated to be USD 490.77 Million as of 2022.
5. What are some drivers contributing to market growth?
High Proliferation of E-commerce. including the rise of m-commerce and cross-border e-commerce supported by the increase in purchasing power; Enablement Programs by Key Retailers and Government encouraging digitization of the market; Growth of Real-time Payments. especially Buy Now Pay Later in the country.
6. What are the notable trends driving market growth?
Card Payments to Witness Significant Growth.
7. Are there any restraints impacting market growth?
; Stringent Regulations in the Payments Industry.
8. Can you provide examples of recent developments in the market?
November 2023 - Square launched Tap to Pay on iPhone across the United Kingdom, making it the third market globally where the company will offer the technology to its sellers. Available within the Square for Retail, Square Point of Sale, and Square Appointments iOS apps, Tap to Pay on iPhone enables sellers of all sizes to accept contactless payments directly from their iPhone, without additional hardware required and at no extra cost.
9. What pricing options are available for accessing the report?
Pricing options include single-user, multi-user, and enterprise licenses priced at USD 3800, USD 4500, and USD 5800 respectively.
10. Is the market size provided in terms of value or volume?
The market size is provided in terms of value, measured in Million.
11. Are there any specific market keywords associated with the report?
Yes, the market keyword associated with the report is "UK Digital Payment Industry," which aids in identifying and referencing the specific market segment covered.
12. How do I determine which pricing option suits my needs best?
The pricing options vary based on user requirements and access needs. Individual users may opt for single-user licenses, while businesses requiring broader access may choose multi-user or enterprise licenses for cost-effective access to the report.
13. Are there any additional resources or data provided in the UK Digital Payment Industry report?
While the report offers comprehensive insights, it's advisable to review the specific contents or supplementary materials provided to ascertain if additional resources or data are available.
14. How can I stay updated on further developments or reports in the UK Digital Payment Industry?
To stay informed about further developments, trends, and reports in the UK Digital Payment Industry, consider subscribing to industry newsletters, following relevant companies and organizations, or regularly checking reputable industry news sources and publications.
Methodology
Step 1 - Identification of Relevant Samples Size from Population Database


Step 2 - Approaches for Defining Global Market Size (Value, Volume* & Price*)

Note*: In applicable scenarios
Step 3 - Data Sources
Primary Research
- Web Analytics
- Survey Reports
- Research Institute
- Latest Research Reports
- Opinion Leaders
Secondary Research
- Annual Reports
- White Paper
- Latest Press Release
- Industry Association
- Paid Database
- Investor Presentations

Step 4 - Data Triangulation
Involves using different sources of information in order to increase the validity of a study
These sources are likely to be stakeholders in a program - participants, other researchers, program staff, other community members, and so on.
Then we put all data in single framework & apply various statistical tools to find out the dynamic on the market.
During the analysis stage, feedback from the stakeholder groups would be compared to determine areas of agreement as well as areas of divergence


