
Key Insights
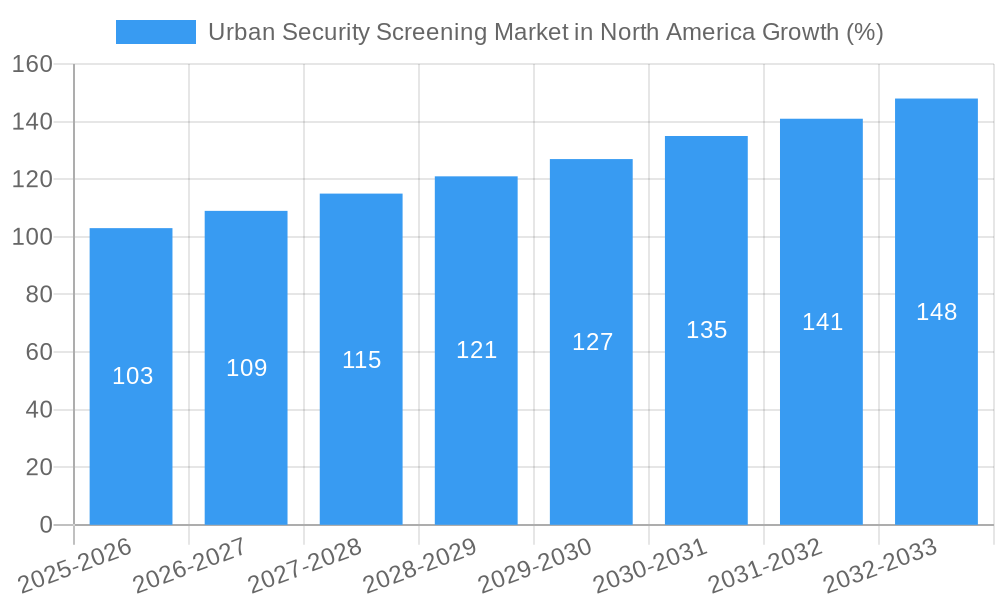
The North American urban security screening market, valued at $2.19 billion in 2025, is projected to experience robust growth, driven by increasing concerns about terrorism, crime, and mass shootings. This necessitates heightened security measures across various sectors, including corporate buildings, transportation hubs, and government facilities. The market's expansion is fueled by technological advancements in screening technologies, such as the adoption of millimeter-wave scanners offering faster and more efficient screening processes compared to traditional X-ray systems, and the increasing integration of AI and machine learning for enhanced threat detection. Furthermore, the growing demand for improved data center security and the rising adoption of cloud-based security solutions are major contributors to market growth. While regulatory compliance and the high initial investment costs associated with implementing new security technologies present challenges, the overall market outlook remains positive, supported by continuous innovation and a growing need for comprehensive security solutions.
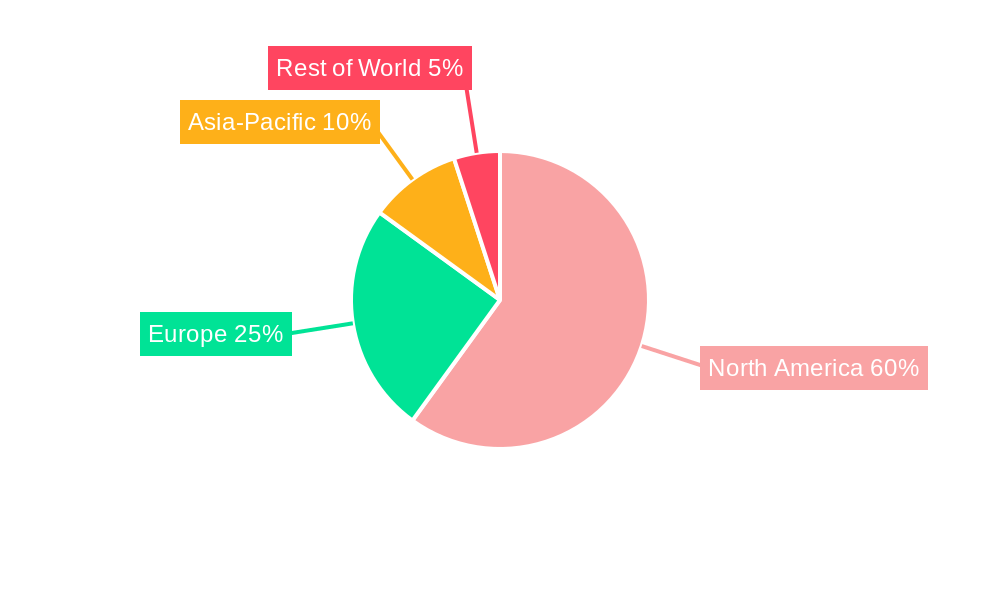
The market segmentation reveals significant opportunities across product types, with millimeter-wave products and advanced X-ray systems gaining traction due to their superior detection capabilities. The end-user industry segmentation showcases strong demand from corporate buildings, transportation, and government sectors, reflecting the diverse applications of urban security screening technologies. Within North America, the United States holds the largest market share due to its larger population density and higher security spending compared to Canada. The forecast period (2025-2033) anticipates a continuation of this growth trajectory, fueled by ongoing technological improvements and increasing government initiatives to bolster national security and public safety. This expansion is further influenced by the rising adoption of multi-modal screening solutions that combine various technologies for comprehensive threat detection, offering a complete security profile of individuals and their belongings.
Urban Security Screening Market in North America: A Comprehensive Market Report (2019-2033)
This in-depth report provides a comprehensive analysis of the North American urban security screening market, offering invaluable insights for industry professionals, investors, and strategic decision-makers. Covering the period from 2019 to 2033, with a base year of 2025, this report forecasts market growth and identifies key trends shaping this crucial sector. The study meticulously analyzes market segmentation by product type, end-user industry, and country (United States and Canada), providing granular data and actionable recommendations.
Urban Security Screening Market in North America Market Structure & Innovation Trends
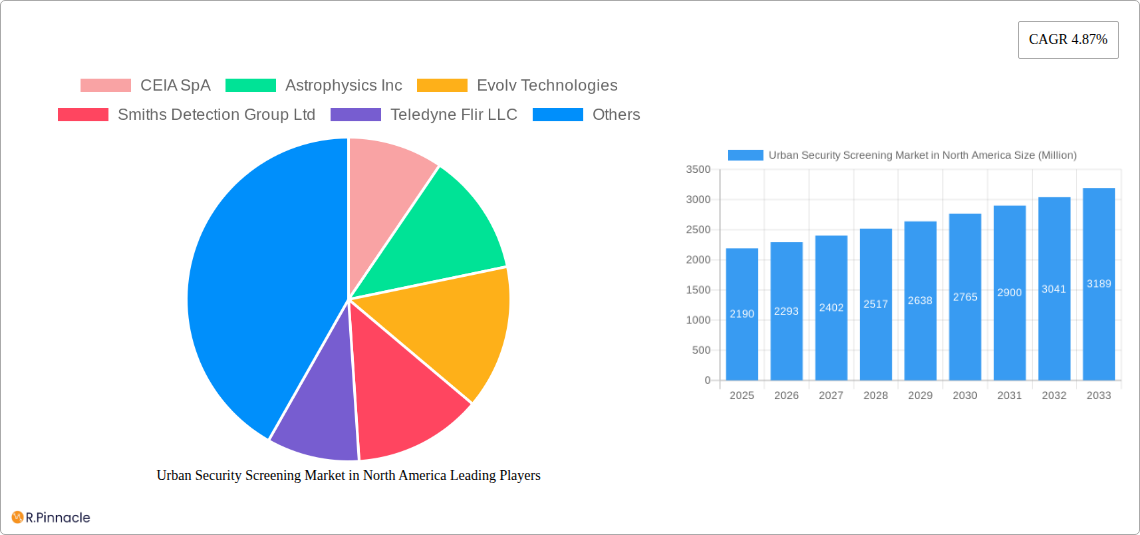
The North American urban security screening market is characterized by a moderately concentrated structure, with key players like Smiths Detection Group Ltd, Teledyne Flir LLC, and Evolv Technologies holding significant market share. However, the market also features numerous smaller players and niche providers, fostering competition and innovation. Market share data for 2024 indicates that the top 5 players hold approximately xx% of the market, while the remaining share is distributed among numerous competitors. The estimated market value in 2025 is $xx Million.
Innovation is a key driver, fueled by advancements in technologies like millimeter wave scanning, AI-powered threat detection, and improved X-ray imaging. Regulatory frameworks, particularly those related to homeland security and public safety, heavily influence market dynamics. The market also witnesses ongoing mergers and acquisitions (M&A) activity, with notable deals totaling an estimated $xx Million in the past five years. Product substitutes, including enhanced physical security measures, also impact market growth. End-user demographics are diverse, including government agencies, corporate entities, and transportation hubs.
- Market Concentration: Moderately concentrated, with top 5 players holding approximately xx% market share in 2024.
- Innovation Drivers: Advancements in millimeter wave, AI, and X-ray technologies.
- Regulatory Framework: Significant influence from homeland security and public safety regulations.
- M&A Activity: Estimated $xx Million in deal value over the past five years.
- Product Substitutes: Enhanced physical security measures.
Urban Security Screening Market in North America Market Dynamics & Trends
The North American urban security screening market is experiencing robust growth, driven by increasing concerns over terrorism, crime, and the need for enhanced public safety. Technological advancements, particularly in AI-powered threat detection and improved image processing, are significantly impacting market dynamics. The market displays a strong preference for non-invasive screening technologies that minimize passenger inconvenience while ensuring high levels of security. This preference is further amplified by rising labor costs and the need for efficient screening processes. Intense competition among established players and emerging startups is driving innovation and price optimization. The market’s CAGR from 2025 to 2033 is projected to be xx%, with market penetration expected to reach xx% by 2033. Specific factors such as the increasing adoption of advanced technologies in airports and the growing demand for security solutions in corporate buildings and transportation hubs are significant contributors to this growth.
Dominant Regions & Segments in Urban Security Screening Market in North America
The United States dominates the North American urban security screening market, driven by its robust economy, higher security concerns, and extensive infrastructure. Within the product type segment, X-ray products hold the largest market share, while the end-user industry segment is led by Government Buildings and Transportation.
Key Drivers for U.S. Dominance:
- Robust economy and higher security spending.
- Extensive transportation infrastructure requiring advanced screening solutions.
- Stringent government regulations.
Key Drivers for X-ray Products Dominance:
- Established technology with continuous advancements in image processing.
- Versatility in detecting various threats.
- Relatively lower cost compared to some other technologies.
Key Drivers for Government Buildings and Transportation Dominance:
- High security requirements and stringent regulations.
- Increased passenger volume in transportation hubs necessitating efficient screening.
- Significant government investment in security infrastructure.
The Canadian market exhibits steady growth, driven by factors similar to the United States, although on a smaller scale. The market size is expected to reach $xx Million by 2033.
Urban Security Screening Market in North America Product Innovations
Recent product innovations focus on enhancing speed, accuracy, and user-friendliness. AI-powered threat detection, improved image processing algorithms, and the development of more compact and portable screening systems are prominent trends. Companies are emphasizing ease of use and reduced passenger wait times, which is critical in high-traffic areas such as airports and transportation hubs. These advancements cater to the growing demand for efficient and effective security measures that minimize disruption.
Report Scope & Segmentation Analysis
This report segments the North American urban security screening market across several key parameters:
By Product Type: X-ray Products, Millimeter Wave Products, Metal Detectors, Radiation Detection Products, Chemicals and Trace Detection Products. Each segment exhibits varying growth rates, with X-ray products currently holding the largest market share, driven by their proven effectiveness and versatility.
By End-user Industry: Corporate Buildings, Mailroom Screening, Warehouse and Logistics, Government Buildings, Transportation, Data Centers, Law Enforcement. Growth varies across these segments, with Government Buildings and Transportation sectors experiencing faster growth due to stringent security requirements.
By Country: United States, Canada. The United States dominates the market due to its larger economy and higher security spending.
Growth projections for each segment are detailed within the full report, along with competitive landscape analysis.
Key Drivers of Urban Security Screening Market in North America Growth
Several factors propel market growth: rising security concerns post-9/11, technological advancements (AI-powered threat detection and improved image processing), increased government spending on security infrastructure, and stringent regulations mandating advanced security measures in public spaces and transportation hubs. The growth of e-commerce and the consequent increase in logistics activities also drive demand for effective warehouse and mailroom screening solutions.
Challenges in the Urban Security Screening Market in North America Sector
Challenges include the high initial investment costs associated with implementing advanced security systems, the ongoing need for skilled personnel to operate and maintain these systems, and the potential for regulatory hurdles and evolving security threats. Supply chain disruptions can also affect the availability and cost of essential components, impacting market growth. Competitive pressures from both established players and new entrants create a dynamic and challenging market environment.
Emerging Opportunities in Urban Security Screening Market in North America
Emerging opportunities lie in the development of AI-powered systems, integration of IoT technologies for real-time monitoring and threat analysis, and expanding into new markets like data centers and critical infrastructure facilities. The development of more compact and portable screening solutions caters to the increasing need for security in diverse settings. Focus on user-friendly interfaces and reduced passenger wait times will continue to shape innovation and market acceptance.
Leading Players in the Urban Security Screening Market in North America Market
- CEIA SpA
- Astrophysics Inc
- Evolv Technologies
- Smiths Detection Group Ltd
- Teledyne Flir LLC
- Vehant Technologies
- Thermo Fisher Scientific Inc
- Leidos
- VOTI Detection Inc
- Rapiscan Systems Limited
- Rohde & Schwarz
- Linev Systems US Inc
- Tek84 Inc
- Nuctech Company Ltd
- Liberty Defense
- 3DX-Ray Ltd (Image Scan Holdings PLC)
- Bruker Corporation
Key Developments in Urban Security Screening Market in North America Industry
- 2023 Q3: Smiths Detection launched a new AI-powered threat detection system.
- 2022 Q4: Evolv Technologies acquired a smaller competitor, expanding its market share.
- 2021 Q2: New regulations mandated advanced screening technologies in major transportation hubs. (Specific examples of regulations would be listed here in the full report)
Future Outlook for Urban Security Screening Market in North America Market
The future of the North American urban security screening market looks promising, driven by continuous technological advancements, increased security awareness, and growing government spending. The market will witness further integration of AI and IoT technologies, leading to more efficient, effective, and user-friendly security solutions. Strategic partnerships and acquisitions will continue to shape the competitive landscape. Expansion into new and emerging markets will offer significant growth opportunities for established players and new entrants.
Urban Security Screening Market in North America Segmentation
-
1. Product Type
- 1.1. X-ray Products
- 1.2. Millimeter Wave Products
- 1.3. Metal Detectors
- 1.4. Radiation Detection Products
- 1.5. Chemicals and Trace Detection Products
-
2. End-user Industry
- 2.1. Corporate Buildings
- 2.2. Mailroom Screening
- 2.3. Warehouse and Logistics
- 2.4. Government Buildings
- 2.5. Transportation
- 2.6. Data Centers
- 2.7. Law Enforcement
Urban Security Screening Market in North America Segmentation By Geography
-
1. North America
- 1.1. United States
- 1.2. Canada
- 1.3. Mexico
-
2. South America
- 2.1. Brazil
- 2.2. Argentina
- 2.3. Rest of South America
-
3. Europe
- 3.1. United Kingdom
- 3.2. Germany
- 3.3. France
- 3.4. Italy
- 3.5. Spain
- 3.6. Russia
- 3.7. Benelux
- 3.8. Nordics
- 3.9. Rest of Europe
-
4. Middle East & Africa
- 4.1. Turkey
- 4.2. Israel
- 4.3. GCC
- 4.4. North Africa
- 4.5. South Africa
- 4.6. Rest of Middle East & Africa
-
5. Asia Pacific
- 5.1. China
- 5.2. India
- 5.3. Japan
- 5.4. South Korea
- 5.5. ASEAN
- 5.6. Oceania
- 5.7. Rest of Asia Pacific
Urban Security Screening Market in North America REPORT HIGHLIGHTS
| Aspects | Details |
|---|---|
| Study Period | 2019-2033 |
| Base Year | 2024 |
| Estimated Year | 2025 |
| Forecast Period | 2025-2033 |
| Historical Period | 2019-2024 |
| Growth Rate | CAGR of 4.87% from 2019-2033 |
| Segmentation |
|
Table of Contents
- 1. Introduction
- 1.1. Research Scope
- 1.2. Market Segmentation
- 1.3. Research Methodology
- 1.4. Definitions and Assumptions
- 2. Executive Summary
- 2.1. Introduction
- 3. Market Dynamics
- 3.1. Introduction
- 3.2. Market Drivers
- 3.2.1 Increasing Automation in the Security Screening Industry
- 3.2.2 Especially to Detect Advanced Threats
- 3.2.3 etc.; Upsurge in Terror Activities Across the Region; Increasing Government Initiatives on Security Inspection in Schools and Colleges; Increasing Government Initiatives for Smart Cities
- 3.3. Market Restrains
- 3.3.1 Supply Chain Issues Caused By Geopolitical Scenario and the COVID-19 Pandemic
- 3.3.2 etc.; High Installation and Maintenance Costs
- 3.4. Market Trends
- 3.4.1. Government Buildings to be the Fastest Growing End-user
- 4. Market Factor Analysis
- 4.1. Porters Five Forces
- 4.2. Supply/Value Chain
- 4.3. PESTEL analysis
- 4.4. Market Entropy
- 4.5. Patent/Trademark Analysis
- 5. Global Urban Security Screening Market in North America Analysis, Insights and Forecast, 2019-2031
- 5.1. Market Analysis, Insights and Forecast - by Product Type
- 5.1.1. X-ray Products
- 5.1.2. Millimeter Wave Products
- 5.1.3. Metal Detectors
- 5.1.4. Radiation Detection Products
- 5.1.5. Chemicals and Trace Detection Products
- 5.2. Market Analysis, Insights and Forecast - by End-user Industry
- 5.2.1. Corporate Buildings
- 5.2.2. Mailroom Screening
- 5.2.3. Warehouse and Logistics
- 5.2.4. Government Buildings
- 5.2.5. Transportation
- 5.2.6. Data Centers
- 5.2.7. Law Enforcement
- 5.3. Market Analysis, Insights and Forecast - by Region
- 5.3.1. North America
- 5.3.2. South America
- 5.3.3. Europe
- 5.3.4. Middle East & Africa
- 5.3.5. Asia Pacific
- 5.1. Market Analysis, Insights and Forecast - by Product Type
- 6. North America Urban Security Screening Market in North America Analysis, Insights and Forecast, 2019-2031
- 6.1. Market Analysis, Insights and Forecast - by Product Type
- 6.1.1. X-ray Products
- 6.1.2. Millimeter Wave Products
- 6.1.3. Metal Detectors
- 6.1.4. Radiation Detection Products
- 6.1.5. Chemicals and Trace Detection Products
- 6.2. Market Analysis, Insights and Forecast - by End-user Industry
- 6.2.1. Corporate Buildings
- 6.2.2. Mailroom Screening
- 6.2.3. Warehouse and Logistics
- 6.2.4. Government Buildings
- 6.2.5. Transportation
- 6.2.6. Data Centers
- 6.2.7. Law Enforcement
- 6.1. Market Analysis, Insights and Forecast - by Product Type
- 7. South America Urban Security Screening Market in North America Analysis, Insights and Forecast, 2019-2031
- 7.1. Market Analysis, Insights and Forecast - by Product Type
- 7.1.1. X-ray Products
- 7.1.2. Millimeter Wave Products
- 7.1.3. Metal Detectors
- 7.1.4. Radiation Detection Products
- 7.1.5. Chemicals and Trace Detection Products
- 7.2. Market Analysis, Insights and Forecast - by End-user Industry
- 7.2.1. Corporate Buildings
- 7.2.2. Mailroom Screening
- 7.2.3. Warehouse and Logistics
- 7.2.4. Government Buildings
- 7.2.5. Transportation
- 7.2.6. Data Centers
- 7.2.7. Law Enforcement
- 7.1. Market Analysis, Insights and Forecast - by Product Type
- 8. Europe Urban Security Screening Market in North America Analysis, Insights and Forecast, 2019-2031
- 8.1. Market Analysis, Insights and Forecast - by Product Type
- 8.1.1. X-ray Products
- 8.1.2. Millimeter Wave Products
- 8.1.3. Metal Detectors
- 8.1.4. Radiation Detection Products
- 8.1.5. Chemicals and Trace Detection Products
- 8.2. Market Analysis, Insights and Forecast - by End-user Industry
- 8.2.1. Corporate Buildings
- 8.2.2. Mailroom Screening
- 8.2.3. Warehouse and Logistics
- 8.2.4. Government Buildings
- 8.2.5. Transportation
- 8.2.6. Data Centers
- 8.2.7. Law Enforcement
- 8.1. Market Analysis, Insights and Forecast - by Product Type
- 9. Middle East & Africa Urban Security Screening Market in North America Analysis, Insights and Forecast, 2019-2031
- 9.1. Market Analysis, Insights and Forecast - by Product Type
- 9.1.1. X-ray Products
- 9.1.2. Millimeter Wave Products
- 9.1.3. Metal Detectors
- 9.1.4. Radiation Detection Products
- 9.1.5. Chemicals and Trace Detection Products
- 9.2. Market Analysis, Insights and Forecast - by End-user Industry
- 9.2.1. Corporate Buildings
- 9.2.2. Mailroom Screening
- 9.2.3. Warehouse and Logistics
- 9.2.4. Government Buildings
- 9.2.5. Transportation
- 9.2.6. Data Centers
- 9.2.7. Law Enforcement
- 9.1. Market Analysis, Insights and Forecast - by Product Type
- 10. Asia Pacific Urban Security Screening Market in North America Analysis, Insights and Forecast, 2019-2031
- 10.1. Market Analysis, Insights and Forecast - by Product Type
- 10.1.1. X-ray Products
- 10.1.2. Millimeter Wave Products
- 10.1.3. Metal Detectors
- 10.1.4. Radiation Detection Products
- 10.1.5. Chemicals and Trace Detection Products
- 10.2. Market Analysis, Insights and Forecast - by End-user Industry
- 10.2.1. Corporate Buildings
- 10.2.2. Mailroom Screening
- 10.2.3. Warehouse and Logistics
- 10.2.4. Government Buildings
- 10.2.5. Transportation
- 10.2.6. Data Centers
- 10.2.7. Law Enforcement
- 10.1. Market Analysis, Insights and Forecast - by Product Type
- 11. United States Urban Security Screening Market in North America Analysis, Insights and Forecast, 2019-2031
- 12. Canada Urban Security Screening Market in North America Analysis, Insights and Forecast, 2019-2031
- 13. Mexico Urban Security Screening Market in North America Analysis, Insights and Forecast, 2019-2031
- 14. Rest of North America Urban Security Screening Market in North America Analysis, Insights and Forecast, 2019-2031
- 15. Competitive Analysis
- 15.1. Global Market Share Analysis 2024
- 15.2. Company Profiles
- 15.2.1 CEIA SpA
- 15.2.1.1. Overview
- 15.2.1.2. Products
- 15.2.1.3. SWOT Analysis
- 15.2.1.4. Recent Developments
- 15.2.1.5. Financials (Based on Availability)
- 15.2.2 Astrophysics Inc
- 15.2.2.1. Overview
- 15.2.2.2. Products
- 15.2.2.3. SWOT Analysis
- 15.2.2.4. Recent Developments
- 15.2.2.5. Financials (Based on Availability)
- 15.2.3 Evolv Technologies
- 15.2.3.1. Overview
- 15.2.3.2. Products
- 15.2.3.3. SWOT Analysis
- 15.2.3.4. Recent Developments
- 15.2.3.5. Financials (Based on Availability)
- 15.2.4 Smiths Detection Group Ltd
- 15.2.4.1. Overview
- 15.2.4.2. Products
- 15.2.4.3. SWOT Analysis
- 15.2.4.4. Recent Developments
- 15.2.4.5. Financials (Based on Availability)
- 15.2.5 Teledyne Flir LLC
- 15.2.5.1. Overview
- 15.2.5.2. Products
- 15.2.5.3. SWOT Analysis
- 15.2.5.4. Recent Developments
- 15.2.5.5. Financials (Based on Availability)
- 15.2.6 Vehant Technologies
- 15.2.6.1. Overview
- 15.2.6.2. Products
- 15.2.6.3. SWOT Analysis
- 15.2.6.4. Recent Developments
- 15.2.6.5. Financials (Based on Availability)
- 15.2.7 Thermo Fisher Scientific Inc
- 15.2.7.1. Overview
- 15.2.7.2. Products
- 15.2.7.3. SWOT Analysis
- 15.2.7.4. Recent Developments
- 15.2.7.5. Financials (Based on Availability)
- 15.2.8 Leidos
- 15.2.8.1. Overview
- 15.2.8.2. Products
- 15.2.8.3. SWOT Analysis
- 15.2.8.4. Recent Developments
- 15.2.8.5. Financials (Based on Availability)
- 15.2.9 VOTI Detection Inc *List Not Exhaustive
- 15.2.9.1. Overview
- 15.2.9.2. Products
- 15.2.9.3. SWOT Analysis
- 15.2.9.4. Recent Developments
- 15.2.9.5. Financials (Based on Availability)
- 15.2.10 Rapiscan Systems Limited
- 15.2.10.1. Overview
- 15.2.10.2. Products
- 15.2.10.3. SWOT Analysis
- 15.2.10.4. Recent Developments
- 15.2.10.5. Financials (Based on Availability)
- 15.2.11 Rohde & Schwarz
- 15.2.11.1. Overview
- 15.2.11.2. Products
- 15.2.11.3. SWOT Analysis
- 15.2.11.4. Recent Developments
- 15.2.11.5. Financials (Based on Availability)
- 15.2.12 Linev Systems US Inc
- 15.2.12.1. Overview
- 15.2.12.2. Products
- 15.2.12.3. SWOT Analysis
- 15.2.12.4. Recent Developments
- 15.2.12.5. Financials (Based on Availability)
- 15.2.13 Tek84 Inc
- 15.2.13.1. Overview
- 15.2.13.2. Products
- 15.2.13.3. SWOT Analysis
- 15.2.13.4. Recent Developments
- 15.2.13.5. Financials (Based on Availability)
- 15.2.14 Nuctech Company Ltd
- 15.2.14.1. Overview
- 15.2.14.2. Products
- 15.2.14.3. SWOT Analysis
- 15.2.14.4. Recent Developments
- 15.2.14.5. Financials (Based on Availability)
- 15.2.15 Liberty Defense
- 15.2.15.1. Overview
- 15.2.15.2. Products
- 15.2.15.3. SWOT Analysis
- 15.2.15.4. Recent Developments
- 15.2.15.5. Financials (Based on Availability)
- 15.2.16 3DX-Ray Ltd (Image Scan Holdings PLC)
- 15.2.16.1. Overview
- 15.2.16.2. Products
- 15.2.16.3. SWOT Analysis
- 15.2.16.4. Recent Developments
- 15.2.16.5. Financials (Based on Availability)
- 15.2.17 Bruker Corporation
- 15.2.17.1. Overview
- 15.2.17.2. Products
- 15.2.17.3. SWOT Analysis
- 15.2.17.4. Recent Developments
- 15.2.17.5. Financials (Based on Availability)
- 15.2.1 CEIA SpA
List of Figures
- Figure 1: Global Urban Security Screening Market in North America Revenue Breakdown (Million, %) by Region 2024 & 2032
- Figure 2: North America Urban Security Screening Market in North America Revenue (Million), by Country 2024 & 2032
- Figure 3: North America Urban Security Screening Market in North America Revenue Share (%), by Country 2024 & 2032
- Figure 4: North America Urban Security Screening Market in North America Revenue (Million), by Product Type 2024 & 2032
- Figure 5: North America Urban Security Screening Market in North America Revenue Share (%), by Product Type 2024 & 2032
- Figure 6: North America Urban Security Screening Market in North America Revenue (Million), by End-user Industry 2024 & 2032
- Figure 7: North America Urban Security Screening Market in North America Revenue Share (%), by End-user Industry 2024 & 2032
- Figure 8: North America Urban Security Screening Market in North America Revenue (Million), by Country 2024 & 2032
- Figure 9: North America Urban Security Screening Market in North America Revenue Share (%), by Country 2024 & 2032
- Figure 10: South America Urban Security Screening Market in North America Revenue (Million), by Product Type 2024 & 2032
- Figure 11: South America Urban Security Screening Market in North America Revenue Share (%), by Product Type 2024 & 2032
- Figure 12: South America Urban Security Screening Market in North America Revenue (Million), by End-user Industry 2024 & 2032
- Figure 13: South America Urban Security Screening Market in North America Revenue Share (%), by End-user Industry 2024 & 2032
- Figure 14: South America Urban Security Screening Market in North America Revenue (Million), by Country 2024 & 2032
- Figure 15: South America Urban Security Screening Market in North America Revenue Share (%), by Country 2024 & 2032
- Figure 16: Europe Urban Security Screening Market in North America Revenue (Million), by Product Type 2024 & 2032
- Figure 17: Europe Urban Security Screening Market in North America Revenue Share (%), by Product Type 2024 & 2032
- Figure 18: Europe Urban Security Screening Market in North America Revenue (Million), by End-user Industry 2024 & 2032
- Figure 19: Europe Urban Security Screening Market in North America Revenue Share (%), by End-user Industry 2024 & 2032
- Figure 20: Europe Urban Security Screening Market in North America Revenue (Million), by Country 2024 & 2032
- Figure 21: Europe Urban Security Screening Market in North America Revenue Share (%), by Country 2024 & 2032
- Figure 22: Middle East & Africa Urban Security Screening Market in North America Revenue (Million), by Product Type 2024 & 2032
- Figure 23: Middle East & Africa Urban Security Screening Market in North America Revenue Share (%), by Product Type 2024 & 2032
- Figure 24: Middle East & Africa Urban Security Screening Market in North America Revenue (Million), by End-user Industry 2024 & 2032
- Figure 25: Middle East & Africa Urban Security Screening Market in North America Revenue Share (%), by End-user Industry 2024 & 2032
- Figure 26: Middle East & Africa Urban Security Screening Market in North America Revenue (Million), by Country 2024 & 2032
- Figure 27: Middle East & Africa Urban Security Screening Market in North America Revenue Share (%), by Country 2024 & 2032
- Figure 28: Asia Pacific Urban Security Screening Market in North America Revenue (Million), by Product Type 2024 & 2032
- Figure 29: Asia Pacific Urban Security Screening Market in North America Revenue Share (%), by Product Type 2024 & 2032
- Figure 30: Asia Pacific Urban Security Screening Market in North America Revenue (Million), by End-user Industry 2024 & 2032
- Figure 31: Asia Pacific Urban Security Screening Market in North America Revenue Share (%), by End-user Industry 2024 & 2032
- Figure 32: Asia Pacific Urban Security Screening Market in North America Revenue (Million), by Country 2024 & 2032
- Figure 33: Asia Pacific Urban Security Screening Market in North America Revenue Share (%), by Country 2024 & 2032
List of Tables
- Table 1: Global Urban Security Screening Market in North America Revenue Million Forecast, by Region 2019 & 2032
- Table 2: Global Urban Security Screening Market in North America Revenue Million Forecast, by Product Type 2019 & 2032
- Table 3: Global Urban Security Screening Market in North America Revenue Million Forecast, by End-user Industry 2019 & 2032
- Table 4: Global Urban Security Screening Market in North America Revenue Million Forecast, by Region 2019 & 2032
- Table 5: Global Urban Security Screening Market in North America Revenue Million Forecast, by Country 2019 & 2032
- Table 6: United States Urban Security Screening Market in North America Revenue (Million) Forecast, by Application 2019 & 2032
- Table 7: Canada Urban Security Screening Market in North America Revenue (Million) Forecast, by Application 2019 & 2032
- Table 8: Mexico Urban Security Screening Market in North America Revenue (Million) Forecast, by Application 2019 & 2032
- Table 9: Rest of North America Urban Security Screening Market in North America Revenue (Million) Forecast, by Application 2019 & 2032
- Table 10: Global Urban Security Screening Market in North America Revenue Million Forecast, by Product Type 2019 & 2032
- Table 11: Global Urban Security Screening Market in North America Revenue Million Forecast, by End-user Industry 2019 & 2032
- Table 12: Global Urban Security Screening Market in North America Revenue Million Forecast, by Country 2019 & 2032
- Table 13: United States Urban Security Screening Market in North America Revenue (Million) Forecast, by Application 2019 & 2032
- Table 14: Canada Urban Security Screening Market in North America Revenue (Million) Forecast, by Application 2019 & 2032
- Table 15: Mexico Urban Security Screening Market in North America Revenue (Million) Forecast, by Application 2019 & 2032
- Table 16: Global Urban Security Screening Market in North America Revenue Million Forecast, by Product Type 2019 & 2032
- Table 17: Global Urban Security Screening Market in North America Revenue Million Forecast, by End-user Industry 2019 & 2032
- Table 18: Global Urban Security Screening Market in North America Revenue Million Forecast, by Country 2019 & 2032
- Table 19: Brazil Urban Security Screening Market in North America Revenue (Million) Forecast, by Application 2019 & 2032
- Table 20: Argentina Urban Security Screening Market in North America Revenue (Million) Forecast, by Application 2019 & 2032
- Table 21: Rest of South America Urban Security Screening Market in North America Revenue (Million) Forecast, by Application 2019 & 2032
- Table 22: Global Urban Security Screening Market in North America Revenue Million Forecast, by Product Type 2019 & 2032
- Table 23: Global Urban Security Screening Market in North America Revenue Million Forecast, by End-user Industry 2019 & 2032
- Table 24: Global Urban Security Screening Market in North America Revenue Million Forecast, by Country 2019 & 2032
- Table 25: United Kingdom Urban Security Screening Market in North America Revenue (Million) Forecast, by Application 2019 & 2032
- Table 26: Germany Urban Security Screening Market in North America Revenue (Million) Forecast, by Application 2019 & 2032
- Table 27: France Urban Security Screening Market in North America Revenue (Million) Forecast, by Application 2019 & 2032
- Table 28: Italy Urban Security Screening Market in North America Revenue (Million) Forecast, by Application 2019 & 2032
- Table 29: Spain Urban Security Screening Market in North America Revenue (Million) Forecast, by Application 2019 & 2032
- Table 30: Russia Urban Security Screening Market in North America Revenue (Million) Forecast, by Application 2019 & 2032
- Table 31: Benelux Urban Security Screening Market in North America Revenue (Million) Forecast, by Application 2019 & 2032
- Table 32: Nordics Urban Security Screening Market in North America Revenue (Million) Forecast, by Application 2019 & 2032
- Table 33: Rest of Europe Urban Security Screening Market in North America Revenue (Million) Forecast, by Application 2019 & 2032
- Table 34: Global Urban Security Screening Market in North America Revenue Million Forecast, by Product Type 2019 & 2032
- Table 35: Global Urban Security Screening Market in North America Revenue Million Forecast, by End-user Industry 2019 & 2032
- Table 36: Global Urban Security Screening Market in North America Revenue Million Forecast, by Country 2019 & 2032
- Table 37: Turkey Urban Security Screening Market in North America Revenue (Million) Forecast, by Application 2019 & 2032
- Table 38: Israel Urban Security Screening Market in North America Revenue (Million) Forecast, by Application 2019 & 2032
- Table 39: GCC Urban Security Screening Market in North America Revenue (Million) Forecast, by Application 2019 & 2032
- Table 40: North Africa Urban Security Screening Market in North America Revenue (Million) Forecast, by Application 2019 & 2032
- Table 41: South Africa Urban Security Screening Market in North America Revenue (Million) Forecast, by Application 2019 & 2032
- Table 42: Rest of Middle East & Africa Urban Security Screening Market in North America Revenue (Million) Forecast, by Application 2019 & 2032
- Table 43: Global Urban Security Screening Market in North America Revenue Million Forecast, by Product Type 2019 & 2032
- Table 44: Global Urban Security Screening Market in North America Revenue Million Forecast, by End-user Industry 2019 & 2032
- Table 45: Global Urban Security Screening Market in North America Revenue Million Forecast, by Country 2019 & 2032
- Table 46: China Urban Security Screening Market in North America Revenue (Million) Forecast, by Application 2019 & 2032
- Table 47: India Urban Security Screening Market in North America Revenue (Million) Forecast, by Application 2019 & 2032
- Table 48: Japan Urban Security Screening Market in North America Revenue (Million) Forecast, by Application 2019 & 2032
- Table 49: South Korea Urban Security Screening Market in North America Revenue (Million) Forecast, by Application 2019 & 2032
- Table 50: ASEAN Urban Security Screening Market in North America Revenue (Million) Forecast, by Application 2019 & 2032
- Table 51: Oceania Urban Security Screening Market in North America Revenue (Million) Forecast, by Application 2019 & 2032
- Table 52: Rest of Asia Pacific Urban Security Screening Market in North America Revenue (Million) Forecast, by Application 2019 & 2032
Frequently Asked Questions
1. What is the projected Compound Annual Growth Rate (CAGR) of the Urban Security Screening Market in North America?
The projected CAGR is approximately 4.87%.
2. Which companies are prominent players in the Urban Security Screening Market in North America?
Key companies in the market include CEIA SpA, Astrophysics Inc, Evolv Technologies, Smiths Detection Group Ltd, Teledyne Flir LLC, Vehant Technologies, Thermo Fisher Scientific Inc, Leidos, VOTI Detection Inc *List Not Exhaustive, Rapiscan Systems Limited, Rohde & Schwarz, Linev Systems US Inc, Tek84 Inc, Nuctech Company Ltd, Liberty Defense, 3DX-Ray Ltd (Image Scan Holdings PLC), Bruker Corporation.
3. What are the main segments of the Urban Security Screening Market in North America?
The market segments include Product Type, End-user Industry.
4. Can you provide details about the market size?
The market size is estimated to be USD 2.19 Million as of 2022.
5. What are some drivers contributing to market growth?
Increasing Automation in the Security Screening Industry. Especially to Detect Advanced Threats. etc.; Upsurge in Terror Activities Across the Region; Increasing Government Initiatives on Security Inspection in Schools and Colleges; Increasing Government Initiatives for Smart Cities.
6. What are the notable trends driving market growth?
Government Buildings to be the Fastest Growing End-user.
7. Are there any restraints impacting market growth?
Supply Chain Issues Caused By Geopolitical Scenario and the COVID-19 Pandemic. etc.; High Installation and Maintenance Costs.
8. Can you provide examples of recent developments in the market?
N/A
9. What pricing options are available for accessing the report?
Pricing options include single-user, multi-user, and enterprise licenses priced at USD 4750, USD 4950, and USD 6800 respectively.
10. Is the market size provided in terms of value or volume?
The market size is provided in terms of value, measured in Million.
11. Are there any specific market keywords associated with the report?
Yes, the market keyword associated with the report is "Urban Security Screening Market in North America," which aids in identifying and referencing the specific market segment covered.
12. How do I determine which pricing option suits my needs best?
The pricing options vary based on user requirements and access needs. Individual users may opt for single-user licenses, while businesses requiring broader access may choose multi-user or enterprise licenses for cost-effective access to the report.
13. Are there any additional resources or data provided in the Urban Security Screening Market in North America report?
While the report offers comprehensive insights, it's advisable to review the specific contents or supplementary materials provided to ascertain if additional resources or data are available.
14. How can I stay updated on further developments or reports in the Urban Security Screening Market in North America?
To stay informed about further developments, trends, and reports in the Urban Security Screening Market in North America, consider subscribing to industry newsletters, following relevant companies and organizations, or regularly checking reputable industry news sources and publications.
Methodology
Step 1 - Identification of Relevant Samples Size from Population Database


Step 2 - Approaches for Defining Global Market Size (Value, Volume* & Price*)

Note*: In applicable scenarios
Step 3 - Data Sources
Primary Research
- Web Analytics
- Survey Reports
- Research Institute
- Latest Research Reports
- Opinion Leaders
Secondary Research
- Annual Reports
- White Paper
- Latest Press Release
- Industry Association
- Paid Database
- Investor Presentations

Step 4 - Data Triangulation
Involves using different sources of information in order to increase the validity of a study
These sources are likely to be stakeholders in a program - participants, other researchers, program staff, other community members, and so on.
Then we put all data in single framework & apply various statistical tools to find out the dynamic on the market.
During the analysis stage, feedback from the stakeholder groups would be compared to determine areas of agreement as well as areas of divergence


