
Key Insights
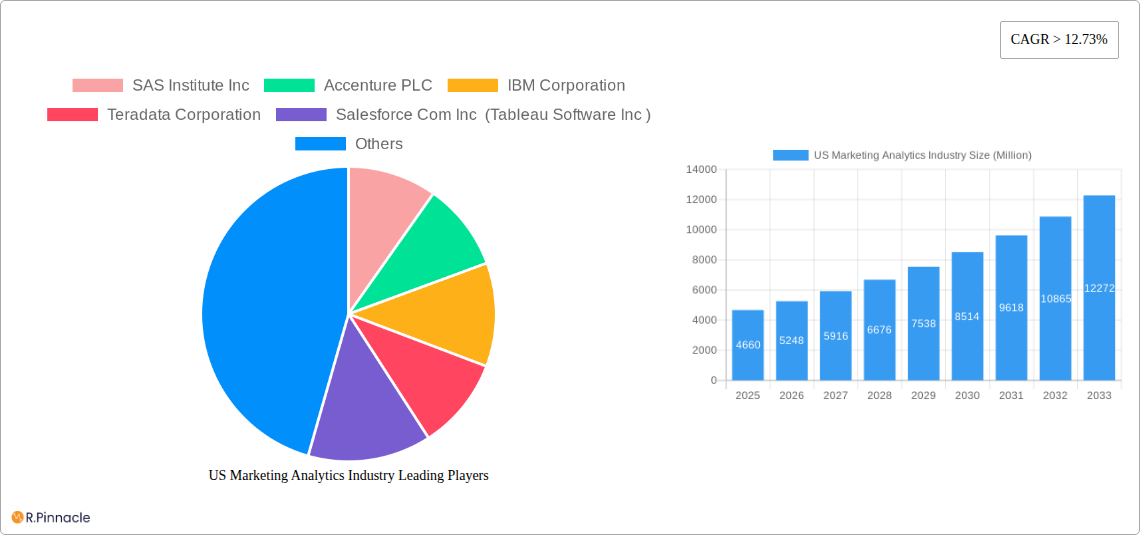
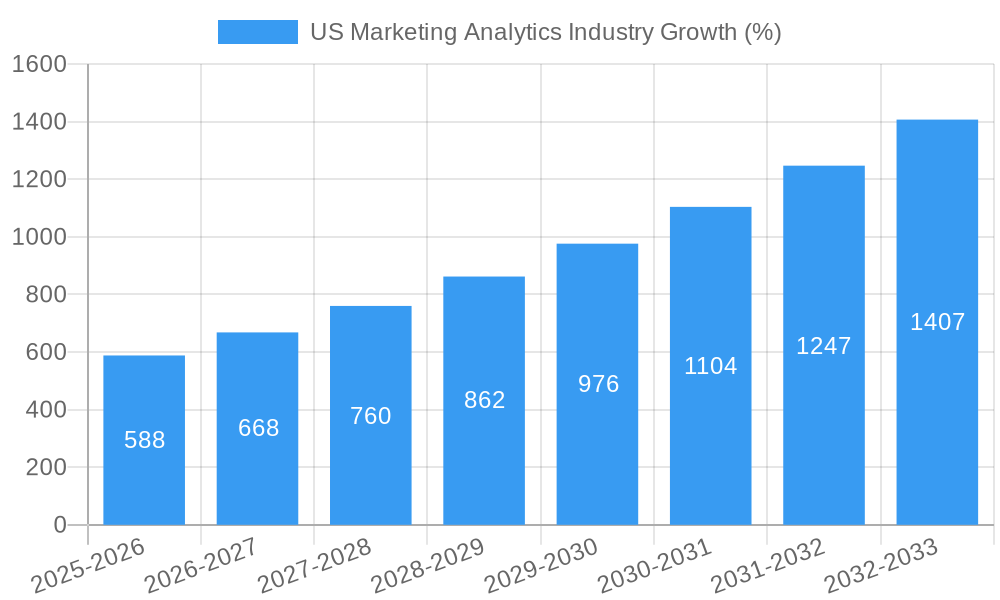
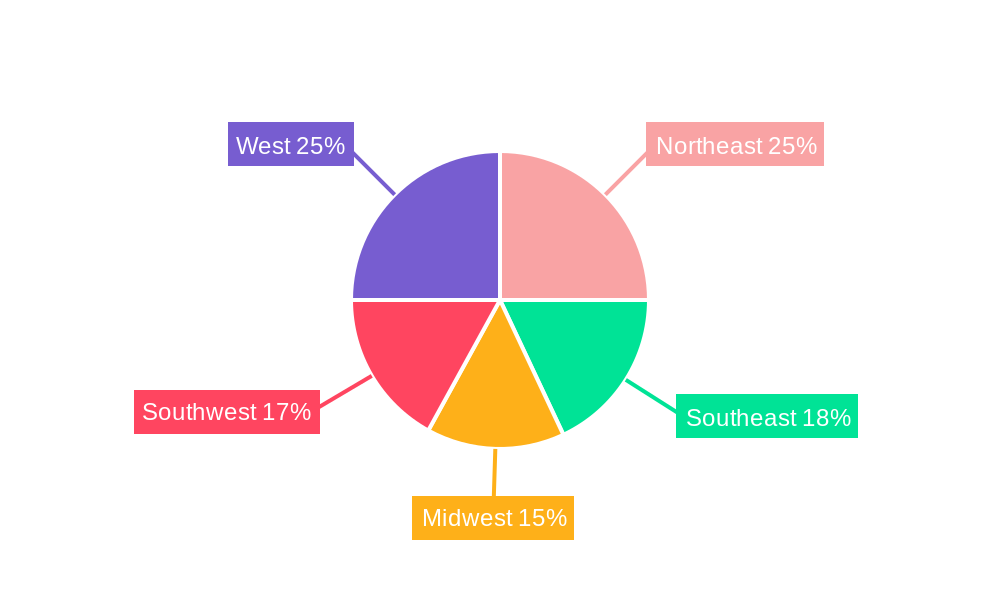
The US marketing analytics industry is experiencing robust growth, projected to reach a market size of $4.66 billion in 2025, expanding at a Compound Annual Growth Rate (CAGR) exceeding 12.73%. This surge is driven by several key factors. Firstly, the increasing reliance on data-driven decision-making across various sectors like retail, BFSI (Banking, Financial Services, and Insurance), and healthcare is fueling demand for sophisticated analytics solutions. Secondly, the proliferation of digital marketing channels—including online marketing, email marketing, social media marketing, and content marketing— necessitates advanced analytics to optimize campaigns and measure ROI effectively. The shift towards cloud-based deployments further accelerates adoption, offering scalability and cost-effectiveness compared to on-premise solutions. Competition is fierce, with major players like SAS Institute, Accenture, IBM, Salesforce (including Tableau), Microsoft, Adobe, and Oracle vying for market share. Regional variations exist within the US, with likely higher concentrations in technology hubs like the West and Northeast. While growth is projected to continue, challenges such as data security concerns and the need for skilled analysts could potentially temper the pace of expansion in the coming years.
Looking ahead to 2033, the continued digital transformation across industries, coupled with the increasing sophistication of marketing analytics tools and techniques, will likely sustain this robust growth trajectory. The adoption of artificial intelligence (AI) and machine learning (ML) within marketing analytics is a significant trend, promising more predictive and personalized marketing campaigns. However, businesses will need to invest heavily in upskilling their workforce to effectively utilize these advanced technologies and interpret the insights generated. Furthermore, maintaining data privacy and compliance with evolving regulations will be crucial for sustained industry growth and the building of consumer trust. The competitive landscape will continue to evolve, with mergers and acquisitions, and the development of innovative solutions shaping the future of the US marketing analytics market.
US Marketing Analytics Industry Market Report: 2019-2033
This comprehensive report provides an in-depth analysis of the US Marketing Analytics industry, covering market size, segmentation, growth drivers, challenges, and future outlook. The report leverages data from the historical period (2019-2024), base year (2025), and estimated year (2025), projecting market trends through 2033. The analysis encompasses key players, including SAS Institute Inc, Accenture PLC, IBM Corporation, Teradata Corporation, Salesforce Com Inc (Tableau Software Inc), Microsoft Corporation, Adobe Systems Incorporated, Pegasystems Inc, Neustar Inc, Oracle Corporation, and Google LLC (list not exhaustive), and considers various segments by deployment, application, and end-user. Download now to gain actionable insights and strategic advantages.
US Marketing Analytics Industry Market Structure & Innovation Trends
The US Marketing Analytics market is characterized by a moderately concentrated structure, with a few major players holding significant market share. However, the market also accommodates numerous smaller niche players. The market share of the top 5 players is estimated to be approximately xx%. Innovation is driven primarily by advancements in Artificial Intelligence (AI), Machine Learning (ML), and Big Data technologies, enabling more sophisticated analysis and predictive capabilities. Regulatory frameworks, such as data privacy regulations (e.g., CCPA, GDPR), significantly impact market dynamics. Product substitutes, including simpler, less sophisticated analytics tools, present competitive pressure, particularly in smaller market segments. End-user demographics are diverse, spanning across numerous sectors. The industry has witnessed considerable M&A activity in recent years, with deal values exceeding $xx Million annually, reflecting the strategic importance of marketing analytics capabilities.
- Market Concentration: Top 5 players hold approximately xx% market share (2025 Estimate).
- Innovation Drivers: AI, ML, Big Data, Cloud Computing.
- Regulatory Framework: CCPA, GDPR, and other data privacy regulations.
- M&A Activity: Annual deal values exceeding $xx Million (2019-2024 average).
US Marketing Analytics Industry Market Dynamics & Trends
The US Marketing Analytics market exhibits robust growth, driven by the increasing adoption of data-driven decision-making across various industries. The market is experiencing significant technological disruptions, with AI and ML playing a pivotal role in enhancing analytical capabilities and automating processes. Consumer preferences towards personalized experiences and targeted advertising further fuel market expansion. Intense competition among established players and emerging startups contributes to innovation and competitive pricing. The Compound Annual Growth Rate (CAGR) is projected to be xx% during the forecast period (2025-2033). Market penetration is expected to reach xx% by 2033, driven by increased adoption across various industry verticals.
Dominant Regions & Segments in US Marketing Analytics Industry
The dominant region within the US Marketing Analytics market is the West Coast, particularly California, owing to the high concentration of technology companies and venture capital investments. Significant growth is also observed in the Northeast and Southeast regions, aligning with robust economic activities.
By Deployment:
- Cloud: The cloud-based segment dominates due to scalability, cost-effectiveness, and ease of access.
- On-Premise: This segment maintains a presence in industries with stringent data security requirements.
By Application:
- Online Marketing: Highest market share due to the prevalence of digital advertising.
- Email Marketing: Significant market segment with continued growth potential.
- Content Marketing: Growing rapidly with the rise of content-centric marketing strategies.
- Social Media Marketing: Strong growth, driven by the expanding reach of social media platforms.
By End User:
- Retail: Strong adoption due to the need for customer segmentation and personalized offers.
- BFSI (Banking, Financial Services, and Insurance): High market share due to regulatory compliance and risk management needs.
- Other End Users: This segment showcases diverse growth prospects across various industries.
Key drivers for dominance in these segments include robust digital infrastructure, favorable economic policies, and a skilled workforce.
US Marketing Analytics Industry Product Innovations
Recent product innovations focus on incorporating AI/ML for predictive modeling, enhanced data visualization, and automated reporting. These advancements enable more efficient data analysis, leading to improved marketing campaign optimization and ROI. The market is witnessing a shift towards integrated platforms that consolidate various marketing analytics tools into a single ecosystem. This fosters streamlined workflows and improved data management for marketers.
Report Scope & Segmentation Analysis
This report comprehensively analyzes the US Marketing Analytics market, segmented by deployment (cloud and on-premise), application (online, email, content, social media, and other), and end-user (retail, BFSI, education, healthcare, manufacturing, travel and hospitality, and others). Each segment’s growth projection, market size (in Millions), and competitive dynamics are meticulously examined, providing a granular understanding of the market landscape. Growth projections vary across segments, with cloud-based solutions and online marketing applications exhibiting the highest growth potential.
Key Drivers of US Marketing Analytics Industry Growth
The growth of the US Marketing Analytics industry is primarily driven by the escalating demand for data-driven decision-making, the proliferation of big data, advancements in AI and ML technologies, and the rising adoption of cloud-based solutions. Government initiatives supporting digital transformation and increasing investments in marketing analytics by businesses across various sectors also contribute to market expansion.
Challenges in the US Marketing Analytics Industry Sector
The industry faces challenges such as data privacy regulations, the need for skilled data analysts, and the high cost of implementation for some solutions. Data security concerns and the integration of legacy systems with modern analytics platforms also pose significant hurdles. These factors can constrain market growth, potentially impacting adoption rates and ROI for businesses.
Emerging Opportunities in US Marketing Analytics Industry
Emerging opportunities lie in the integration of AI and ML with marketing automation platforms, the growing demand for predictive analytics, and the expansion into new market segments such as the Internet of Things (IoT) and the metaverse. The rising adoption of advanced analytics techniques, such as predictive modeling and real-time analytics, presents significant opportunities for growth and innovation.
Leading Players in the US Marketing Analytics Industry Market
- SAS Institute Inc
- Accenture PLC
- IBM Corporation
- Teradata Corporation
- Salesforce Com Inc (Tableau Software Inc)
- Microsoft Corporation
- Adobe Systems Incorporated
- Pegasystems Inc
- Neustar Inc
- Oracle Corporation
- Google LLC
Key Developments in US Marketing Analytics Industry
- June 2023: Moody’s Corporation and Microsoft partnered to deliver next-generation data, analytics, and risk solutions for financial services, leveraging Microsoft Azure OpenAI Service.
- July 2022: Neustar partnered with Adverity to enhance marketers' ability to connect data and boost marketing effectiveness.
- December 2022: Vi Labs acquired Motus Consumer Insights, combining AI-powered customer engagement with customer acquisition analytics.
Future Outlook for US Marketing Analytics Industry Market
The US Marketing Analytics market is poised for sustained growth, driven by continued technological advancements, increased adoption across industries, and the growing importance of data-driven decision-making. Strategic opportunities exist for companies that can leverage AI/ML to deliver innovative solutions and cater to the evolving needs of marketers. The market's future potential is substantial, promising significant expansion in the coming years.
US Marketing Analytics Industry Segmentation
-
1. Deployment
- 1.1. Cloud
- 1.2. On-premise
-
2. Application
- 2.1. Online Marketing
- 2.2. E-mail Marketing
- 2.3. Content Marketing
- 2.4. Social Media Marketing
- 2.5. Other Applications
-
3. End User
- 3.1. Retail
- 3.2. BFSI
- 3.3. Education
- 3.4. Healthcare
- 3.5. Manufacturing
- 3.6. Travel and Hospitality
- 3.7. Other End Users
US Marketing Analytics Industry Segmentation By Geography
-
1. North America
- 1.1. United States
- 1.2. Canada
- 1.3. Mexico
-
2. South America
- 2.1. Brazil
- 2.2. Argentina
- 2.3. Rest of South America
-
3. Europe
- 3.1. United Kingdom
- 3.2. Germany
- 3.3. France
- 3.4. Italy
- 3.5. Spain
- 3.6. Russia
- 3.7. Benelux
- 3.8. Nordics
- 3.9. Rest of Europe
-
4. Middle East & Africa
- 4.1. Turkey
- 4.2. Israel
- 4.3. GCC
- 4.4. North Africa
- 4.5. South Africa
- 4.6. Rest of Middle East & Africa
-
5. Asia Pacific
- 5.1. China
- 5.2. India
- 5.3. Japan
- 5.4. South Korea
- 5.5. ASEAN
- 5.6. Oceania
- 5.7. Rest of Asia Pacific
US Marketing Analytics Industry REPORT HIGHLIGHTS
| Aspects | Details |
|---|---|
| Study Period | 2019-2033 |
| Base Year | 2024 |
| Estimated Year | 2025 |
| Forecast Period | 2025-2033 |
| Historical Period | 2019-2024 |
| Growth Rate | CAGR of > 12.73% from 2019-2033 |
| Segmentation |
|
Table of Contents
- 1. Introduction
- 1.1. Research Scope
- 1.2. Market Segmentation
- 1.3. Research Methodology
- 1.4. Definitions and Assumptions
- 2. Executive Summary
- 2.1. Introduction
- 3. Market Dynamics
- 3.1. Introduction
- 3.2. Market Drivers
- 3.2.1. Increase in Social Media Channels; Increasing Need to Utilize Marketing Budgets for an Effective ROI; Adoption of Cloud Technology and Big Data
- 3.3. Market Restrains
- 3.3.1. High Cost of Implementation and System Integration Issues for Marketing Analytics Software; Availability of Many Free Open Source Software
- 3.4. Market Trends
- 3.4.1. Adoption of Cloud Technology and Big Data is Expected to Drive the Market Growth
- 4. Market Factor Analysis
- 4.1. Porters Five Forces
- 4.2. Supply/Value Chain
- 4.3. PESTEL analysis
- 4.4. Market Entropy
- 4.5. Patent/Trademark Analysis
- 5. Global US Marketing Analytics Industry Analysis, Insights and Forecast, 2019-2031
- 5.1. Market Analysis, Insights and Forecast - by Deployment
- 5.1.1. Cloud
- 5.1.2. On-premise
- 5.2. Market Analysis, Insights and Forecast - by Application
- 5.2.1. Online Marketing
- 5.2.2. E-mail Marketing
- 5.2.3. Content Marketing
- 5.2.4. Social Media Marketing
- 5.2.5. Other Applications
- 5.3. Market Analysis, Insights and Forecast - by End User
- 5.3.1. Retail
- 5.3.2. BFSI
- 5.3.3. Education
- 5.3.4. Healthcare
- 5.3.5. Manufacturing
- 5.3.6. Travel and Hospitality
- 5.3.7. Other End Users
- 5.4. Market Analysis, Insights and Forecast - by Region
- 5.4.1. North America
- 5.4.2. South America
- 5.4.3. Europe
- 5.4.4. Middle East & Africa
- 5.4.5. Asia Pacific
- 5.1. Market Analysis, Insights and Forecast - by Deployment
- 6. North America US Marketing Analytics Industry Analysis, Insights and Forecast, 2019-2031
- 6.1. Market Analysis, Insights and Forecast - by Deployment
- 6.1.1. Cloud
- 6.1.2. On-premise
- 6.2. Market Analysis, Insights and Forecast - by Application
- 6.2.1. Online Marketing
- 6.2.2. E-mail Marketing
- 6.2.3. Content Marketing
- 6.2.4. Social Media Marketing
- 6.2.5. Other Applications
- 6.3. Market Analysis, Insights and Forecast - by End User
- 6.3.1. Retail
- 6.3.2. BFSI
- 6.3.3. Education
- 6.3.4. Healthcare
- 6.3.5. Manufacturing
- 6.3.6. Travel and Hospitality
- 6.3.7. Other End Users
- 6.1. Market Analysis, Insights and Forecast - by Deployment
- 7. South America US Marketing Analytics Industry Analysis, Insights and Forecast, 2019-2031
- 7.1. Market Analysis, Insights and Forecast - by Deployment
- 7.1.1. Cloud
- 7.1.2. On-premise
- 7.2. Market Analysis, Insights and Forecast - by Application
- 7.2.1. Online Marketing
- 7.2.2. E-mail Marketing
- 7.2.3. Content Marketing
- 7.2.4. Social Media Marketing
- 7.2.5. Other Applications
- 7.3. Market Analysis, Insights and Forecast - by End User
- 7.3.1. Retail
- 7.3.2. BFSI
- 7.3.3. Education
- 7.3.4. Healthcare
- 7.3.5. Manufacturing
- 7.3.6. Travel and Hospitality
- 7.3.7. Other End Users
- 7.1. Market Analysis, Insights and Forecast - by Deployment
- 8. Europe US Marketing Analytics Industry Analysis, Insights and Forecast, 2019-2031
- 8.1. Market Analysis, Insights and Forecast - by Deployment
- 8.1.1. Cloud
- 8.1.2. On-premise
- 8.2. Market Analysis, Insights and Forecast - by Application
- 8.2.1. Online Marketing
- 8.2.2. E-mail Marketing
- 8.2.3. Content Marketing
- 8.2.4. Social Media Marketing
- 8.2.5. Other Applications
- 8.3. Market Analysis, Insights and Forecast - by End User
- 8.3.1. Retail
- 8.3.2. BFSI
- 8.3.3. Education
- 8.3.4. Healthcare
- 8.3.5. Manufacturing
- 8.3.6. Travel and Hospitality
- 8.3.7. Other End Users
- 8.1. Market Analysis, Insights and Forecast - by Deployment
- 9. Middle East & Africa US Marketing Analytics Industry Analysis, Insights and Forecast, 2019-2031
- 9.1. Market Analysis, Insights and Forecast - by Deployment
- 9.1.1. Cloud
- 9.1.2. On-premise
- 9.2. Market Analysis, Insights and Forecast - by Application
- 9.2.1. Online Marketing
- 9.2.2. E-mail Marketing
- 9.2.3. Content Marketing
- 9.2.4. Social Media Marketing
- 9.2.5. Other Applications
- 9.3. Market Analysis, Insights and Forecast - by End User
- 9.3.1. Retail
- 9.3.2. BFSI
- 9.3.3. Education
- 9.3.4. Healthcare
- 9.3.5. Manufacturing
- 9.3.6. Travel and Hospitality
- 9.3.7. Other End Users
- 9.1. Market Analysis, Insights and Forecast - by Deployment
- 10. Asia Pacific US Marketing Analytics Industry Analysis, Insights and Forecast, 2019-2031
- 10.1. Market Analysis, Insights and Forecast - by Deployment
- 10.1.1. Cloud
- 10.1.2. On-premise
- 10.2. Market Analysis, Insights and Forecast - by Application
- 10.2.1. Online Marketing
- 10.2.2. E-mail Marketing
- 10.2.3. Content Marketing
- 10.2.4. Social Media Marketing
- 10.2.5. Other Applications
- 10.3. Market Analysis, Insights and Forecast - by End User
- 10.3.1. Retail
- 10.3.2. BFSI
- 10.3.3. Education
- 10.3.4. Healthcare
- 10.3.5. Manufacturing
- 10.3.6. Travel and Hospitality
- 10.3.7. Other End Users
- 10.1. Market Analysis, Insights and Forecast - by Deployment
- 11. Northeast US Marketing Analytics Industry Analysis, Insights and Forecast, 2019-2031
- 12. Southeast US Marketing Analytics Industry Analysis, Insights and Forecast, 2019-2031
- 13. Midwest US Marketing Analytics Industry Analysis, Insights and Forecast, 2019-2031
- 14. Southwest US Marketing Analytics Industry Analysis, Insights and Forecast, 2019-2031
- 15. West US Marketing Analytics Industry Analysis, Insights and Forecast, 2019-2031
- 16. Competitive Analysis
- 16.1. Global Market Share Analysis 2024
- 16.2. Company Profiles
- 16.2.1 SAS Institute Inc
- 16.2.1.1. Overview
- 16.2.1.2. Products
- 16.2.1.3. SWOT Analysis
- 16.2.1.4. Recent Developments
- 16.2.1.5. Financials (Based on Availability)
- 16.2.2 Accenture PLC
- 16.2.2.1. Overview
- 16.2.2.2. Products
- 16.2.2.3. SWOT Analysis
- 16.2.2.4. Recent Developments
- 16.2.2.5. Financials (Based on Availability)
- 16.2.3 IBM Corporation
- 16.2.3.1. Overview
- 16.2.3.2. Products
- 16.2.3.3. SWOT Analysis
- 16.2.3.4. Recent Developments
- 16.2.3.5. Financials (Based on Availability)
- 16.2.4 Teradata Corporation
- 16.2.4.1. Overview
- 16.2.4.2. Products
- 16.2.4.3. SWOT Analysis
- 16.2.4.4. Recent Developments
- 16.2.4.5. Financials (Based on Availability)
- 16.2.5 Salesforce Com Inc (Tableau Software Inc )
- 16.2.5.1. Overview
- 16.2.5.2. Products
- 16.2.5.3. SWOT Analysis
- 16.2.5.4. Recent Developments
- 16.2.5.5. Financials (Based on Availability)
- 16.2.6 Microsoft Corporation
- 16.2.6.1. Overview
- 16.2.6.2. Products
- 16.2.6.3. SWOT Analysis
- 16.2.6.4. Recent Developments
- 16.2.6.5. Financials (Based on Availability)
- 16.2.7 Adobe Systems Incorporated
- 16.2.7.1. Overview
- 16.2.7.2. Products
- 16.2.7.3. SWOT Analysis
- 16.2.7.4. Recent Developments
- 16.2.7.5. Financials (Based on Availability)
- 16.2.8 Pegasystems Inc
- 16.2.8.1. Overview
- 16.2.8.2. Products
- 16.2.8.3. SWOT Analysis
- 16.2.8.4. Recent Developments
- 16.2.8.5. Financials (Based on Availability)
- 16.2.9 Neustar Inc
- 16.2.9.1. Overview
- 16.2.9.2. Products
- 16.2.9.3. SWOT Analysis
- 16.2.9.4. Recent Developments
- 16.2.9.5. Financials (Based on Availability)
- 16.2.10 Oracle Corporation
- 16.2.10.1. Overview
- 16.2.10.2. Products
- 16.2.10.3. SWOT Analysis
- 16.2.10.4. Recent Developments
- 16.2.10.5. Financials (Based on Availability)
- 16.2.11 Google LLC*List Not Exhaustive
- 16.2.11.1. Overview
- 16.2.11.2. Products
- 16.2.11.3. SWOT Analysis
- 16.2.11.4. Recent Developments
- 16.2.11.5. Financials (Based on Availability)
- 16.2.1 SAS Institute Inc
List of Figures
- Figure 1: Global US Marketing Analytics Industry Revenue Breakdown (Million, %) by Region 2024 & 2032
- Figure 2: United states US Marketing Analytics Industry Revenue (Million), by Country 2024 & 2032
- Figure 3: United states US Marketing Analytics Industry Revenue Share (%), by Country 2024 & 2032
- Figure 4: North America US Marketing Analytics Industry Revenue (Million), by Deployment 2024 & 2032
- Figure 5: North America US Marketing Analytics Industry Revenue Share (%), by Deployment 2024 & 2032
- Figure 6: North America US Marketing Analytics Industry Revenue (Million), by Application 2024 & 2032
- Figure 7: North America US Marketing Analytics Industry Revenue Share (%), by Application 2024 & 2032
- Figure 8: North America US Marketing Analytics Industry Revenue (Million), by End User 2024 & 2032
- Figure 9: North America US Marketing Analytics Industry Revenue Share (%), by End User 2024 & 2032
- Figure 10: North America US Marketing Analytics Industry Revenue (Million), by Country 2024 & 2032
- Figure 11: North America US Marketing Analytics Industry Revenue Share (%), by Country 2024 & 2032
- Figure 12: South America US Marketing Analytics Industry Revenue (Million), by Deployment 2024 & 2032
- Figure 13: South America US Marketing Analytics Industry Revenue Share (%), by Deployment 2024 & 2032
- Figure 14: South America US Marketing Analytics Industry Revenue (Million), by Application 2024 & 2032
- Figure 15: South America US Marketing Analytics Industry Revenue Share (%), by Application 2024 & 2032
- Figure 16: South America US Marketing Analytics Industry Revenue (Million), by End User 2024 & 2032
- Figure 17: South America US Marketing Analytics Industry Revenue Share (%), by End User 2024 & 2032
- Figure 18: South America US Marketing Analytics Industry Revenue (Million), by Country 2024 & 2032
- Figure 19: South America US Marketing Analytics Industry Revenue Share (%), by Country 2024 & 2032
- Figure 20: Europe US Marketing Analytics Industry Revenue (Million), by Deployment 2024 & 2032
- Figure 21: Europe US Marketing Analytics Industry Revenue Share (%), by Deployment 2024 & 2032
- Figure 22: Europe US Marketing Analytics Industry Revenue (Million), by Application 2024 & 2032
- Figure 23: Europe US Marketing Analytics Industry Revenue Share (%), by Application 2024 & 2032
- Figure 24: Europe US Marketing Analytics Industry Revenue (Million), by End User 2024 & 2032
- Figure 25: Europe US Marketing Analytics Industry Revenue Share (%), by End User 2024 & 2032
- Figure 26: Europe US Marketing Analytics Industry Revenue (Million), by Country 2024 & 2032
- Figure 27: Europe US Marketing Analytics Industry Revenue Share (%), by Country 2024 & 2032
- Figure 28: Middle East & Africa US Marketing Analytics Industry Revenue (Million), by Deployment 2024 & 2032
- Figure 29: Middle East & Africa US Marketing Analytics Industry Revenue Share (%), by Deployment 2024 & 2032
- Figure 30: Middle East & Africa US Marketing Analytics Industry Revenue (Million), by Application 2024 & 2032
- Figure 31: Middle East & Africa US Marketing Analytics Industry Revenue Share (%), by Application 2024 & 2032
- Figure 32: Middle East & Africa US Marketing Analytics Industry Revenue (Million), by End User 2024 & 2032
- Figure 33: Middle East & Africa US Marketing Analytics Industry Revenue Share (%), by End User 2024 & 2032
- Figure 34: Middle East & Africa US Marketing Analytics Industry Revenue (Million), by Country 2024 & 2032
- Figure 35: Middle East & Africa US Marketing Analytics Industry Revenue Share (%), by Country 2024 & 2032
- Figure 36: Asia Pacific US Marketing Analytics Industry Revenue (Million), by Deployment 2024 & 2032
- Figure 37: Asia Pacific US Marketing Analytics Industry Revenue Share (%), by Deployment 2024 & 2032
- Figure 38: Asia Pacific US Marketing Analytics Industry Revenue (Million), by Application 2024 & 2032
- Figure 39: Asia Pacific US Marketing Analytics Industry Revenue Share (%), by Application 2024 & 2032
- Figure 40: Asia Pacific US Marketing Analytics Industry Revenue (Million), by End User 2024 & 2032
- Figure 41: Asia Pacific US Marketing Analytics Industry Revenue Share (%), by End User 2024 & 2032
- Figure 42: Asia Pacific US Marketing Analytics Industry Revenue (Million), by Country 2024 & 2032
- Figure 43: Asia Pacific US Marketing Analytics Industry Revenue Share (%), by Country 2024 & 2032
List of Tables
- Table 1: Global US Marketing Analytics Industry Revenue Million Forecast, by Region 2019 & 2032
- Table 2: Global US Marketing Analytics Industry Revenue Million Forecast, by Deployment 2019 & 2032
- Table 3: Global US Marketing Analytics Industry Revenue Million Forecast, by Application 2019 & 2032
- Table 4: Global US Marketing Analytics Industry Revenue Million Forecast, by End User 2019 & 2032
- Table 5: Global US Marketing Analytics Industry Revenue Million Forecast, by Region 2019 & 2032
- Table 6: Global US Marketing Analytics Industry Revenue Million Forecast, by Country 2019 & 2032
- Table 7: Northeast US Marketing Analytics Industry Revenue (Million) Forecast, by Application 2019 & 2032
- Table 8: Southeast US Marketing Analytics Industry Revenue (Million) Forecast, by Application 2019 & 2032
- Table 9: Midwest US Marketing Analytics Industry Revenue (Million) Forecast, by Application 2019 & 2032
- Table 10: Southwest US Marketing Analytics Industry Revenue (Million) Forecast, by Application 2019 & 2032
- Table 11: West US Marketing Analytics Industry Revenue (Million) Forecast, by Application 2019 & 2032
- Table 12: Global US Marketing Analytics Industry Revenue Million Forecast, by Deployment 2019 & 2032
- Table 13: Global US Marketing Analytics Industry Revenue Million Forecast, by Application 2019 & 2032
- Table 14: Global US Marketing Analytics Industry Revenue Million Forecast, by End User 2019 & 2032
- Table 15: Global US Marketing Analytics Industry Revenue Million Forecast, by Country 2019 & 2032
- Table 16: United States US Marketing Analytics Industry Revenue (Million) Forecast, by Application 2019 & 2032
- Table 17: Canada US Marketing Analytics Industry Revenue (Million) Forecast, by Application 2019 & 2032
- Table 18: Mexico US Marketing Analytics Industry Revenue (Million) Forecast, by Application 2019 & 2032
- Table 19: Global US Marketing Analytics Industry Revenue Million Forecast, by Deployment 2019 & 2032
- Table 20: Global US Marketing Analytics Industry Revenue Million Forecast, by Application 2019 & 2032
- Table 21: Global US Marketing Analytics Industry Revenue Million Forecast, by End User 2019 & 2032
- Table 22: Global US Marketing Analytics Industry Revenue Million Forecast, by Country 2019 & 2032
- Table 23: Brazil US Marketing Analytics Industry Revenue (Million) Forecast, by Application 2019 & 2032
- Table 24: Argentina US Marketing Analytics Industry Revenue (Million) Forecast, by Application 2019 & 2032
- Table 25: Rest of South America US Marketing Analytics Industry Revenue (Million) Forecast, by Application 2019 & 2032
- Table 26: Global US Marketing Analytics Industry Revenue Million Forecast, by Deployment 2019 & 2032
- Table 27: Global US Marketing Analytics Industry Revenue Million Forecast, by Application 2019 & 2032
- Table 28: Global US Marketing Analytics Industry Revenue Million Forecast, by End User 2019 & 2032
- Table 29: Global US Marketing Analytics Industry Revenue Million Forecast, by Country 2019 & 2032
- Table 30: United Kingdom US Marketing Analytics Industry Revenue (Million) Forecast, by Application 2019 & 2032
- Table 31: Germany US Marketing Analytics Industry Revenue (Million) Forecast, by Application 2019 & 2032
- Table 32: France US Marketing Analytics Industry Revenue (Million) Forecast, by Application 2019 & 2032
- Table 33: Italy US Marketing Analytics Industry Revenue (Million) Forecast, by Application 2019 & 2032
- Table 34: Spain US Marketing Analytics Industry Revenue (Million) Forecast, by Application 2019 & 2032
- Table 35: Russia US Marketing Analytics Industry Revenue (Million) Forecast, by Application 2019 & 2032
- Table 36: Benelux US Marketing Analytics Industry Revenue (Million) Forecast, by Application 2019 & 2032
- Table 37: Nordics US Marketing Analytics Industry Revenue (Million) Forecast, by Application 2019 & 2032
- Table 38: Rest of Europe US Marketing Analytics Industry Revenue (Million) Forecast, by Application 2019 & 2032
- Table 39: Global US Marketing Analytics Industry Revenue Million Forecast, by Deployment 2019 & 2032
- Table 40: Global US Marketing Analytics Industry Revenue Million Forecast, by Application 2019 & 2032
- Table 41: Global US Marketing Analytics Industry Revenue Million Forecast, by End User 2019 & 2032
- Table 42: Global US Marketing Analytics Industry Revenue Million Forecast, by Country 2019 & 2032
- Table 43: Turkey US Marketing Analytics Industry Revenue (Million) Forecast, by Application 2019 & 2032
- Table 44: Israel US Marketing Analytics Industry Revenue (Million) Forecast, by Application 2019 & 2032
- Table 45: GCC US Marketing Analytics Industry Revenue (Million) Forecast, by Application 2019 & 2032
- Table 46: North Africa US Marketing Analytics Industry Revenue (Million) Forecast, by Application 2019 & 2032
- Table 47: South Africa US Marketing Analytics Industry Revenue (Million) Forecast, by Application 2019 & 2032
- Table 48: Rest of Middle East & Africa US Marketing Analytics Industry Revenue (Million) Forecast, by Application 2019 & 2032
- Table 49: Global US Marketing Analytics Industry Revenue Million Forecast, by Deployment 2019 & 2032
- Table 50: Global US Marketing Analytics Industry Revenue Million Forecast, by Application 2019 & 2032
- Table 51: Global US Marketing Analytics Industry Revenue Million Forecast, by End User 2019 & 2032
- Table 52: Global US Marketing Analytics Industry Revenue Million Forecast, by Country 2019 & 2032
- Table 53: China US Marketing Analytics Industry Revenue (Million) Forecast, by Application 2019 & 2032
- Table 54: India US Marketing Analytics Industry Revenue (Million) Forecast, by Application 2019 & 2032
- Table 55: Japan US Marketing Analytics Industry Revenue (Million) Forecast, by Application 2019 & 2032
- Table 56: South Korea US Marketing Analytics Industry Revenue (Million) Forecast, by Application 2019 & 2032
- Table 57: ASEAN US Marketing Analytics Industry Revenue (Million) Forecast, by Application 2019 & 2032
- Table 58: Oceania US Marketing Analytics Industry Revenue (Million) Forecast, by Application 2019 & 2032
- Table 59: Rest of Asia Pacific US Marketing Analytics Industry Revenue (Million) Forecast, by Application 2019 & 2032
Frequently Asked Questions
1. What is the projected Compound Annual Growth Rate (CAGR) of the US Marketing Analytics Industry?
The projected CAGR is approximately > 12.73%.
2. Which companies are prominent players in the US Marketing Analytics Industry?
Key companies in the market include SAS Institute Inc, Accenture PLC, IBM Corporation, Teradata Corporation, Salesforce Com Inc (Tableau Software Inc ), Microsoft Corporation, Adobe Systems Incorporated, Pegasystems Inc, Neustar Inc, Oracle Corporation, Google LLC*List Not Exhaustive.
3. What are the main segments of the US Marketing Analytics Industry?
The market segments include Deployment, Application, End User.
4. Can you provide details about the market size?
The market size is estimated to be USD 4.66 Million as of 2022.
5. What are some drivers contributing to market growth?
Increase in Social Media Channels; Increasing Need to Utilize Marketing Budgets for an Effective ROI; Adoption of Cloud Technology and Big Data.
6. What are the notable trends driving market growth?
Adoption of Cloud Technology and Big Data is Expected to Drive the Market Growth.
7. Are there any restraints impacting market growth?
High Cost of Implementation and System Integration Issues for Marketing Analytics Software; Availability of Many Free Open Source Software.
8. Can you provide examples of recent developments in the market?
June 2023 - Moody’s Corporation and Microsoft have announced a new partnership to deliver next-generation data, analytics, research, collaboration, and risk solutions for financial services and global knowledge workers. Built on a combination of Moody’s robust data and analytical capabilities and the power and scale of Microsoft Azure OpenAI Service, the partnership creates innovative offerings that enhance insights into corporate intelligence and risk assessment, powered by Microsoft AI and anchored by Moody’s proprietary data, analytics, and research.
9. What pricing options are available for accessing the report?
Pricing options include single-user, multi-user, and enterprise licenses priced at USD 3800, USD 4500, and USD 5800 respectively.
10. Is the market size provided in terms of value or volume?
The market size is provided in terms of value, measured in Million.
11. Are there any specific market keywords associated with the report?
Yes, the market keyword associated with the report is "US Marketing Analytics Industry," which aids in identifying and referencing the specific market segment covered.
12. How do I determine which pricing option suits my needs best?
The pricing options vary based on user requirements and access needs. Individual users may opt for single-user licenses, while businesses requiring broader access may choose multi-user or enterprise licenses for cost-effective access to the report.
13. Are there any additional resources or data provided in the US Marketing Analytics Industry report?
While the report offers comprehensive insights, it's advisable to review the specific contents or supplementary materials provided to ascertain if additional resources or data are available.
14. How can I stay updated on further developments or reports in the US Marketing Analytics Industry?
To stay informed about further developments, trends, and reports in the US Marketing Analytics Industry, consider subscribing to industry newsletters, following relevant companies and organizations, or regularly checking reputable industry news sources and publications.
Methodology
Step 1 - Identification of Relevant Samples Size from Population Database


Step 2 - Approaches for Defining Global Market Size (Value, Volume* & Price*)

Note*: In applicable scenarios
Step 3 - Data Sources
Primary Research
- Web Analytics
- Survey Reports
- Research Institute
- Latest Research Reports
- Opinion Leaders
Secondary Research
- Annual Reports
- White Paper
- Latest Press Release
- Industry Association
- Paid Database
- Investor Presentations

Step 4 - Data Triangulation
Involves using different sources of information in order to increase the validity of a study
These sources are likely to be stakeholders in a program - participants, other researchers, program staff, other community members, and so on.
Then we put all data in single framework & apply various statistical tools to find out the dynamic on the market.
During the analysis stage, feedback from the stakeholder groups would be compared to determine areas of agreement as well as areas of divergence


