
Key Insights
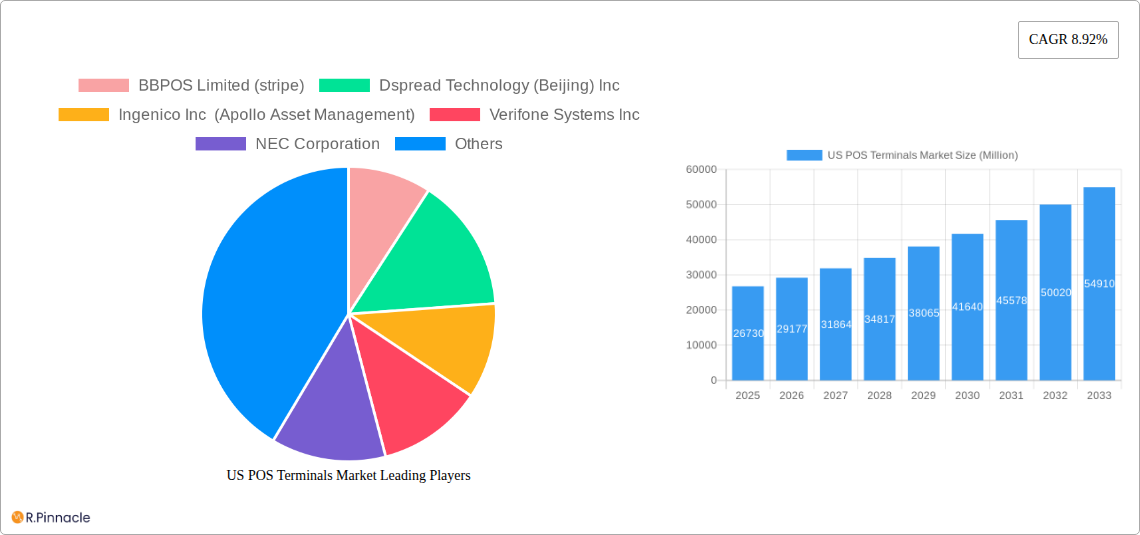
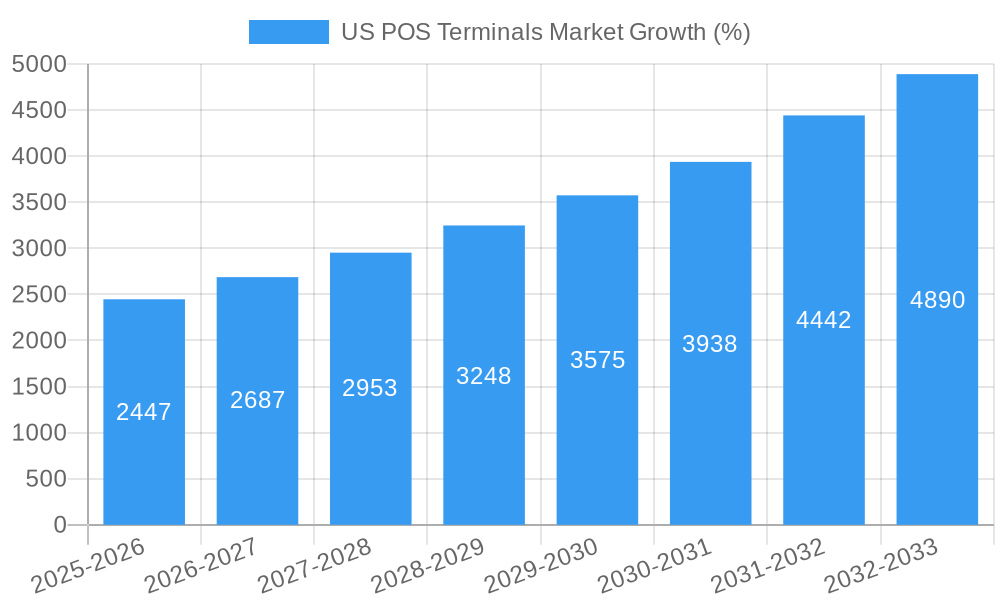
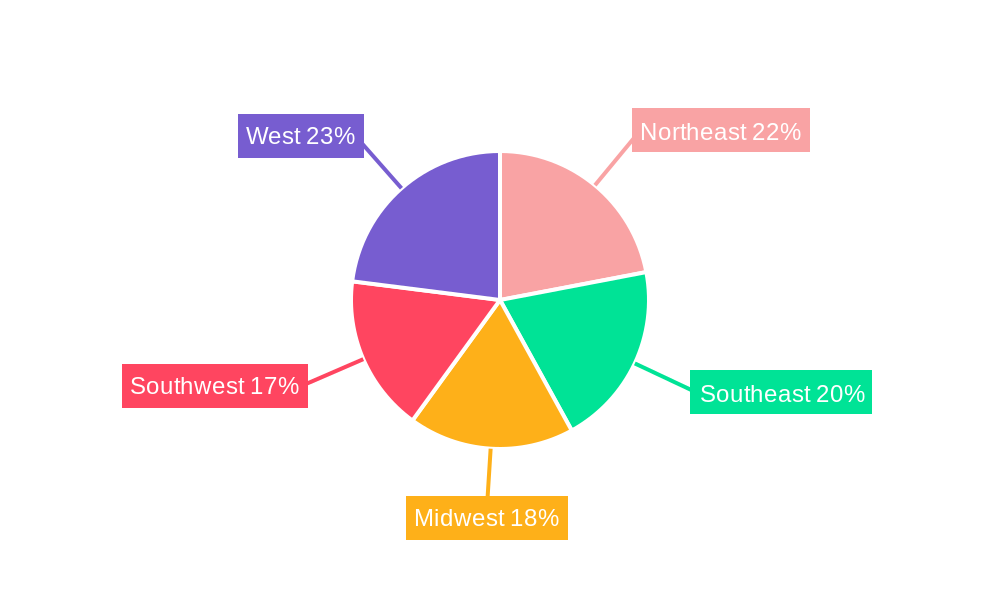
The US POS terminals market, valued at $26.73 billion in 2025, is experiencing robust growth, projected to expand at a compound annual growth rate (CAGR) of 8.92% from 2025 to 2033. This expansion is fueled by several key drivers. The increasing adoption of digital payment methods across retail, hospitality, and healthcare sectors is a primary catalyst. Consumers' preference for contactless and mobile payments is driving demand for mobile POS systems, contributing significantly to market growth. Furthermore, the integration of advanced technologies like cloud computing, AI, and data analytics within POS systems is enhancing operational efficiency and providing valuable business insights, encouraging further adoption. The market is segmented by end-user industry (retail, hospitality, healthcare, and others), component (hardware, software, and services), and type (fixed and mobile/portable systems). Retail and hospitality remain the dominant end-user segments, while software and services are experiencing the fastest growth due to increasing demand for advanced functionalities and support services. While the market faces certain restraints such as high initial investment costs and the need for continuous technological upgrades, the overall growth trajectory remains positive, driven by the ongoing digital transformation across various industries. The regional breakdown within the US shows significant market penetration across all regions – Northeast, Southeast, Midwest, Southwest, and West – reflecting widespread adoption across the country. Competition is intense, with key players such as BBPOS, Ingenico, Verifone, PAX Technology, and Square vying for market share through product innovation and strategic partnerships.
The future of the US POS terminals market appears bright. Continued advancements in technology, such as the integration of biometric authentication and improved cybersecurity measures, will further enhance the appeal of these systems. The rise of omnichannel retailing and the increasing focus on customer experience are also expected to fuel demand. The market is expected to witness a surge in the adoption of mobile POS solutions, driven by their portability and ease of use. Further growth is anticipated from the integration of advanced analytics capabilities into POS systems, providing businesses with real-time insights into customer behavior and sales performance. This data-driven approach will empower businesses to make informed decisions and optimize their operations, contributing to the sustained growth of the US POS terminals market.
US POS Terminals Market Report: 2019-2033
This comprehensive report provides an in-depth analysis of the US POS terminals market, offering invaluable insights for industry professionals, investors, and strategists. Covering the period from 2019 to 2033, with a focus on 2025, this report leverages rigorous market research to deliver actionable intelligence on market size, growth drivers, competitive landscape, and future trends. The market is projected to reach xx Million by 2033.
US POS Terminals Market Structure & Innovation Trends
The US POS terminals market exhibits a moderately concentrated structure, with key players like Verifone Systems Inc, Ingenico Inc, and Square Capital LLC (Block Inc) holding significant market share. However, the market also features several smaller, specialized players, creating a dynamic competitive landscape. Market share fluctuations are influenced by factors such as product innovation, strategic partnerships, and mergers and acquisitions (M&A). Recent M&A activity, while not publicly disclosed in full detail, has involved deals valued at xx Million, primarily focused on expanding product portfolios and geographical reach. Innovation is driven by the need for enhanced security features, seamless integration with other business systems (e.g., inventory management, customer relationship management), and the rising adoption of mobile POS solutions. Regulatory frameworks, including PCI DSS compliance, significantly impact market dynamics, pushing vendors to invest in robust security measures. The market also faces competition from alternative payment methods, such as contactless payments and mobile wallets, although these often integrate with POS systems. End-user demographics, with a focus on small and medium-sized businesses (SMBs) and large enterprises, dictate varying demand for specific POS features and functionalities.
US POS Terminals Market Market Dynamics & Trends
The US POS terminals market is experiencing robust growth, driven by several key factors. The increasing adoption of digital payment methods, particularly among SMBs, is a major contributor. The shift towards omnichannel retail strategies also fuels demand for flexible and integrated POS systems. Technological advancements, such as the integration of cloud computing, artificial intelligence (AI), and big data analytics, are enhancing POS system functionality and providing valuable business intelligence. Consumer preference for speed, convenience, and secure transactions drives the demand for advanced POS features. The market is witnessing a shift towards mobile and cloud-based POS solutions, offering greater flexibility and reducing the reliance on traditional fixed terminals. The market is estimated to have a CAGR of xx% during the forecast period (2025-2033). Market penetration rates vary by segment, with higher penetration in retail and hospitality sectors compared to healthcare. Competitive dynamics are shaped by product differentiation, pricing strategies, and the ability to provide comprehensive support and services.
Dominant Regions & Segments in US POS Terminals Market
The retail sector dominates the US POS terminals market, followed by the hospitality and healthcare industries. This dominance is attributed to the widespread presence of retail establishments and the growing need for efficient payment processing in high-volume transaction environments.
- Key Drivers in Retail: High transaction volumes, focus on customer experience, and need for inventory management integration.
- Key Drivers in Hospitality: Emphasis on fast and efficient service, table management systems integration, and mobile payment acceptance.
- Key Drivers in Healthcare: Secure transaction processing, HIPAA compliance, and integration with billing systems.
The hardware segment holds the largest market share, primarily due to the need for physical devices for transaction processing. However, the software and services segments are experiencing significant growth due to increased demand for value-added services like data analytics and remote support. Fixed POS systems still hold the largest share of the type segment, but mobile/portable POS systems are gaining traction due to their flexibility and portability. Geographically, the market is largely concentrated in urban and suburban areas with well-developed retail and hospitality infrastructure.
US POS Terminals Market Product Innovations
Recent product developments emphasize enhanced security features, such as EMV compliance and tokenization, as well as improved user interfaces and integration capabilities. The integration of cloud-based services enables real-time data access and advanced analytics. Mobile POS solutions are gaining popularity due to their versatility and ability to process transactions anywhere. These innovations aim to improve operational efficiency, enhance customer experience, and provide valuable business intelligence. The market fit is strong due to growing demand for advanced POS functionalities across various industries.
Report Scope & Segmentation Analysis
The report segments the US POS terminals market by end-user industry (Retail, Hospitality, Healthcare, Other), component (Hardware, Software, Services), and type (Fixed Point-of-sale Systems, Mobile/Portable Point-of-sale Systems). Each segment is analyzed in terms of market size, growth projections, and competitive dynamics. The retail segment is expected to witness the highest growth rate due to the expanding e-commerce sector and omnichannel initiatives. The hardware segment is anticipated to maintain its dominance, but the software and services segments are projected to experience significant growth. The mobile/portable POS system segment is expected to grow rapidly due to increasing demand for mobility and flexibility.
Key Drivers of US POS Terminals Market Growth
Several factors contribute to the growth of the US POS terminals market. The increasing adoption of digital payments, the growing preference for contactless transactions, and the rise of omnichannel retailing are key drivers. Technological advancements, such as the integration of cloud technology and AI, are also boosting market growth. Government initiatives promoting digital payments and favorable economic conditions contribute to market expansion. The need for enhanced security and data analytics capabilities further drives market growth.
Challenges in the US POS Terminals Market Sector
The US POS terminals market faces several challenges. The high initial investment costs associated with implementing new POS systems can deter smaller businesses. Maintaining PCI DSS compliance and protecting sensitive customer data poses significant challenges. Intense competition among vendors necessitates constant innovation and value-added service offerings to remain competitive. Supply chain disruptions can impact the availability of hardware components. These factors can affect overall market growth and profitability.
Emerging Opportunities in US POS Terminals Market
Emerging opportunities exist in the integration of advanced technologies like AI and machine learning to enhance functionalities such as fraud detection, customer analytics, and inventory management. The expansion of POS solutions into new markets, such as micro-businesses and pop-up shops, presents significant growth potential. The rising demand for contactless and mobile payment solutions presents opportunities for vendors to develop innovative and user-friendly systems.
Leading Players in the US POS Terminals Market Market
- BBPOS Limited (stripe)
- Dspread Technology (Beijing) Inc
- Ingenico Inc (Apollo Asset Management)
- Verifone Systems Inc
- NEC Corporation
- SZZT Electronics Co Ltd
- Usa Technologies (Cantaloupe Inc)
- Square Capital LLC (Block Inc)
- PAX Technology Ltd
- Castles Technology
Key Developments in US POS Terminals Market Industry
- June 2023: US Bank and Elavon launched the Talech Terminal, a new POS solution designed for small businesses, emphasizing ease of use and affordability.
- January 2024: PAR Technology launched PAR Wave POS Terminal, targeting the restaurant industry with a focus on functionality, performance, security, and innovative design.
Future Outlook for US POS Terminals Market Market
The US POS terminals market is poised for continued growth, driven by technological advancements, evolving consumer preferences, and the increasing adoption of digital payments. Strategic partnerships, product innovation, and expansion into new market segments will be key to success. The market is expected to witness significant transformation with the adoption of cutting-edge technologies, creating new opportunities for growth and market consolidation.
US POS Terminals Market Segmentation
-
1. Component
- 1.1. Hardware
- 1.2. Software
- 1.3. Services
-
2. Type
- 2.1. Fixed Point-of-sale Systems
- 2.2. Mobile/Portable Point-of-sale Systems
-
3. End-user Industry
- 3.1. Retail
- 3.2. Hospitality
- 3.3. Healthcare
- 3.4. Other End-user Industries
US POS Terminals Market Segmentation By Geography
-
1. North America
- 1.1. United States
- 1.2. Canada
- 1.3. Mexico
-
2. South America
- 2.1. Brazil
- 2.2. Argentina
- 2.3. Rest of South America
-
3. Europe
- 3.1. United Kingdom
- 3.2. Germany
- 3.3. France
- 3.4. Italy
- 3.5. Spain
- 3.6. Russia
- 3.7. Benelux
- 3.8. Nordics
- 3.9. Rest of Europe
-
4. Middle East & Africa
- 4.1. Turkey
- 4.2. Israel
- 4.3. GCC
- 4.4. North Africa
- 4.5. South Africa
- 4.6. Rest of Middle East & Africa
-
5. Asia Pacific
- 5.1. China
- 5.2. India
- 5.3. Japan
- 5.4. South Korea
- 5.5. ASEAN
- 5.6. Oceania
- 5.7. Rest of Asia Pacific
US POS Terminals Market REPORT HIGHLIGHTS
| Aspects | Details |
|---|---|
| Study Period | 2019-2033 |
| Base Year | 2024 |
| Estimated Year | 2025 |
| Forecast Period | 2025-2033 |
| Historical Period | 2019-2024 |
| Growth Rate | CAGR of 8.92% from 2019-2033 |
| Segmentation |
|
Table of Contents
- 1. Introduction
- 1.1. Research Scope
- 1.2. Market Segmentation
- 1.3. Research Methodology
- 1.4. Definitions and Assumptions
- 2. Executive Summary
- 2.1. Introduction
- 3. Market Dynamics
- 3.1. Introduction
- 3.2. Market Drivers
- 3.2.1. Growing Investments in POS and Digitalization in the Payment Industry; Growing Demand for Contactless Payments; Increasing Demand for More Secured Payment Options
- 3.3. Market Restrains
- 3.3.1. Security Concerns Related to Cyber Attacks and Data Breaches; Lack of Robust and Reliable Infrastructure in Remote Regions
- 3.4. Market Trends
- 3.4.1. The Retail Segment is Expected to Grow Significantly
- 4. Market Factor Analysis
- 4.1. Porters Five Forces
- 4.2. Supply/Value Chain
- 4.3. PESTEL analysis
- 4.4. Market Entropy
- 4.5. Patent/Trademark Analysis
- 5. Global US POS Terminals Market Analysis, Insights and Forecast, 2019-2031
- 5.1. Market Analysis, Insights and Forecast - by Component
- 5.1.1. Hardware
- 5.1.2. Software
- 5.1.3. Services
- 5.2. Market Analysis, Insights and Forecast - by Type
- 5.2.1. Fixed Point-of-sale Systems
- 5.2.2. Mobile/Portable Point-of-sale Systems
- 5.3. Market Analysis, Insights and Forecast - by End-user Industry
- 5.3.1. Retail
- 5.3.2. Hospitality
- 5.3.3. Healthcare
- 5.3.4. Other End-user Industries
- 5.4. Market Analysis, Insights and Forecast - by Region
- 5.4.1. North America
- 5.4.2. South America
- 5.4.3. Europe
- 5.4.4. Middle East & Africa
- 5.4.5. Asia Pacific
- 5.1. Market Analysis, Insights and Forecast - by Component
- 6. North America US POS Terminals Market Analysis, Insights and Forecast, 2019-2031
- 6.1. Market Analysis, Insights and Forecast - by Component
- 6.1.1. Hardware
- 6.1.2. Software
- 6.1.3. Services
- 6.2. Market Analysis, Insights and Forecast - by Type
- 6.2.1. Fixed Point-of-sale Systems
- 6.2.2. Mobile/Portable Point-of-sale Systems
- 6.3. Market Analysis, Insights and Forecast - by End-user Industry
- 6.3.1. Retail
- 6.3.2. Hospitality
- 6.3.3. Healthcare
- 6.3.4. Other End-user Industries
- 6.1. Market Analysis, Insights and Forecast - by Component
- 7. South America US POS Terminals Market Analysis, Insights and Forecast, 2019-2031
- 7.1. Market Analysis, Insights and Forecast - by Component
- 7.1.1. Hardware
- 7.1.2. Software
- 7.1.3. Services
- 7.2. Market Analysis, Insights and Forecast - by Type
- 7.2.1. Fixed Point-of-sale Systems
- 7.2.2. Mobile/Portable Point-of-sale Systems
- 7.3. Market Analysis, Insights and Forecast - by End-user Industry
- 7.3.1. Retail
- 7.3.2. Hospitality
- 7.3.3. Healthcare
- 7.3.4. Other End-user Industries
- 7.1. Market Analysis, Insights and Forecast - by Component
- 8. Europe US POS Terminals Market Analysis, Insights and Forecast, 2019-2031
- 8.1. Market Analysis, Insights and Forecast - by Component
- 8.1.1. Hardware
- 8.1.2. Software
- 8.1.3. Services
- 8.2. Market Analysis, Insights and Forecast - by Type
- 8.2.1. Fixed Point-of-sale Systems
- 8.2.2. Mobile/Portable Point-of-sale Systems
- 8.3. Market Analysis, Insights and Forecast - by End-user Industry
- 8.3.1. Retail
- 8.3.2. Hospitality
- 8.3.3. Healthcare
- 8.3.4. Other End-user Industries
- 8.1. Market Analysis, Insights and Forecast - by Component
- 9. Middle East & Africa US POS Terminals Market Analysis, Insights and Forecast, 2019-2031
- 9.1. Market Analysis, Insights and Forecast - by Component
- 9.1.1. Hardware
- 9.1.2. Software
- 9.1.3. Services
- 9.2. Market Analysis, Insights and Forecast - by Type
- 9.2.1. Fixed Point-of-sale Systems
- 9.2.2. Mobile/Portable Point-of-sale Systems
- 9.3. Market Analysis, Insights and Forecast - by End-user Industry
- 9.3.1. Retail
- 9.3.2. Hospitality
- 9.3.3. Healthcare
- 9.3.4. Other End-user Industries
- 9.1. Market Analysis, Insights and Forecast - by Component
- 10. Asia Pacific US POS Terminals Market Analysis, Insights and Forecast, 2019-2031
- 10.1. Market Analysis, Insights and Forecast - by Component
- 10.1.1. Hardware
- 10.1.2. Software
- 10.1.3. Services
- 10.2. Market Analysis, Insights and Forecast - by Type
- 10.2.1. Fixed Point-of-sale Systems
- 10.2.2. Mobile/Portable Point-of-sale Systems
- 10.3. Market Analysis, Insights and Forecast - by End-user Industry
- 10.3.1. Retail
- 10.3.2. Hospitality
- 10.3.3. Healthcare
- 10.3.4. Other End-user Industries
- 10.1. Market Analysis, Insights and Forecast - by Component
- 11. Northeast US POS Terminals Market Analysis, Insights and Forecast, 2019-2031
- 12. Southeast US POS Terminals Market Analysis, Insights and Forecast, 2019-2031
- 13. Midwest US POS Terminals Market Analysis, Insights and Forecast, 2019-2031
- 14. Southwest US POS Terminals Market Analysis, Insights and Forecast, 2019-2031
- 15. West US POS Terminals Market Analysis, Insights and Forecast, 2019-2031
- 16. Competitive Analysis
- 16.1. Global Market Share Analysis 2024
- 16.2. Company Profiles
- 16.2.1 BBPOS Limited (stripe)
- 16.2.1.1. Overview
- 16.2.1.2. Products
- 16.2.1.3. SWOT Analysis
- 16.2.1.4. Recent Developments
- 16.2.1.5. Financials (Based on Availability)
- 16.2.2 Dspread Technology (Beijing) Inc
- 16.2.2.1. Overview
- 16.2.2.2. Products
- 16.2.2.3. SWOT Analysis
- 16.2.2.4. Recent Developments
- 16.2.2.5. Financials (Based on Availability)
- 16.2.3 Ingenico Inc (Apollo Asset Management)
- 16.2.3.1. Overview
- 16.2.3.2. Products
- 16.2.3.3. SWOT Analysis
- 16.2.3.4. Recent Developments
- 16.2.3.5. Financials (Based on Availability)
- 16.2.4 Verifone Systems Inc
- 16.2.4.1. Overview
- 16.2.4.2. Products
- 16.2.4.3. SWOT Analysis
- 16.2.4.4. Recent Developments
- 16.2.4.5. Financials (Based on Availability)
- 16.2.5 NEC Corporation
- 16.2.5.1. Overview
- 16.2.5.2. Products
- 16.2.5.3. SWOT Analysis
- 16.2.5.4. Recent Developments
- 16.2.5.5. Financials (Based on Availability)
- 16.2.6 SZZT Electronics Co Ltd
- 16.2.6.1. Overview
- 16.2.6.2. Products
- 16.2.6.3. SWOT Analysis
- 16.2.6.4. Recent Developments
- 16.2.6.5. Financials (Based on Availability)
- 16.2.7 Usa Technologies (Cantaloupe Inc )
- 16.2.7.1. Overview
- 16.2.7.2. Products
- 16.2.7.3. SWOT Analysis
- 16.2.7.4. Recent Developments
- 16.2.7.5. Financials (Based on Availability)
- 16.2.8 Square Capital LLC (Block Inc
- 16.2.8.1. Overview
- 16.2.8.2. Products
- 16.2.8.3. SWOT Analysis
- 16.2.8.4. Recent Developments
- 16.2.8.5. Financials (Based on Availability)
- 16.2.9 PAX Technology Ltd
- 16.2.9.1. Overview
- 16.2.9.2. Products
- 16.2.9.3. SWOT Analysis
- 16.2.9.4. Recent Developments
- 16.2.9.5. Financials (Based on Availability)
- 16.2.10 Castles Technology
- 16.2.10.1. Overview
- 16.2.10.2. Products
- 16.2.10.3. SWOT Analysis
- 16.2.10.4. Recent Developments
- 16.2.10.5. Financials (Based on Availability)
- 16.2.1 BBPOS Limited (stripe)
List of Figures
- Figure 1: Global US POS Terminals Market Revenue Breakdown (Million, %) by Region 2024 & 2032
- Figure 2: United states US POS Terminals Market Revenue (Million), by Country 2024 & 2032
- Figure 3: United states US POS Terminals Market Revenue Share (%), by Country 2024 & 2032
- Figure 4: North America US POS Terminals Market Revenue (Million), by Component 2024 & 2032
- Figure 5: North America US POS Terminals Market Revenue Share (%), by Component 2024 & 2032
- Figure 6: North America US POS Terminals Market Revenue (Million), by Type 2024 & 2032
- Figure 7: North America US POS Terminals Market Revenue Share (%), by Type 2024 & 2032
- Figure 8: North America US POS Terminals Market Revenue (Million), by End-user Industry 2024 & 2032
- Figure 9: North America US POS Terminals Market Revenue Share (%), by End-user Industry 2024 & 2032
- Figure 10: North America US POS Terminals Market Revenue (Million), by Country 2024 & 2032
- Figure 11: North America US POS Terminals Market Revenue Share (%), by Country 2024 & 2032
- Figure 12: South America US POS Terminals Market Revenue (Million), by Component 2024 & 2032
- Figure 13: South America US POS Terminals Market Revenue Share (%), by Component 2024 & 2032
- Figure 14: South America US POS Terminals Market Revenue (Million), by Type 2024 & 2032
- Figure 15: South America US POS Terminals Market Revenue Share (%), by Type 2024 & 2032
- Figure 16: South America US POS Terminals Market Revenue (Million), by End-user Industry 2024 & 2032
- Figure 17: South America US POS Terminals Market Revenue Share (%), by End-user Industry 2024 & 2032
- Figure 18: South America US POS Terminals Market Revenue (Million), by Country 2024 & 2032
- Figure 19: South America US POS Terminals Market Revenue Share (%), by Country 2024 & 2032
- Figure 20: Europe US POS Terminals Market Revenue (Million), by Component 2024 & 2032
- Figure 21: Europe US POS Terminals Market Revenue Share (%), by Component 2024 & 2032
- Figure 22: Europe US POS Terminals Market Revenue (Million), by Type 2024 & 2032
- Figure 23: Europe US POS Terminals Market Revenue Share (%), by Type 2024 & 2032
- Figure 24: Europe US POS Terminals Market Revenue (Million), by End-user Industry 2024 & 2032
- Figure 25: Europe US POS Terminals Market Revenue Share (%), by End-user Industry 2024 & 2032
- Figure 26: Europe US POS Terminals Market Revenue (Million), by Country 2024 & 2032
- Figure 27: Europe US POS Terminals Market Revenue Share (%), by Country 2024 & 2032
- Figure 28: Middle East & Africa US POS Terminals Market Revenue (Million), by Component 2024 & 2032
- Figure 29: Middle East & Africa US POS Terminals Market Revenue Share (%), by Component 2024 & 2032
- Figure 30: Middle East & Africa US POS Terminals Market Revenue (Million), by Type 2024 & 2032
- Figure 31: Middle East & Africa US POS Terminals Market Revenue Share (%), by Type 2024 & 2032
- Figure 32: Middle East & Africa US POS Terminals Market Revenue (Million), by End-user Industry 2024 & 2032
- Figure 33: Middle East & Africa US POS Terminals Market Revenue Share (%), by End-user Industry 2024 & 2032
- Figure 34: Middle East & Africa US POS Terminals Market Revenue (Million), by Country 2024 & 2032
- Figure 35: Middle East & Africa US POS Terminals Market Revenue Share (%), by Country 2024 & 2032
- Figure 36: Asia Pacific US POS Terminals Market Revenue (Million), by Component 2024 & 2032
- Figure 37: Asia Pacific US POS Terminals Market Revenue Share (%), by Component 2024 & 2032
- Figure 38: Asia Pacific US POS Terminals Market Revenue (Million), by Type 2024 & 2032
- Figure 39: Asia Pacific US POS Terminals Market Revenue Share (%), by Type 2024 & 2032
- Figure 40: Asia Pacific US POS Terminals Market Revenue (Million), by End-user Industry 2024 & 2032
- Figure 41: Asia Pacific US POS Terminals Market Revenue Share (%), by End-user Industry 2024 & 2032
- Figure 42: Asia Pacific US POS Terminals Market Revenue (Million), by Country 2024 & 2032
- Figure 43: Asia Pacific US POS Terminals Market Revenue Share (%), by Country 2024 & 2032
List of Tables
- Table 1: Global US POS Terminals Market Revenue Million Forecast, by Region 2019 & 2032
- Table 2: Global US POS Terminals Market Revenue Million Forecast, by Component 2019 & 2032
- Table 3: Global US POS Terminals Market Revenue Million Forecast, by Type 2019 & 2032
- Table 4: Global US POS Terminals Market Revenue Million Forecast, by End-user Industry 2019 & 2032
- Table 5: Global US POS Terminals Market Revenue Million Forecast, by Region 2019 & 2032
- Table 6: Global US POS Terminals Market Revenue Million Forecast, by Country 2019 & 2032
- Table 7: Northeast US POS Terminals Market Revenue (Million) Forecast, by Application 2019 & 2032
- Table 8: Southeast US POS Terminals Market Revenue (Million) Forecast, by Application 2019 & 2032
- Table 9: Midwest US POS Terminals Market Revenue (Million) Forecast, by Application 2019 & 2032
- Table 10: Southwest US POS Terminals Market Revenue (Million) Forecast, by Application 2019 & 2032
- Table 11: West US POS Terminals Market Revenue (Million) Forecast, by Application 2019 & 2032
- Table 12: Global US POS Terminals Market Revenue Million Forecast, by Component 2019 & 2032
- Table 13: Global US POS Terminals Market Revenue Million Forecast, by Type 2019 & 2032
- Table 14: Global US POS Terminals Market Revenue Million Forecast, by End-user Industry 2019 & 2032
- Table 15: Global US POS Terminals Market Revenue Million Forecast, by Country 2019 & 2032
- Table 16: United States US POS Terminals Market Revenue (Million) Forecast, by Application 2019 & 2032
- Table 17: Canada US POS Terminals Market Revenue (Million) Forecast, by Application 2019 & 2032
- Table 18: Mexico US POS Terminals Market Revenue (Million) Forecast, by Application 2019 & 2032
- Table 19: Global US POS Terminals Market Revenue Million Forecast, by Component 2019 & 2032
- Table 20: Global US POS Terminals Market Revenue Million Forecast, by Type 2019 & 2032
- Table 21: Global US POS Terminals Market Revenue Million Forecast, by End-user Industry 2019 & 2032
- Table 22: Global US POS Terminals Market Revenue Million Forecast, by Country 2019 & 2032
- Table 23: Brazil US POS Terminals Market Revenue (Million) Forecast, by Application 2019 & 2032
- Table 24: Argentina US POS Terminals Market Revenue (Million) Forecast, by Application 2019 & 2032
- Table 25: Rest of South America US POS Terminals Market Revenue (Million) Forecast, by Application 2019 & 2032
- Table 26: Global US POS Terminals Market Revenue Million Forecast, by Component 2019 & 2032
- Table 27: Global US POS Terminals Market Revenue Million Forecast, by Type 2019 & 2032
- Table 28: Global US POS Terminals Market Revenue Million Forecast, by End-user Industry 2019 & 2032
- Table 29: Global US POS Terminals Market Revenue Million Forecast, by Country 2019 & 2032
- Table 30: United Kingdom US POS Terminals Market Revenue (Million) Forecast, by Application 2019 & 2032
- Table 31: Germany US POS Terminals Market Revenue (Million) Forecast, by Application 2019 & 2032
- Table 32: France US POS Terminals Market Revenue (Million) Forecast, by Application 2019 & 2032
- Table 33: Italy US POS Terminals Market Revenue (Million) Forecast, by Application 2019 & 2032
- Table 34: Spain US POS Terminals Market Revenue (Million) Forecast, by Application 2019 & 2032
- Table 35: Russia US POS Terminals Market Revenue (Million) Forecast, by Application 2019 & 2032
- Table 36: Benelux US POS Terminals Market Revenue (Million) Forecast, by Application 2019 & 2032
- Table 37: Nordics US POS Terminals Market Revenue (Million) Forecast, by Application 2019 & 2032
- Table 38: Rest of Europe US POS Terminals Market Revenue (Million) Forecast, by Application 2019 & 2032
- Table 39: Global US POS Terminals Market Revenue Million Forecast, by Component 2019 & 2032
- Table 40: Global US POS Terminals Market Revenue Million Forecast, by Type 2019 & 2032
- Table 41: Global US POS Terminals Market Revenue Million Forecast, by End-user Industry 2019 & 2032
- Table 42: Global US POS Terminals Market Revenue Million Forecast, by Country 2019 & 2032
- Table 43: Turkey US POS Terminals Market Revenue (Million) Forecast, by Application 2019 & 2032
- Table 44: Israel US POS Terminals Market Revenue (Million) Forecast, by Application 2019 & 2032
- Table 45: GCC US POS Terminals Market Revenue (Million) Forecast, by Application 2019 & 2032
- Table 46: North Africa US POS Terminals Market Revenue (Million) Forecast, by Application 2019 & 2032
- Table 47: South Africa US POS Terminals Market Revenue (Million) Forecast, by Application 2019 & 2032
- Table 48: Rest of Middle East & Africa US POS Terminals Market Revenue (Million) Forecast, by Application 2019 & 2032
- Table 49: Global US POS Terminals Market Revenue Million Forecast, by Component 2019 & 2032
- Table 50: Global US POS Terminals Market Revenue Million Forecast, by Type 2019 & 2032
- Table 51: Global US POS Terminals Market Revenue Million Forecast, by End-user Industry 2019 & 2032
- Table 52: Global US POS Terminals Market Revenue Million Forecast, by Country 2019 & 2032
- Table 53: China US POS Terminals Market Revenue (Million) Forecast, by Application 2019 & 2032
- Table 54: India US POS Terminals Market Revenue (Million) Forecast, by Application 2019 & 2032
- Table 55: Japan US POS Terminals Market Revenue (Million) Forecast, by Application 2019 & 2032
- Table 56: South Korea US POS Terminals Market Revenue (Million) Forecast, by Application 2019 & 2032
- Table 57: ASEAN US POS Terminals Market Revenue (Million) Forecast, by Application 2019 & 2032
- Table 58: Oceania US POS Terminals Market Revenue (Million) Forecast, by Application 2019 & 2032
- Table 59: Rest of Asia Pacific US POS Terminals Market Revenue (Million) Forecast, by Application 2019 & 2032
Frequently Asked Questions
1. What is the projected Compound Annual Growth Rate (CAGR) of the US POS Terminals Market?
The projected CAGR is approximately 8.92%.
2. Which companies are prominent players in the US POS Terminals Market?
Key companies in the market include BBPOS Limited (stripe), Dspread Technology (Beijing) Inc, Ingenico Inc (Apollo Asset Management), Verifone Systems Inc, NEC Corporation, SZZT Electronics Co Ltd, Usa Technologies (Cantaloupe Inc ), Square Capital LLC (Block Inc, PAX Technology Ltd, Castles Technology.
3. What are the main segments of the US POS Terminals Market?
The market segments include Component, Type, End-user Industry.
4. Can you provide details about the market size?
The market size is estimated to be USD 26.73 Million as of 2022.
5. What are some drivers contributing to market growth?
Growing Investments in POS and Digitalization in the Payment Industry; Growing Demand for Contactless Payments; Increasing Demand for More Secured Payment Options.
6. What are the notable trends driving market growth?
The Retail Segment is Expected to Grow Significantly.
7. Are there any restraints impacting market growth?
Security Concerns Related to Cyber Attacks and Data Breaches; Lack of Robust and Reliable Infrastructure in Remote Regions.
8. Can you provide examples of recent developments in the market?
January 2024 - PAR Technology launched PAR Wave POS Terminal to meet future restaurant industry needs, seamlessly blending functionality, performance, security, and innovative design. PAR recognizes the growing significance of these aspects in restaurant operations and strives to provide solutions that harmonize with the evolving landscape. The technology can run complex software efficiently, offering reliability for diverse operational needs.
9. What pricing options are available for accessing the report?
Pricing options include single-user, multi-user, and enterprise licenses priced at USD 3800, USD 4500, and USD 5800 respectively.
10. Is the market size provided in terms of value or volume?
The market size is provided in terms of value, measured in Million.
11. Are there any specific market keywords associated with the report?
Yes, the market keyword associated with the report is "US POS Terminals Market," which aids in identifying and referencing the specific market segment covered.
12. How do I determine which pricing option suits my needs best?
The pricing options vary based on user requirements and access needs. Individual users may opt for single-user licenses, while businesses requiring broader access may choose multi-user or enterprise licenses for cost-effective access to the report.
13. Are there any additional resources or data provided in the US POS Terminals Market report?
While the report offers comprehensive insights, it's advisable to review the specific contents or supplementary materials provided to ascertain if additional resources or data are available.
14. How can I stay updated on further developments or reports in the US POS Terminals Market?
To stay informed about further developments, trends, and reports in the US POS Terminals Market, consider subscribing to industry newsletters, following relevant companies and organizations, or regularly checking reputable industry news sources and publications.
Methodology
Step 1 - Identification of Relevant Samples Size from Population Database


Step 2 - Approaches for Defining Global Market Size (Value, Volume* & Price*)

Note*: In applicable scenarios
Step 3 - Data Sources
Primary Research
- Web Analytics
- Survey Reports
- Research Institute
- Latest Research Reports
- Opinion Leaders
Secondary Research
- Annual Reports
- White Paper
- Latest Press Release
- Industry Association
- Paid Database
- Investor Presentations

Step 4 - Data Triangulation
Involves using different sources of information in order to increase the validity of a study
These sources are likely to be stakeholders in a program - participants, other researchers, program staff, other community members, and so on.
Then we put all data in single framework & apply various statistical tools to find out the dynamic on the market.
During the analysis stage, feedback from the stakeholder groups would be compared to determine areas of agreement as well as areas of divergence


