
Key Insights
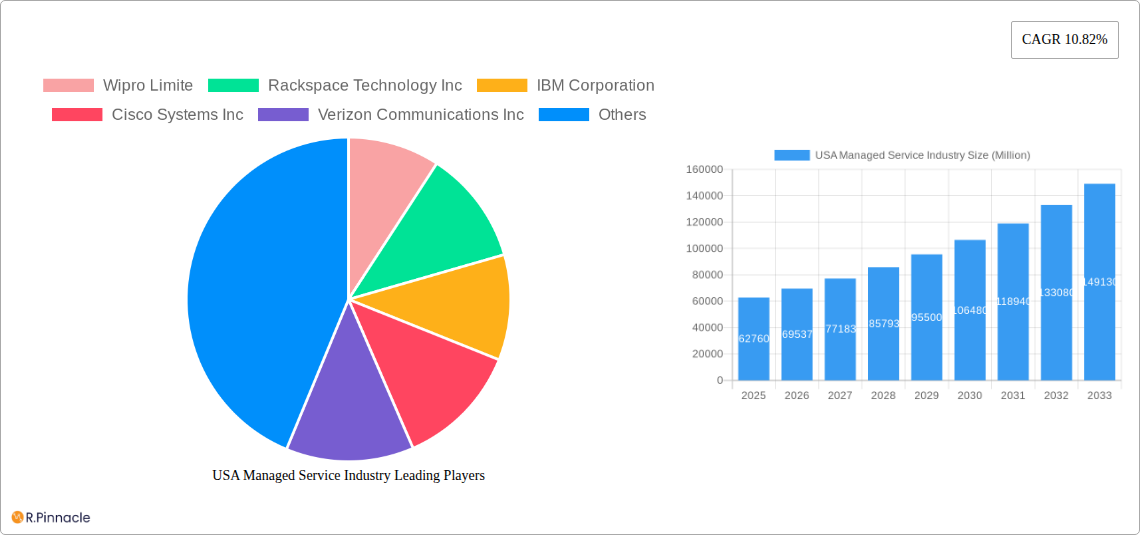
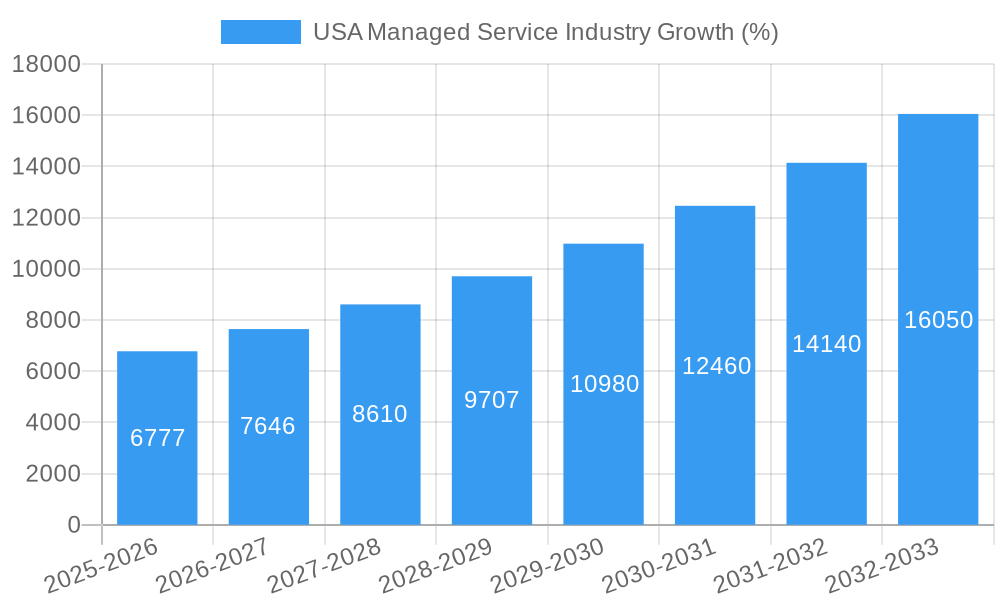
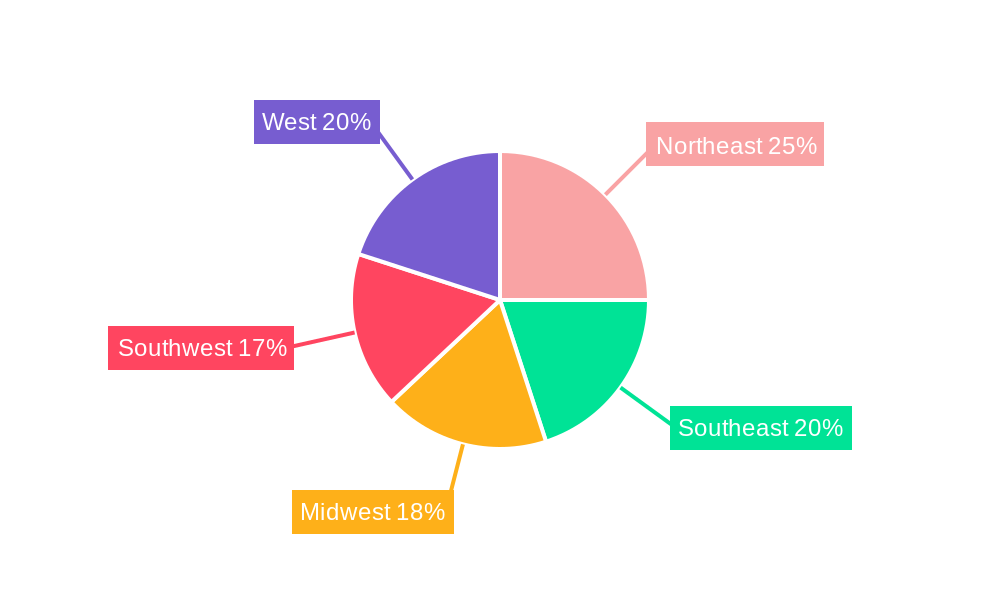
The US managed services market, valued at $62.76 billion in 2025, is experiencing robust growth, projected to expand at a compound annual growth rate (CAGR) of 10.82% from 2025 to 2033. This expansion is driven by several key factors. Increasing adoption of cloud computing necessitates robust management solutions, leading to significant demand for managed cloud services. Similarly, the growing complexity of IT infrastructure, coupled with a persistent shortage of skilled cybersecurity professionals, fuels the demand for managed security services. The rise of hybrid work models and the increasing reliance on mobile devices further accelerate growth in managed mobility and managed network services. Large enterprises are leading the adoption, followed by a rapidly growing segment of small and medium-sized enterprises (SMEs) seeking cost-effective IT solutions. Key verticals driving this growth include BFSI (Banking, Financial Services, and Insurance), IT and Telecom, and Healthcare, each facing unique challenges requiring specialized managed services. The US market is geographically diverse, with significant growth anticipated across all regions, including the Northeast, Southeast, Midwest, Southwest, and West, reflecting the widespread digital transformation across the nation.
The competitive landscape is intensely dynamic, with major players like Wipro, Rackspace Technology, IBM, Cisco, Verizon, Microsoft, HP, Fujitsu, TCS, Dell Technologies, AT&T, and Citrix vying for market share. These companies are leveraging technological advancements like AI and automation to enhance their service offerings and maintain a competitive edge. However, challenges remain, including potential security breaches, ensuring service level agreements (SLAs), and managing the complexities of diverse technological environments. The market's future growth trajectory hinges on continued technological innovation, increasing cybersecurity threats demanding proactive mitigation strategies, and the ongoing digital transformation efforts across various industries. Sustained investment in research and development, particularly in areas such as artificial intelligence (AI) for automated service management, will be crucial for companies to maintain leadership positions in this rapidly evolving market.
USA Managed Service Industry Market Report: 2019-2033
This comprehensive report provides an in-depth analysis of the USA Managed Service Industry, offering valuable insights for industry professionals, investors, and strategic decision-makers. Covering the period from 2019 to 2033, with a focus on 2025, this report delves into market structure, dynamics, segmentation, key players, and future outlook. The market is projected to reach xx Million by 2033, exhibiting a CAGR of xx% during the forecast period (2025-2033).
USA Managed Service Industry Market Structure & Innovation Trends
The USA Managed Service Industry is characterized by a moderately concentrated market structure, with a few major players holding significant market share. Wipro Limited, Rackspace Technology Inc, IBM Corporation, and Cisco Systems Inc. are among the leading players, collectively accounting for an estimated xx% of the market in 2025. However, the market also features numerous smaller players and niche providers, creating a dynamic and competitive landscape.
- Market Share (2025 Estimate): Wipro Limited (xx%), Rackspace Technology Inc (xx%), IBM Corporation (xx%), Cisco Systems Inc (xx%), Others (xx%).
- Innovation Drivers: Cloud computing adoption, increasing cybersecurity threats, the rise of AI and machine learning in managed services, and the growing demand for digital transformation initiatives are major drivers of innovation.
- Regulatory Frameworks: Compliance requirements such as HIPAA, GDPR, and CCPA significantly influence the market. These regulations drive demand for robust security and data privacy solutions within managed services.
- M&A Activities: The industry has witnessed significant M&A activity in recent years, with deal values totaling xx Million in 2024. These mergers and acquisitions aim to expand market reach, enhance service offerings, and acquire specialized technologies.
USA Managed Service Industry Market Dynamics & Trends
The USA Managed Service Industry is experiencing robust growth fueled by several key factors. The increasing adoption of cloud-based services, coupled with the rising need for IT infrastructure optimization and enhanced cybersecurity, is driving market expansion. Businesses are increasingly outsourcing IT operations to focus on core competencies, creating significant demand for managed services. The market is also witnessing technological disruptions such as the integration of AI and automation in service delivery, leading to improved efficiency and cost optimization. Consumer preference is shifting towards flexible, scalable, and cost-effective solutions, which fuels the demand for cloud-based managed services. Competitive dynamics are shaped by the ongoing innovation in service offerings and the strategic alliances between major players. The market is expected to maintain strong growth momentum, with a CAGR of xx% from 2025 to 2033, reaching a market size of xx Million by 2033. Market penetration is expected to increase from xx% in 2025 to xx% in 2033.
Dominant Regions & Segments in USA Managed Service Industry
The market exhibits significant regional variations in growth and adoption of managed services. The leading segment by deployment is cloud, driven by its scalability, flexibility, and cost-effectiveness. Within the type of services, Managed Security stands out due to the increasing number of cyber threats. Large enterprises are the primary consumers of managed services due to their complex IT infrastructure and stringent security requirements. The BFSI (Banking, Financial Services, and Insurance) sector dominates in end-user verticals, owing to the high value placed on data security and regulatory compliance.
- Key Drivers (Cloud Segment): Scalability, cost-effectiveness, flexibility, and enhanced security features.
- Key Drivers (Managed Security Segment): Rising cyber threats, stringent regulatory compliance requirements, and the need for proactive security measures.
- Key Drivers (Large Enterprises Segment): Complex IT infrastructures, high security requirements, and the need to focus on core business operations.
- Key Drivers (BFSI Segment): Stringent regulatory compliance, high value of data, and the need for robust security measures.
USA Managed Service Industry Product Innovations
Recent product innovations are focusing on integrating AI and automation to improve efficiency, enhance security, and deliver cost-effective solutions. The rise of cloud-native managed services and the increasing adoption of hybrid cloud models are shaping the market. These innovations align with the growing demand for flexible, scalable, and secure solutions, which improves market fit and provides a competitive advantage to providers that adopt them.
Report Scope & Segmentation Analysis
This report segments the USA Managed Service Industry by deployment (on-premise and cloud), type (managed data center, managed security, managed communications, managed network, managed infrastructure, managed mobility), enterprise size (small and medium enterprises and large enterprises), and end-user vertical (BFSI, IT and Telecom, Healthcare, Entertainment and Media, Retail, Manufacturing, Government, and Other End-user Verticals). Each segment's market size, growth projection, and competitive dynamics are analyzed individually, providing a detailed understanding of the overall market landscape. The cloud segment is anticipated to show the highest CAGR due to its inherent benefits. The large enterprise segment holds the largest market share. BFSI is the leading end-user vertical due to its high regulatory compliance needs.
Key Drivers of USA Managed Service Industry Growth
Technological advancements, including AI and cloud computing, are driving industry growth by providing cost-effective and scalable solutions. Economic factors, such as the increasing need for businesses to optimize IT costs and improve efficiency, further fuel demand. Regulatory compliance requirements and the need for robust security solutions also contribute significantly. The rising prevalence of cyber threats is pushing organizations to outsource security management to specialized providers.
Challenges in the USA Managed Service Industry Sector
The industry faces challenges such as intense competition, skilled labor shortages, and the increasing complexity of cybersecurity threats. Supply chain disruptions and the need for continuous investment in advanced technologies add to these pressures. These factors lead to increased operational costs and pressure on profitability for some providers. The total impact of these factors on the market is estimated to reduce the overall growth rate by approximately xx%.
Emerging Opportunities in USA Managed Service Industry
Emerging technologies like AI, IoT, and edge computing present significant opportunities for growth. The increasing adoption of hybrid and multi-cloud strategies, along with the expanding demand for managed security services, provides further opportunities. The development of specialized managed services catering to specific vertical industries (e.g., healthcare, finance) also presents a significant growth opportunity.
Leading Players in the USA Managed Service Industry Market
- Wipro Limited
- Rackspace Technology Inc
- IBM Corporation
- Cisco Systems Inc
- Verizon Communications Inc
- Microsoft Corporation
- HP Inc
- Fujitsu Limited
- Tata Consultancy Services Limited
- Dell Technologies Inc
- AT&T Inc
- Citrix Systems Inc
Key Developments in USA Managed Service Industry
- October 2023: Rackspace Technology introduced Rackspace Managed Cloud (RMC), expanding its service portfolio and addressing the growing demand for comprehensive cloud management solutions.
- August 2023: Verizon Business partnered with HCLTech for Managed Network Services (MNS), strengthening its position in the enterprise networking market and enhancing its service offerings.
Future Outlook for USA Managed Service Industry Market
The future outlook for the USA Managed Service Industry remains positive, driven by continued growth in cloud adoption, increasing cybersecurity threats, and the ongoing digital transformation initiatives across various sectors. The market is expected to benefit from the emergence of new technologies like AI and IoT, further expanding its scope and opportunities. Strategic partnerships, mergers, and acquisitions will continue to shape the industry landscape, enhancing competitiveness and driving innovation.
USA Managed Service Industry Segmentation
-
1. Deployment
- 1.1. On-premise
- 1.2. Cloud
-
2. Type
- 2.1. Managed Data Center
- 2.2. Managed Security
- 2.3. Managed Communications
- 2.4. Managed Network
- 2.5. Managed Infrastructure
- 2.6. Managed Mobility
-
3. Enterprise Size
- 3.1. Small and Medium Enterprises
- 3.2. Large Enterprises
-
4. End-user Vertical
- 4.1. BFSI
- 4.2. IT and Telecom
- 4.3. Healthcare
- 4.4. Entertainment and Media
- 4.5. Retail
- 4.6. Manufacturing
- 4.7. Government
- 4.8. Other End-user Verticals
USA Managed Service Industry Segmentation By Geography
-
1. North America
- 1.1. United States
- 1.2. Canada
- 1.3. Mexico
-
2. South America
- 2.1. Brazil
- 2.2. Argentina
- 2.3. Rest of South America
-
3. Europe
- 3.1. United Kingdom
- 3.2. Germany
- 3.3. France
- 3.4. Italy
- 3.5. Spain
- 3.6. Russia
- 3.7. Benelux
- 3.8. Nordics
- 3.9. Rest of Europe
-
4. Middle East & Africa
- 4.1. Turkey
- 4.2. Israel
- 4.3. GCC
- 4.4. North Africa
- 4.5. South Africa
- 4.6. Rest of Middle East & Africa
-
5. Asia Pacific
- 5.1. China
- 5.2. India
- 5.3. Japan
- 5.4. South Korea
- 5.5. ASEAN
- 5.6. Oceania
- 5.7. Rest of Asia Pacific
USA Managed Service Industry REPORT HIGHLIGHTS
| Aspects | Details |
|---|---|
| Study Period | 2019-2033 |
| Base Year | 2024 |
| Estimated Year | 2025 |
| Forecast Period | 2025-2033 |
| Historical Period | 2019-2024 |
| Growth Rate | CAGR of 10.82% from 2019-2033 |
| Segmentation |
|
Table of Contents
- 1. Introduction
- 1.1. Research Scope
- 1.2. Market Segmentation
- 1.3. Research Methodology
- 1.4. Definitions and Assumptions
- 2. Executive Summary
- 2.1. Introduction
- 3. Market Dynamics
- 3.1. Introduction
- 3.2. Market Drivers
- 3.2.1. Increasing Shift to Hybrid IT; Improved Cost and Operational Efficiency
- 3.3. Market Restrains
- 3.3.1 High Risk of Radiation Since it uses Gamma Rays
- 3.3.2 X-Rays; High Deployment Costs
- 3.4. Market Trends
- 3.4.1. Cloud to Witness Significant Growth
- 4. Market Factor Analysis
- 4.1. Porters Five Forces
- 4.2. Supply/Value Chain
- 4.3. PESTEL analysis
- 4.4. Market Entropy
- 4.5. Patent/Trademark Analysis
- 5. Global USA Managed Service Industry Analysis, Insights and Forecast, 2019-2031
- 5.1. Market Analysis, Insights and Forecast - by Deployment
- 5.1.1. On-premise
- 5.1.2. Cloud
- 5.2. Market Analysis, Insights and Forecast - by Type
- 5.2.1. Managed Data Center
- 5.2.2. Managed Security
- 5.2.3. Managed Communications
- 5.2.4. Managed Network
- 5.2.5. Managed Infrastructure
- 5.2.6. Managed Mobility
- 5.3. Market Analysis, Insights and Forecast - by Enterprise Size
- 5.3.1. Small and Medium Enterprises
- 5.3.2. Large Enterprises
- 5.4. Market Analysis, Insights and Forecast - by End-user Vertical
- 5.4.1. BFSI
- 5.4.2. IT and Telecom
- 5.4.3. Healthcare
- 5.4.4. Entertainment and Media
- 5.4.5. Retail
- 5.4.6. Manufacturing
- 5.4.7. Government
- 5.4.8. Other End-user Verticals
- 5.5. Market Analysis, Insights and Forecast - by Region
- 5.5.1. North America
- 5.5.2. South America
- 5.5.3. Europe
- 5.5.4. Middle East & Africa
- 5.5.5. Asia Pacific
- 5.1. Market Analysis, Insights and Forecast - by Deployment
- 6. North America USA Managed Service Industry Analysis, Insights and Forecast, 2019-2031
- 6.1. Market Analysis, Insights and Forecast - by Deployment
- 6.1.1. On-premise
- 6.1.2. Cloud
- 6.2. Market Analysis, Insights and Forecast - by Type
- 6.2.1. Managed Data Center
- 6.2.2. Managed Security
- 6.2.3. Managed Communications
- 6.2.4. Managed Network
- 6.2.5. Managed Infrastructure
- 6.2.6. Managed Mobility
- 6.3. Market Analysis, Insights and Forecast - by Enterprise Size
- 6.3.1. Small and Medium Enterprises
- 6.3.2. Large Enterprises
- 6.4. Market Analysis, Insights and Forecast - by End-user Vertical
- 6.4.1. BFSI
- 6.4.2. IT and Telecom
- 6.4.3. Healthcare
- 6.4.4. Entertainment and Media
- 6.4.5. Retail
- 6.4.6. Manufacturing
- 6.4.7. Government
- 6.4.8. Other End-user Verticals
- 6.1. Market Analysis, Insights and Forecast - by Deployment
- 7. South America USA Managed Service Industry Analysis, Insights and Forecast, 2019-2031
- 7.1. Market Analysis, Insights and Forecast - by Deployment
- 7.1.1. On-premise
- 7.1.2. Cloud
- 7.2. Market Analysis, Insights and Forecast - by Type
- 7.2.1. Managed Data Center
- 7.2.2. Managed Security
- 7.2.3. Managed Communications
- 7.2.4. Managed Network
- 7.2.5. Managed Infrastructure
- 7.2.6. Managed Mobility
- 7.3. Market Analysis, Insights and Forecast - by Enterprise Size
- 7.3.1. Small and Medium Enterprises
- 7.3.2. Large Enterprises
- 7.4. Market Analysis, Insights and Forecast - by End-user Vertical
- 7.4.1. BFSI
- 7.4.2. IT and Telecom
- 7.4.3. Healthcare
- 7.4.4. Entertainment and Media
- 7.4.5. Retail
- 7.4.6. Manufacturing
- 7.4.7. Government
- 7.4.8. Other End-user Verticals
- 7.1. Market Analysis, Insights and Forecast - by Deployment
- 8. Europe USA Managed Service Industry Analysis, Insights and Forecast, 2019-2031
- 8.1. Market Analysis, Insights and Forecast - by Deployment
- 8.1.1. On-premise
- 8.1.2. Cloud
- 8.2. Market Analysis, Insights and Forecast - by Type
- 8.2.1. Managed Data Center
- 8.2.2. Managed Security
- 8.2.3. Managed Communications
- 8.2.4. Managed Network
- 8.2.5. Managed Infrastructure
- 8.2.6. Managed Mobility
- 8.3. Market Analysis, Insights and Forecast - by Enterprise Size
- 8.3.1. Small and Medium Enterprises
- 8.3.2. Large Enterprises
- 8.4. Market Analysis, Insights and Forecast - by End-user Vertical
- 8.4.1. BFSI
- 8.4.2. IT and Telecom
- 8.4.3. Healthcare
- 8.4.4. Entertainment and Media
- 8.4.5. Retail
- 8.4.6. Manufacturing
- 8.4.7. Government
- 8.4.8. Other End-user Verticals
- 8.1. Market Analysis, Insights and Forecast - by Deployment
- 9. Middle East & Africa USA Managed Service Industry Analysis, Insights and Forecast, 2019-2031
- 9.1. Market Analysis, Insights and Forecast - by Deployment
- 9.1.1. On-premise
- 9.1.2. Cloud
- 9.2. Market Analysis, Insights and Forecast - by Type
- 9.2.1. Managed Data Center
- 9.2.2. Managed Security
- 9.2.3. Managed Communications
- 9.2.4. Managed Network
- 9.2.5. Managed Infrastructure
- 9.2.6. Managed Mobility
- 9.3. Market Analysis, Insights and Forecast - by Enterprise Size
- 9.3.1. Small and Medium Enterprises
- 9.3.2. Large Enterprises
- 9.4. Market Analysis, Insights and Forecast - by End-user Vertical
- 9.4.1. BFSI
- 9.4.2. IT and Telecom
- 9.4.3. Healthcare
- 9.4.4. Entertainment and Media
- 9.4.5. Retail
- 9.4.6. Manufacturing
- 9.4.7. Government
- 9.4.8. Other End-user Verticals
- 9.1. Market Analysis, Insights and Forecast - by Deployment
- 10. Asia Pacific USA Managed Service Industry Analysis, Insights and Forecast, 2019-2031
- 10.1. Market Analysis, Insights and Forecast - by Deployment
- 10.1.1. On-premise
- 10.1.2. Cloud
- 10.2. Market Analysis, Insights and Forecast - by Type
- 10.2.1. Managed Data Center
- 10.2.2. Managed Security
- 10.2.3. Managed Communications
- 10.2.4. Managed Network
- 10.2.5. Managed Infrastructure
- 10.2.6. Managed Mobility
- 10.3. Market Analysis, Insights and Forecast - by Enterprise Size
- 10.3.1. Small and Medium Enterprises
- 10.3.2. Large Enterprises
- 10.4. Market Analysis, Insights and Forecast - by End-user Vertical
- 10.4.1. BFSI
- 10.4.2. IT and Telecom
- 10.4.3. Healthcare
- 10.4.4. Entertainment and Media
- 10.4.5. Retail
- 10.4.6. Manufacturing
- 10.4.7. Government
- 10.4.8. Other End-user Verticals
- 10.1. Market Analysis, Insights and Forecast - by Deployment
- 11. Northeast USA Managed Service Industry Analysis, Insights and Forecast, 2019-2031
- 12. Southeast USA Managed Service Industry Analysis, Insights and Forecast, 2019-2031
- 13. Midwest USA Managed Service Industry Analysis, Insights and Forecast, 2019-2031
- 14. Southwest USA Managed Service Industry Analysis, Insights and Forecast, 2019-2031
- 15. West USA Managed Service Industry Analysis, Insights and Forecast, 2019-2031
- 16. Competitive Analysis
- 16.1. Global Market Share Analysis 2024
- 16.2. Company Profiles
- 16.2.1 Wipro Limite
- 16.2.1.1. Overview
- 16.2.1.2. Products
- 16.2.1.3. SWOT Analysis
- 16.2.1.4. Recent Developments
- 16.2.1.5. Financials (Based on Availability)
- 16.2.2 Rackspace Technology Inc
- 16.2.2.1. Overview
- 16.2.2.2. Products
- 16.2.2.3. SWOT Analysis
- 16.2.2.4. Recent Developments
- 16.2.2.5. Financials (Based on Availability)
- 16.2.3 IBM Corporation
- 16.2.3.1. Overview
- 16.2.3.2. Products
- 16.2.3.3. SWOT Analysis
- 16.2.3.4. Recent Developments
- 16.2.3.5. Financials (Based on Availability)
- 16.2.4 Cisco Systems Inc
- 16.2.4.1. Overview
- 16.2.4.2. Products
- 16.2.4.3. SWOT Analysis
- 16.2.4.4. Recent Developments
- 16.2.4.5. Financials (Based on Availability)
- 16.2.5 Verizon Communications Inc
- 16.2.5.1. Overview
- 16.2.5.2. Products
- 16.2.5.3. SWOT Analysis
- 16.2.5.4. Recent Developments
- 16.2.5.5. Financials (Based on Availability)
- 16.2.6 Microsoft Corporation
- 16.2.6.1. Overview
- 16.2.6.2. Products
- 16.2.6.3. SWOT Analysis
- 16.2.6.4. Recent Developments
- 16.2.6.5. Financials (Based on Availability)
- 16.2.7 HP Inc
- 16.2.7.1. Overview
- 16.2.7.2. Products
- 16.2.7.3. SWOT Analysis
- 16.2.7.4. Recent Developments
- 16.2.7.5. Financials (Based on Availability)
- 16.2.8 Fujitsu Limited
- 16.2.8.1. Overview
- 16.2.8.2. Products
- 16.2.8.3. SWOT Analysis
- 16.2.8.4. Recent Developments
- 16.2.8.5. Financials (Based on Availability)
- 16.2.9 Tata Consultancy Services Limited
- 16.2.9.1. Overview
- 16.2.9.2. Products
- 16.2.9.3. SWOT Analysis
- 16.2.9.4. Recent Developments
- 16.2.9.5. Financials (Based on Availability)
- 16.2.10 Dell Technologies Inc
- 16.2.10.1. Overview
- 16.2.10.2. Products
- 16.2.10.3. SWOT Analysis
- 16.2.10.4. Recent Developments
- 16.2.10.5. Financials (Based on Availability)
- 16.2.11 AT&T Inc
- 16.2.11.1. Overview
- 16.2.11.2. Products
- 16.2.11.3. SWOT Analysis
- 16.2.11.4. Recent Developments
- 16.2.11.5. Financials (Based on Availability)
- 16.2.12 Citrix Systems Inc
- 16.2.12.1. Overview
- 16.2.12.2. Products
- 16.2.12.3. SWOT Analysis
- 16.2.12.4. Recent Developments
- 16.2.12.5. Financials (Based on Availability)
- 16.2.1 Wipro Limite
List of Figures
- Figure 1: Global USA Managed Service Industry Revenue Breakdown (Million, %) by Region 2024 & 2032
- Figure 2: United states USA Managed Service Industry Revenue (Million), by Country 2024 & 2032
- Figure 3: United states USA Managed Service Industry Revenue Share (%), by Country 2024 & 2032
- Figure 4: North America USA Managed Service Industry Revenue (Million), by Deployment 2024 & 2032
- Figure 5: North America USA Managed Service Industry Revenue Share (%), by Deployment 2024 & 2032
- Figure 6: North America USA Managed Service Industry Revenue (Million), by Type 2024 & 2032
- Figure 7: North America USA Managed Service Industry Revenue Share (%), by Type 2024 & 2032
- Figure 8: North America USA Managed Service Industry Revenue (Million), by Enterprise Size 2024 & 2032
- Figure 9: North America USA Managed Service Industry Revenue Share (%), by Enterprise Size 2024 & 2032
- Figure 10: North America USA Managed Service Industry Revenue (Million), by End-user Vertical 2024 & 2032
- Figure 11: North America USA Managed Service Industry Revenue Share (%), by End-user Vertical 2024 & 2032
- Figure 12: North America USA Managed Service Industry Revenue (Million), by Country 2024 & 2032
- Figure 13: North America USA Managed Service Industry Revenue Share (%), by Country 2024 & 2032
- Figure 14: South America USA Managed Service Industry Revenue (Million), by Deployment 2024 & 2032
- Figure 15: South America USA Managed Service Industry Revenue Share (%), by Deployment 2024 & 2032
- Figure 16: South America USA Managed Service Industry Revenue (Million), by Type 2024 & 2032
- Figure 17: South America USA Managed Service Industry Revenue Share (%), by Type 2024 & 2032
- Figure 18: South America USA Managed Service Industry Revenue (Million), by Enterprise Size 2024 & 2032
- Figure 19: South America USA Managed Service Industry Revenue Share (%), by Enterprise Size 2024 & 2032
- Figure 20: South America USA Managed Service Industry Revenue (Million), by End-user Vertical 2024 & 2032
- Figure 21: South America USA Managed Service Industry Revenue Share (%), by End-user Vertical 2024 & 2032
- Figure 22: South America USA Managed Service Industry Revenue (Million), by Country 2024 & 2032
- Figure 23: South America USA Managed Service Industry Revenue Share (%), by Country 2024 & 2032
- Figure 24: Europe USA Managed Service Industry Revenue (Million), by Deployment 2024 & 2032
- Figure 25: Europe USA Managed Service Industry Revenue Share (%), by Deployment 2024 & 2032
- Figure 26: Europe USA Managed Service Industry Revenue (Million), by Type 2024 & 2032
- Figure 27: Europe USA Managed Service Industry Revenue Share (%), by Type 2024 & 2032
- Figure 28: Europe USA Managed Service Industry Revenue (Million), by Enterprise Size 2024 & 2032
- Figure 29: Europe USA Managed Service Industry Revenue Share (%), by Enterprise Size 2024 & 2032
- Figure 30: Europe USA Managed Service Industry Revenue (Million), by End-user Vertical 2024 & 2032
- Figure 31: Europe USA Managed Service Industry Revenue Share (%), by End-user Vertical 2024 & 2032
- Figure 32: Europe USA Managed Service Industry Revenue (Million), by Country 2024 & 2032
- Figure 33: Europe USA Managed Service Industry Revenue Share (%), by Country 2024 & 2032
- Figure 34: Middle East & Africa USA Managed Service Industry Revenue (Million), by Deployment 2024 & 2032
- Figure 35: Middle East & Africa USA Managed Service Industry Revenue Share (%), by Deployment 2024 & 2032
- Figure 36: Middle East & Africa USA Managed Service Industry Revenue (Million), by Type 2024 & 2032
- Figure 37: Middle East & Africa USA Managed Service Industry Revenue Share (%), by Type 2024 & 2032
- Figure 38: Middle East & Africa USA Managed Service Industry Revenue (Million), by Enterprise Size 2024 & 2032
- Figure 39: Middle East & Africa USA Managed Service Industry Revenue Share (%), by Enterprise Size 2024 & 2032
- Figure 40: Middle East & Africa USA Managed Service Industry Revenue (Million), by End-user Vertical 2024 & 2032
- Figure 41: Middle East & Africa USA Managed Service Industry Revenue Share (%), by End-user Vertical 2024 & 2032
- Figure 42: Middle East & Africa USA Managed Service Industry Revenue (Million), by Country 2024 & 2032
- Figure 43: Middle East & Africa USA Managed Service Industry Revenue Share (%), by Country 2024 & 2032
- Figure 44: Asia Pacific USA Managed Service Industry Revenue (Million), by Deployment 2024 & 2032
- Figure 45: Asia Pacific USA Managed Service Industry Revenue Share (%), by Deployment 2024 & 2032
- Figure 46: Asia Pacific USA Managed Service Industry Revenue (Million), by Type 2024 & 2032
- Figure 47: Asia Pacific USA Managed Service Industry Revenue Share (%), by Type 2024 & 2032
- Figure 48: Asia Pacific USA Managed Service Industry Revenue (Million), by Enterprise Size 2024 & 2032
- Figure 49: Asia Pacific USA Managed Service Industry Revenue Share (%), by Enterprise Size 2024 & 2032
- Figure 50: Asia Pacific USA Managed Service Industry Revenue (Million), by End-user Vertical 2024 & 2032
- Figure 51: Asia Pacific USA Managed Service Industry Revenue Share (%), by End-user Vertical 2024 & 2032
- Figure 52: Asia Pacific USA Managed Service Industry Revenue (Million), by Country 2024 & 2032
- Figure 53: Asia Pacific USA Managed Service Industry Revenue Share (%), by Country 2024 & 2032
List of Tables
- Table 1: Global USA Managed Service Industry Revenue Million Forecast, by Region 2019 & 2032
- Table 2: Global USA Managed Service Industry Revenue Million Forecast, by Deployment 2019 & 2032
- Table 3: Global USA Managed Service Industry Revenue Million Forecast, by Type 2019 & 2032
- Table 4: Global USA Managed Service Industry Revenue Million Forecast, by Enterprise Size 2019 & 2032
- Table 5: Global USA Managed Service Industry Revenue Million Forecast, by End-user Vertical 2019 & 2032
- Table 6: Global USA Managed Service Industry Revenue Million Forecast, by Region 2019 & 2032
- Table 7: Global USA Managed Service Industry Revenue Million Forecast, by Country 2019 & 2032
- Table 8: Northeast USA Managed Service Industry Revenue (Million) Forecast, by Application 2019 & 2032
- Table 9: Southeast USA Managed Service Industry Revenue (Million) Forecast, by Application 2019 & 2032
- Table 10: Midwest USA Managed Service Industry Revenue (Million) Forecast, by Application 2019 & 2032
- Table 11: Southwest USA Managed Service Industry Revenue (Million) Forecast, by Application 2019 & 2032
- Table 12: West USA Managed Service Industry Revenue (Million) Forecast, by Application 2019 & 2032
- Table 13: Global USA Managed Service Industry Revenue Million Forecast, by Deployment 2019 & 2032
- Table 14: Global USA Managed Service Industry Revenue Million Forecast, by Type 2019 & 2032
- Table 15: Global USA Managed Service Industry Revenue Million Forecast, by Enterprise Size 2019 & 2032
- Table 16: Global USA Managed Service Industry Revenue Million Forecast, by End-user Vertical 2019 & 2032
- Table 17: Global USA Managed Service Industry Revenue Million Forecast, by Country 2019 & 2032
- Table 18: United States USA Managed Service Industry Revenue (Million) Forecast, by Application 2019 & 2032
- Table 19: Canada USA Managed Service Industry Revenue (Million) Forecast, by Application 2019 & 2032
- Table 20: Mexico USA Managed Service Industry Revenue (Million) Forecast, by Application 2019 & 2032
- Table 21: Global USA Managed Service Industry Revenue Million Forecast, by Deployment 2019 & 2032
- Table 22: Global USA Managed Service Industry Revenue Million Forecast, by Type 2019 & 2032
- Table 23: Global USA Managed Service Industry Revenue Million Forecast, by Enterprise Size 2019 & 2032
- Table 24: Global USA Managed Service Industry Revenue Million Forecast, by End-user Vertical 2019 & 2032
- Table 25: Global USA Managed Service Industry Revenue Million Forecast, by Country 2019 & 2032
- Table 26: Brazil USA Managed Service Industry Revenue (Million) Forecast, by Application 2019 & 2032
- Table 27: Argentina USA Managed Service Industry Revenue (Million) Forecast, by Application 2019 & 2032
- Table 28: Rest of South America USA Managed Service Industry Revenue (Million) Forecast, by Application 2019 & 2032
- Table 29: Global USA Managed Service Industry Revenue Million Forecast, by Deployment 2019 & 2032
- Table 30: Global USA Managed Service Industry Revenue Million Forecast, by Type 2019 & 2032
- Table 31: Global USA Managed Service Industry Revenue Million Forecast, by Enterprise Size 2019 & 2032
- Table 32: Global USA Managed Service Industry Revenue Million Forecast, by End-user Vertical 2019 & 2032
- Table 33: Global USA Managed Service Industry Revenue Million Forecast, by Country 2019 & 2032
- Table 34: United Kingdom USA Managed Service Industry Revenue (Million) Forecast, by Application 2019 & 2032
- Table 35: Germany USA Managed Service Industry Revenue (Million) Forecast, by Application 2019 & 2032
- Table 36: France USA Managed Service Industry Revenue (Million) Forecast, by Application 2019 & 2032
- Table 37: Italy USA Managed Service Industry Revenue (Million) Forecast, by Application 2019 & 2032
- Table 38: Spain USA Managed Service Industry Revenue (Million) Forecast, by Application 2019 & 2032
- Table 39: Russia USA Managed Service Industry Revenue (Million) Forecast, by Application 2019 & 2032
- Table 40: Benelux USA Managed Service Industry Revenue (Million) Forecast, by Application 2019 & 2032
- Table 41: Nordics USA Managed Service Industry Revenue (Million) Forecast, by Application 2019 & 2032
- Table 42: Rest of Europe USA Managed Service Industry Revenue (Million) Forecast, by Application 2019 & 2032
- Table 43: Global USA Managed Service Industry Revenue Million Forecast, by Deployment 2019 & 2032
- Table 44: Global USA Managed Service Industry Revenue Million Forecast, by Type 2019 & 2032
- Table 45: Global USA Managed Service Industry Revenue Million Forecast, by Enterprise Size 2019 & 2032
- Table 46: Global USA Managed Service Industry Revenue Million Forecast, by End-user Vertical 2019 & 2032
- Table 47: Global USA Managed Service Industry Revenue Million Forecast, by Country 2019 & 2032
- Table 48: Turkey USA Managed Service Industry Revenue (Million) Forecast, by Application 2019 & 2032
- Table 49: Israel USA Managed Service Industry Revenue (Million) Forecast, by Application 2019 & 2032
- Table 50: GCC USA Managed Service Industry Revenue (Million) Forecast, by Application 2019 & 2032
- Table 51: North Africa USA Managed Service Industry Revenue (Million) Forecast, by Application 2019 & 2032
- Table 52: South Africa USA Managed Service Industry Revenue (Million) Forecast, by Application 2019 & 2032
- Table 53: Rest of Middle East & Africa USA Managed Service Industry Revenue (Million) Forecast, by Application 2019 & 2032
- Table 54: Global USA Managed Service Industry Revenue Million Forecast, by Deployment 2019 & 2032
- Table 55: Global USA Managed Service Industry Revenue Million Forecast, by Type 2019 & 2032
- Table 56: Global USA Managed Service Industry Revenue Million Forecast, by Enterprise Size 2019 & 2032
- Table 57: Global USA Managed Service Industry Revenue Million Forecast, by End-user Vertical 2019 & 2032
- Table 58: Global USA Managed Service Industry Revenue Million Forecast, by Country 2019 & 2032
- Table 59: China USA Managed Service Industry Revenue (Million) Forecast, by Application 2019 & 2032
- Table 60: India USA Managed Service Industry Revenue (Million) Forecast, by Application 2019 & 2032
- Table 61: Japan USA Managed Service Industry Revenue (Million) Forecast, by Application 2019 & 2032
- Table 62: South Korea USA Managed Service Industry Revenue (Million) Forecast, by Application 2019 & 2032
- Table 63: ASEAN USA Managed Service Industry Revenue (Million) Forecast, by Application 2019 & 2032
- Table 64: Oceania USA Managed Service Industry Revenue (Million) Forecast, by Application 2019 & 2032
- Table 65: Rest of Asia Pacific USA Managed Service Industry Revenue (Million) Forecast, by Application 2019 & 2032
Frequently Asked Questions
1. What is the projected Compound Annual Growth Rate (CAGR) of the USA Managed Service Industry?
The projected CAGR is approximately 10.82%.
2. Which companies are prominent players in the USA Managed Service Industry?
Key companies in the market include Wipro Limite, Rackspace Technology Inc, IBM Corporation, Cisco Systems Inc, Verizon Communications Inc, Microsoft Corporation, HP Inc, Fujitsu Limited, Tata Consultancy Services Limited, Dell Technologies Inc, AT&T Inc, Citrix Systems Inc.
3. What are the main segments of the USA Managed Service Industry?
The market segments include Deployment, Type, Enterprise Size, End-user Vertical.
4. Can you provide details about the market size?
The market size is estimated to be USD 62.76 Million as of 2022.
5. What are some drivers contributing to market growth?
Increasing Shift to Hybrid IT; Improved Cost and Operational Efficiency.
6. What are the notable trends driving market growth?
Cloud to Witness Significant Growth.
7. Are there any restraints impacting market growth?
High Risk of Radiation Since it uses Gamma Rays. X-Rays; High Deployment Costs.
8. Can you provide examples of recent developments in the market?
October 2023 - Rackspace Technology introduced Rackspace Managed Cloud (RMC), an all-inclusive service enabling customers to delegate their cloud environments' management and operations. This comprehensive solution is tailored for organizations utilizing platforms such as AWS, Azure, Google Cloud, Rackspace Private Cloud, and on-premises infrastructure.
9. What pricing options are available for accessing the report?
Pricing options include single-user, multi-user, and enterprise licenses priced at USD 3800, USD 4500, and USD 5800 respectively.
10. Is the market size provided in terms of value or volume?
The market size is provided in terms of value, measured in Million.
11. Are there any specific market keywords associated with the report?
Yes, the market keyword associated with the report is "USA Managed Service Industry," which aids in identifying and referencing the specific market segment covered.
12. How do I determine which pricing option suits my needs best?
The pricing options vary based on user requirements and access needs. Individual users may opt for single-user licenses, while businesses requiring broader access may choose multi-user or enterprise licenses for cost-effective access to the report.
13. Are there any additional resources or data provided in the USA Managed Service Industry report?
While the report offers comprehensive insights, it's advisable to review the specific contents or supplementary materials provided to ascertain if additional resources or data are available.
14. How can I stay updated on further developments or reports in the USA Managed Service Industry?
To stay informed about further developments, trends, and reports in the USA Managed Service Industry, consider subscribing to industry newsletters, following relevant companies and organizations, or regularly checking reputable industry news sources and publications.
Methodology
Step 1 - Identification of Relevant Samples Size from Population Database


Step 2 - Approaches for Defining Global Market Size (Value, Volume* & Price*)

Note*: In applicable scenarios
Step 3 - Data Sources
Primary Research
- Web Analytics
- Survey Reports
- Research Institute
- Latest Research Reports
- Opinion Leaders
Secondary Research
- Annual Reports
- White Paper
- Latest Press Release
- Industry Association
- Paid Database
- Investor Presentations

Step 4 - Data Triangulation
Involves using different sources of information in order to increase the validity of a study
These sources are likely to be stakeholders in a program - participants, other researchers, program staff, other community members, and so on.
Then we put all data in single framework & apply various statistical tools to find out the dynamic on the market.
During the analysis stage, feedback from the stakeholder groups would be compared to determine areas of agreement as well as areas of divergence


