
Key Insights
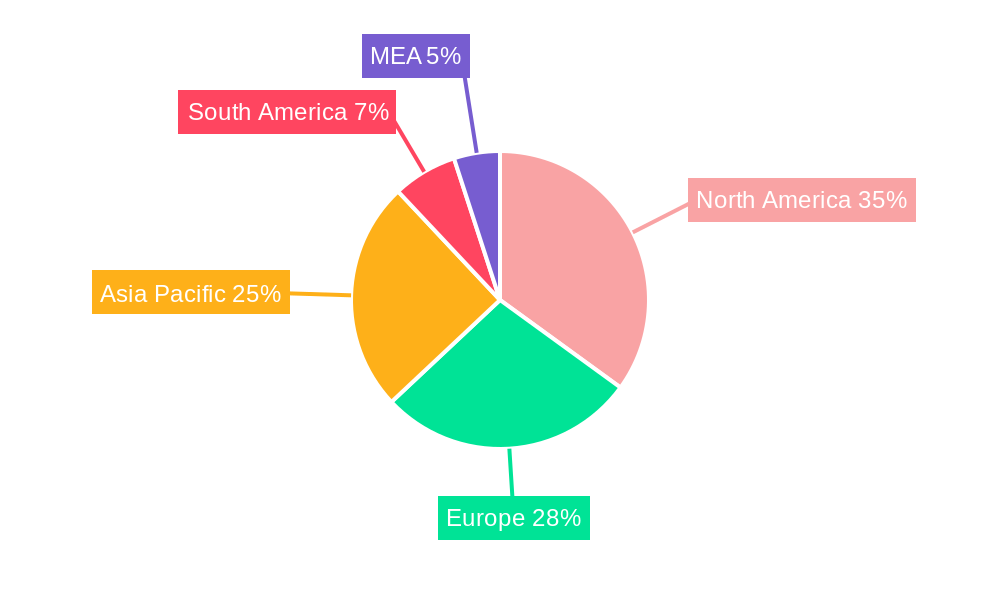
The Virtualized Evolved Packet Core (vEPC) market is experiencing explosive growth, driven by the surging demand for high-bandwidth, low-latency connectivity across various sectors. The market's 52% Compound Annual Growth Rate (CAGR) from 2019 to 2024 indicates a significant shift towards virtualized network functions, offering increased flexibility, scalability, and cost-effectiveness compared to traditional EPC infrastructure. Key drivers include the proliferation of 5G networks, the rise of Internet of Things (IoT) and Machine-to-Machine (M2M) communications, and the increasing adoption of cloud-based deployments. The cloud-based segment dominates the market due to its inherent agility and pay-as-you-go pricing models, attracting both large telecom operators and smaller mobile virtual network operators (MVNOs). The diverse applications, including IoT & M2M, MPN & MVNO, BWA, LTE, VoLTE & VoWiFi, further fuel market expansion, with IoT and 5G-related applications projected for substantial growth in the coming years. Geographic distribution shows strong growth across North America, Europe, and Asia-Pacific, with emerging markets in regions like South America and the Middle East and Africa poised for significant expansion as 5G infrastructure development accelerates.
While the market faces challenges such as security concerns related to virtualized environments and the complexities of integrating vEPC with existing network infrastructure, the overall trajectory remains strongly positive. The ongoing adoption of network slicing, edge computing, and AI-driven network optimization further enhances the value proposition of vEPC solutions. Leading vendors like Samsung, Cisco, Ericsson, Huawei, Nokia, and others are actively investing in R&D and strategic partnerships to capitalize on the market's immense potential. The forecast period (2025-2033) anticipates continued strong growth, propelled by the maturation of 5G technology and the increasing demand for high-capacity, flexible networking solutions across a wide range of industries and applications. The market's evolution is intricately linked to the broader trends in digital transformation and the growing reliance on interconnected devices and services.
Virtualized Evolved Packet Core Market: A Comprehensive Report (2019-2033)
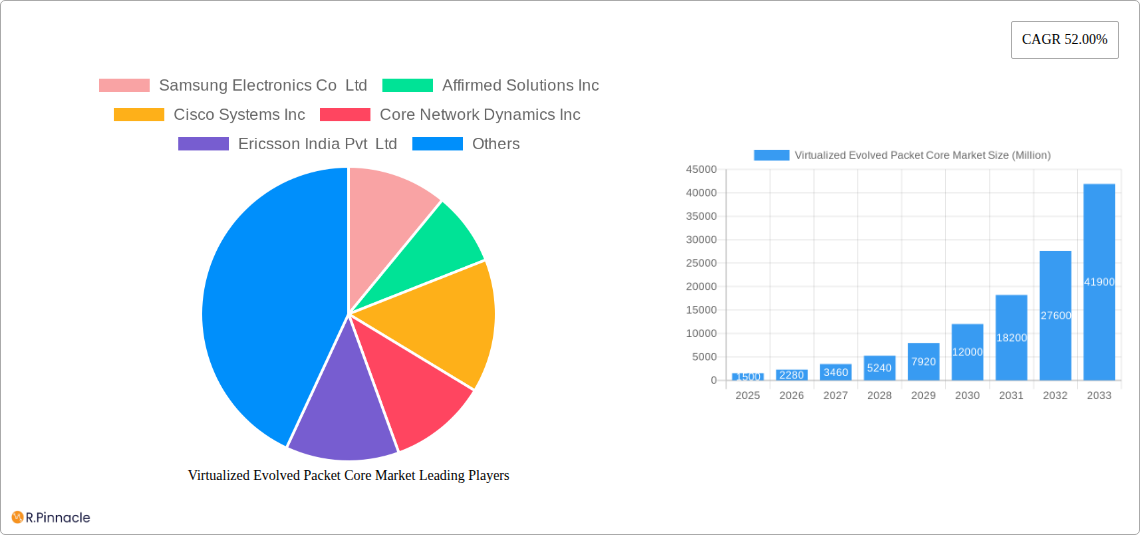
This in-depth report provides a comprehensive analysis of the Virtualized Evolved Packet Core (vEPC) market, offering invaluable insights for industry professionals, investors, and strategic decision-makers. Covering the period from 2019 to 2033, with a base year of 2025 and a forecast period of 2025-2033, this report meticulously examines market dynamics, technological advancements, competitive landscapes, and future growth prospects. The study encompasses detailed segmentations by deployment mode (cloud-based and on-premise) and application (IoT & M2M, MPN & MVNO, BWA, LTE, VoLTE & VoWiFi). Key players like Samsung Electronics Co Ltd, Affirmed Solutions Inc, Cisco Systems Inc, Core Network Dynamics Inc, Ericsson India Pvt Ltd, NEC Corporation, Athonet Srl, Mavenir Inc, Huawei Technologies Co Ltd, ZTE Corporation, Nokia Corporation, and Telad Networks Ltd are profiled, providing a holistic view of the market.
Virtualized Evolved Packet Core Market Market Structure & Innovation Trends
This section analyzes the competitive landscape of the vEPC market, examining market concentration, innovation drivers, regulatory frameworks, and M&A activities. The report quantifies market share held by key players and evaluates the impact of mergers and acquisitions on market structure. The study delves into the influence of technological advancements, such as 5G and edge computing, on market innovation. Regulatory landscapes across various regions and their impact on market growth are also assessed. The analysis includes:
- Market Concentration: A detailed breakdown of market share among leading vendors, revealing the level of competition and dominance within the sector. For example, a projected xx% market share for Samsung Electronics Co Ltd in 2025.
- Innovation Drivers: Analysis of factors driving innovation, including technological advancements (e.g., network slicing, AI), evolving consumer demands, and regulatory pressures.
- Regulatory Frameworks: Evaluation of regional regulatory influences on vEPC deployment and market expansion.
- Product Substitutes: Assessment of alternative technologies that might pose a threat to vEPC market growth.
- End-User Demographics: Identification of key end-user segments driving market demand (e.g., telecom operators, enterprises).
- M&A Activities: Review of significant mergers and acquisitions within the vEPC market, along with an evaluation of their impact on the competitive landscape. Estimated M&A deal values for the historical period are included, with a projected xx Million in deals for 2025.
Virtualized Evolved Packet Core Market Market Dynamics & Trends
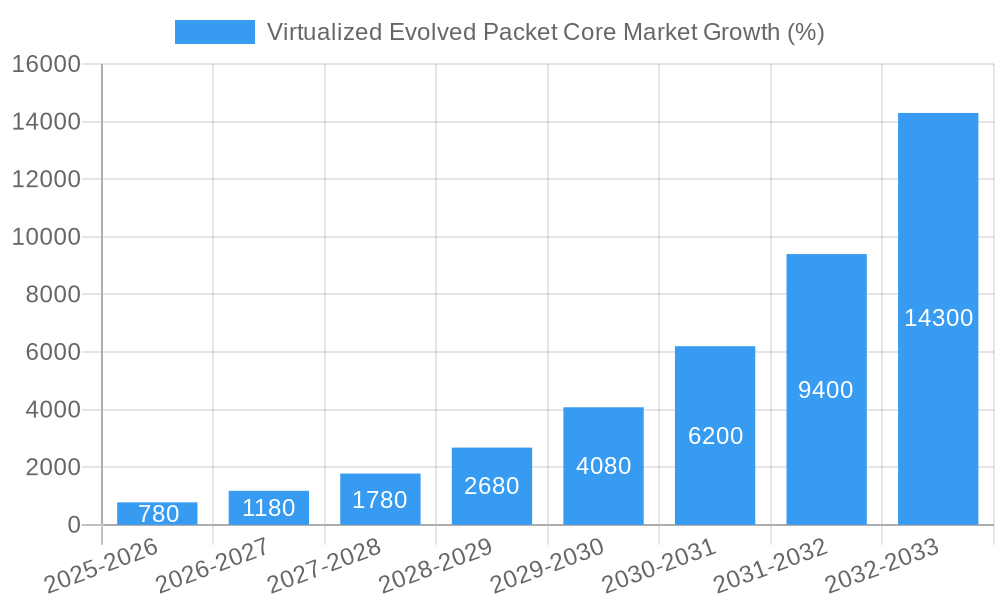
This section explores the key drivers and trends shaping the vEPC market's growth trajectory. The analysis examines factors influencing market expansion, including technological disruptions, consumer preferences, and competitive dynamics. Specific metrics such as CAGR and market penetration rates are provided for the forecast period. The report evaluates the impact of 5G rollout, the increasing adoption of cloud-native technologies, and the growing demand for improved network performance and scalability on market growth. Further, it analyzes how competition between established players and emerging companies shapes market dynamics. For instance, the report projects a CAGR of xx% for the vEPC market between 2025 and 2033, driven by increased adoption in specific regions and applications. The market penetration rate is projected to reach xx% by 2033.
Dominant Regions & Segments in Virtualized Evolved Packet Core Market
This section identifies the leading regions and segments within the vEPC market. The analysis provides a detailed examination of the drivers behind market dominance in each region and segment (cloud-based vs. on-premise deployment, and different application segments).
By Deployment Mode:
- Cloud-based: Key drivers include cost efficiency, scalability, and agility. The report will analyze the regional variations in cloud adoption for vEPC.
- On-premise: Key drivers include enhanced security and control. The analysis will delve into the factors limiting on-premise deployment in certain regions.
By Application:
- IoT & M2M: Growth drivers include the expanding IoT ecosystem and demand for reliable connectivity. The report will explore the specific needs of this segment.
- MPN & MVNO: Drivers include the need for cost-effective network infrastructure and faster time-to-market. The analysis will detail the regional variations in this market.
- BWA: Analysis of factors driving the adoption of BWA within vEPC deployments.
- LTE: Analysis of the continuing role of LTE within the vEPC market and its integration with 5G.
- VoLTE & VoWiFi: Drivers include improved voice quality and coverage, as well as the ongoing transition to IP-based communication.
The report provides a detailed regional analysis highlighting the dominant regions based on market size, growth rate, and driving factors. For example, North America is projected to hold a significant market share due to factors like early 5G adoption and robust technological infrastructure.
Virtualized Evolved Packet Core Market Product Innovations
This section summarizes recent product developments and innovations in the vEPC market. The report highlights key technological advancements such as network slicing, AI-powered network optimization, and the integration of edge computing. The analysis emphasizes how these innovations address specific market needs and provide competitive advantages to vendors. For example, the introduction of software-defined networking (SDN) and network function virtualization (NFV) are key innovations driving market growth.
Report Scope & Segmentation Analysis
This report comprehensively segments the vEPC market by deployment mode (cloud-based and on-premise) and application (IoT & M2M, MPN & MVNO, BWA, LTE, VoLTE & VoWiFi). Each segment's growth projections, market size, and competitive dynamics are analyzed, providing a clear understanding of the market's structure and future potential. The market sizes are presented for each segment for the base year (2025) and projected for the forecast period (2025-2033). Specific competitive analyses are provided for each segment, highlighting key players and their strategies.
Key Drivers of Virtualized Evolved Packet Core Market Growth
The growth of the vEPC market is driven by several key factors. The increasing demand for high-speed, reliable mobile connectivity is a significant driver, fueled by the proliferation of mobile devices and the growth of data-intensive applications. The adoption of 5G technology is another key driver, as it requires vEPC for efficient network management. Furthermore, the transition towards cloud-native architectures and the benefits of virtualization, including cost optimization and scalability, are significantly driving market growth. Finally, supportive government policies and regulatory frameworks in several regions are also contributing to market expansion.
Challenges in the Virtualized Evolved Packet Core Market Sector
The vEPC market faces several challenges. The high initial investment costs associated with implementing vEPC infrastructure can be a barrier for some operators. Integration complexities and the need for skilled professionals to manage and maintain vEPC systems pose operational challenges. Security concerns, particularly related to data breaches and cyberattacks, are also significant hurdles. Finally, competition among established and emerging vendors can lead to price pressures and affect profitability.
Emerging Opportunities in Virtualized Evolved Packet Core Market
Despite the challenges, the vEPC market presents several opportunities. The growing demand for private 5G networks in various industries (e.g., manufacturing, healthcare) offers significant potential. The increasing integration of AI and machine learning in vEPC systems for network optimization and automation presents new opportunities for innovation. Furthermore, the expanding adoption of edge computing and the development of new applications and services based on 5G technology are expected to create significant growth avenues.
Leading Players in the Virtualized Evolved Packet Core Market Market
- Samsung Electronics Co Ltd
- Affirmed Solutions Inc
- Cisco Systems Inc
- Core Network Dynamics Inc
- Ericsson India Pvt Ltd
- NEC Corporation
- Athonet Srl
- Mavenir Inc
- Huawei Technologies Co Ltd
- ZTE Corporation
- Nokia Corporation
- Telad Networks Ltd
Key Developments in Virtualized Evolved Packet Core Market Industry
- January 2023: Company X launched a new vEPC solution with integrated AI capabilities.
- June 2022: Company Y and Company Z announced a strategic partnership to accelerate vEPC deployment in the Asia-Pacific region.
- October 2021: Company A acquired Company B, expanding its vEPC product portfolio.
- (Further key developments with dates and descriptions will be included in the full report.)
Future Outlook for Virtualized Evolved Packet Core Market Market
The future outlook for the vEPC market is positive, driven by the continued expansion of 5G networks, the increasing demand for private networks, and the advancements in virtualization technologies. The market is expected to experience significant growth in the coming years, with substantial opportunities for innovation and expansion into new markets. Strategic partnerships, technological advancements, and proactive regulatory frameworks will further shape the market's future trajectory. The market is projected to reach xx Million by 2033.
Virtualized Evolved Packet Core Market Segmentation
-
1. Deployment Mode
- 1.1. Cloud-based
- 1.2. On-premise
-
2. Application
- 2.1. IoT & M2M
- 2.2. MPN & MVNO
- 2.3. BWA
- 2.4. LTE, Volte & VoWiFi
Virtualized Evolved Packet Core Market Segmentation By Geography
- 1. North America
- 2. Europe
- 3. Asia Pacific
- 4. Latin America
- 5. Middle East
Virtualized Evolved Packet Core Market REPORT HIGHLIGHTS
| Aspects | Details |
|---|---|
| Study Period | 2019-2033 |
| Base Year | 2024 |
| Estimated Year | 2025 |
| Forecast Period | 2025-2033 |
| Historical Period | 2019-2024 |
| Growth Rate | CAGR of 52.00% from 2019-2033 |
| Segmentation |
|
Table of Contents
- 1. Introduction
- 1.1. Research Scope
- 1.2. Market Segmentation
- 1.3. Research Methodology
- 1.4. Definitions and Assumptions
- 2. Executive Summary
- 2.1. Introduction
- 3. Market Dynamics
- 3.1. Introduction
- 3.2. Market Drivers
- 3.2.1. ; Increasing Number of Mobile LTE Subscribers; Development of 5G Infrastructure
- 3.3. Market Restrains
- 3.3.1. ; Reluctance in Transiting From Legacy Infrastructure to Virtualization
- 3.4. Market Trends
- 3.4.1. IoT & M2M Expected to Have Significant Growth
- 4. Market Factor Analysis
- 4.1. Porters Five Forces
- 4.2. Supply/Value Chain
- 4.3. PESTEL analysis
- 4.4. Market Entropy
- 4.5. Patent/Trademark Analysis
- 5. Global Virtualized Evolved Packet Core Market Analysis, Insights and Forecast, 2019-2031
- 5.1. Market Analysis, Insights and Forecast - by Deployment Mode
- 5.1.1. Cloud-based
- 5.1.2. On-premise
- 5.2. Market Analysis, Insights and Forecast - by Application
- 5.2.1. IoT & M2M
- 5.2.2. MPN & MVNO
- 5.2.3. BWA
- 5.2.4. LTE, Volte & VoWiFi
- 5.3. Market Analysis, Insights and Forecast - by Region
- 5.3.1. North America
- 5.3.2. Europe
- 5.3.3. Asia Pacific
- 5.3.4. Latin America
- 5.3.5. Middle East
- 5.1. Market Analysis, Insights and Forecast - by Deployment Mode
- 6. North America Virtualized Evolved Packet Core Market Analysis, Insights and Forecast, 2019-2031
- 6.1. Market Analysis, Insights and Forecast - by Deployment Mode
- 6.1.1. Cloud-based
- 6.1.2. On-premise
- 6.2. Market Analysis, Insights and Forecast - by Application
- 6.2.1. IoT & M2M
- 6.2.2. MPN & MVNO
- 6.2.3. BWA
- 6.2.4. LTE, Volte & VoWiFi
- 6.1. Market Analysis, Insights and Forecast - by Deployment Mode
- 7. Europe Virtualized Evolved Packet Core Market Analysis, Insights and Forecast, 2019-2031
- 7.1. Market Analysis, Insights and Forecast - by Deployment Mode
- 7.1.1. Cloud-based
- 7.1.2. On-premise
- 7.2. Market Analysis, Insights and Forecast - by Application
- 7.2.1. IoT & M2M
- 7.2.2. MPN & MVNO
- 7.2.3. BWA
- 7.2.4. LTE, Volte & VoWiFi
- 7.1. Market Analysis, Insights and Forecast - by Deployment Mode
- 8. Asia Pacific Virtualized Evolved Packet Core Market Analysis, Insights and Forecast, 2019-2031
- 8.1. Market Analysis, Insights and Forecast - by Deployment Mode
- 8.1.1. Cloud-based
- 8.1.2. On-premise
- 8.2. Market Analysis, Insights and Forecast - by Application
- 8.2.1. IoT & M2M
- 8.2.2. MPN & MVNO
- 8.2.3. BWA
- 8.2.4. LTE, Volte & VoWiFi
- 8.1. Market Analysis, Insights and Forecast - by Deployment Mode
- 9. Latin America Virtualized Evolved Packet Core Market Analysis, Insights and Forecast, 2019-2031
- 9.1. Market Analysis, Insights and Forecast - by Deployment Mode
- 9.1.1. Cloud-based
- 9.1.2. On-premise
- 9.2. Market Analysis, Insights and Forecast - by Application
- 9.2.1. IoT & M2M
- 9.2.2. MPN & MVNO
- 9.2.3. BWA
- 9.2.4. LTE, Volte & VoWiFi
- 9.1. Market Analysis, Insights and Forecast - by Deployment Mode
- 10. Middle East Virtualized Evolved Packet Core Market Analysis, Insights and Forecast, 2019-2031
- 10.1. Market Analysis, Insights and Forecast - by Deployment Mode
- 10.1.1. Cloud-based
- 10.1.2. On-premise
- 10.2. Market Analysis, Insights and Forecast - by Application
- 10.2.1. IoT & M2M
- 10.2.2. MPN & MVNO
- 10.2.3. BWA
- 10.2.4. LTE, Volte & VoWiFi
- 10.1. Market Analysis, Insights and Forecast - by Deployment Mode
- 11. North America Virtualized Evolved Packet Core Market Analysis, Insights and Forecast, 2019-2031
- 11.1. Market Analysis, Insights and Forecast - By Country/Sub-region
- 11.1.1 United States
- 11.1.2 Canada
- 11.1.3 Mexico
- 12. Europe Virtualized Evolved Packet Core Market Analysis, Insights and Forecast, 2019-2031
- 12.1. Market Analysis, Insights and Forecast - By Country/Sub-region
- 12.1.1 Germany
- 12.1.2 United Kingdom
- 12.1.3 France
- 12.1.4 Spain
- 12.1.5 Italy
- 12.1.6 Spain
- 12.1.7 Belgium
- 12.1.8 Netherland
- 12.1.9 Nordics
- 12.1.10 Rest of Europe
- 13. Asia Pacific Virtualized Evolved Packet Core Market Analysis, Insights and Forecast, 2019-2031
- 13.1. Market Analysis, Insights and Forecast - By Country/Sub-region
- 13.1.1 China
- 13.1.2 Japan
- 13.1.3 India
- 13.1.4 South Korea
- 13.1.5 Southeast Asia
- 13.1.6 Australia
- 13.1.7 Indonesia
- 13.1.8 Phillipes
- 13.1.9 Singapore
- 13.1.10 Thailandc
- 13.1.11 Rest of Asia Pacific
- 14. South America Virtualized Evolved Packet Core Market Analysis, Insights and Forecast, 2019-2031
- 14.1. Market Analysis, Insights and Forecast - By Country/Sub-region
- 14.1.1 Brazil
- 14.1.2 Argentina
- 14.1.3 Peru
- 14.1.4 Chile
- 14.1.5 Colombia
- 14.1.6 Ecuador
- 14.1.7 Venezuela
- 14.1.8 Rest of South America
- 15. North America Virtualized Evolved Packet Core Market Analysis, Insights and Forecast, 2019-2031
- 15.1. Market Analysis, Insights and Forecast - By Country/Sub-region
- 15.1.1 United States
- 15.1.2 Canada
- 15.1.3 Mexico
- 16. MEA Virtualized Evolved Packet Core Market Analysis, Insights and Forecast, 2019-2031
- 16.1. Market Analysis, Insights and Forecast - By Country/Sub-region
- 16.1.1 United Arab Emirates
- 16.1.2 Saudi Arabia
- 16.1.3 South Africa
- 16.1.4 Rest of Middle East and Africa
- 17. Competitive Analysis
- 17.1. Global Market Share Analysis 2024
- 17.2. Company Profiles
- 17.2.1 Samsung Electronics Co Ltd
- 17.2.1.1. Overview
- 17.2.1.2. Products
- 17.2.1.3. SWOT Analysis
- 17.2.1.4. Recent Developments
- 17.2.1.5. Financials (Based on Availability)
- 17.2.2 Affirmed Solutions Inc
- 17.2.2.1. Overview
- 17.2.2.2. Products
- 17.2.2.3. SWOT Analysis
- 17.2.2.4. Recent Developments
- 17.2.2.5. Financials (Based on Availability)
- 17.2.3 Cisco Systems Inc
- 17.2.3.1. Overview
- 17.2.3.2. Products
- 17.2.3.3. SWOT Analysis
- 17.2.3.4. Recent Developments
- 17.2.3.5. Financials (Based on Availability)
- 17.2.4 Core Network Dynamics Inc
- 17.2.4.1. Overview
- 17.2.4.2. Products
- 17.2.4.3. SWOT Analysis
- 17.2.4.4. Recent Developments
- 17.2.4.5. Financials (Based on Availability)
- 17.2.5 Ericsson India Pvt Ltd
- 17.2.5.1. Overview
- 17.2.5.2. Products
- 17.2.5.3. SWOT Analysis
- 17.2.5.4. Recent Developments
- 17.2.5.5. Financials (Based on Availability)
- 17.2.6 NEC Corporation
- 17.2.6.1. Overview
- 17.2.6.2. Products
- 17.2.6.3. SWOT Analysis
- 17.2.6.4. Recent Developments
- 17.2.6.5. Financials (Based on Availability)
- 17.2.7 Athonet Srl
- 17.2.7.1. Overview
- 17.2.7.2. Products
- 17.2.7.3. SWOT Analysis
- 17.2.7.4. Recent Developments
- 17.2.7.5. Financials (Based on Availability)
- 17.2.8 Mavenir Inc
- 17.2.8.1. Overview
- 17.2.8.2. Products
- 17.2.8.3. SWOT Analysis
- 17.2.8.4. Recent Developments
- 17.2.8.5. Financials (Based on Availability)
- 17.2.9 Huawei Technologies Co Ltd
- 17.2.9.1. Overview
- 17.2.9.2. Products
- 17.2.9.3. SWOT Analysis
- 17.2.9.4. Recent Developments
- 17.2.9.5. Financials (Based on Availability)
- 17.2.10 ZTE Corporation
- 17.2.10.1. Overview
- 17.2.10.2. Products
- 17.2.10.3. SWOT Analysis
- 17.2.10.4. Recent Developments
- 17.2.10.5. Financials (Based on Availability)
- 17.2.11 Nokia Corporation
- 17.2.11.1. Overview
- 17.2.11.2. Products
- 17.2.11.3. SWOT Analysis
- 17.2.11.4. Recent Developments
- 17.2.11.5. Financials (Based on Availability)
- 17.2.12 Telad Networks Ltd
- 17.2.12.1. Overview
- 17.2.12.2. Products
- 17.2.12.3. SWOT Analysis
- 17.2.12.4. Recent Developments
- 17.2.12.5. Financials (Based on Availability)
- 17.2.1 Samsung Electronics Co Ltd
List of Figures
- Figure 1: Global Virtualized Evolved Packet Core Market Revenue Breakdown (Million, %) by Region 2024 & 2032
- Figure 2: North America Virtualized Evolved Packet Core Market Revenue (Million), by Country 2024 & 2032
- Figure 3: North America Virtualized Evolved Packet Core Market Revenue Share (%), by Country 2024 & 2032
- Figure 4: Europe Virtualized Evolved Packet Core Market Revenue (Million), by Country 2024 & 2032
- Figure 5: Europe Virtualized Evolved Packet Core Market Revenue Share (%), by Country 2024 & 2032
- Figure 6: Asia Pacific Virtualized Evolved Packet Core Market Revenue (Million), by Country 2024 & 2032
- Figure 7: Asia Pacific Virtualized Evolved Packet Core Market Revenue Share (%), by Country 2024 & 2032
- Figure 8: South America Virtualized Evolved Packet Core Market Revenue (Million), by Country 2024 & 2032
- Figure 9: South America Virtualized Evolved Packet Core Market Revenue Share (%), by Country 2024 & 2032
- Figure 10: North America Virtualized Evolved Packet Core Market Revenue (Million), by Country 2024 & 2032
- Figure 11: North America Virtualized Evolved Packet Core Market Revenue Share (%), by Country 2024 & 2032
- Figure 12: MEA Virtualized Evolved Packet Core Market Revenue (Million), by Country 2024 & 2032
- Figure 13: MEA Virtualized Evolved Packet Core Market Revenue Share (%), by Country 2024 & 2032
- Figure 14: North America Virtualized Evolved Packet Core Market Revenue (Million), by Deployment Mode 2024 & 2032
- Figure 15: North America Virtualized Evolved Packet Core Market Revenue Share (%), by Deployment Mode 2024 & 2032
- Figure 16: North America Virtualized Evolved Packet Core Market Revenue (Million), by Application 2024 & 2032
- Figure 17: North America Virtualized Evolved Packet Core Market Revenue Share (%), by Application 2024 & 2032
- Figure 18: North America Virtualized Evolved Packet Core Market Revenue (Million), by Country 2024 & 2032
- Figure 19: North America Virtualized Evolved Packet Core Market Revenue Share (%), by Country 2024 & 2032
- Figure 20: Europe Virtualized Evolved Packet Core Market Revenue (Million), by Deployment Mode 2024 & 2032
- Figure 21: Europe Virtualized Evolved Packet Core Market Revenue Share (%), by Deployment Mode 2024 & 2032
- Figure 22: Europe Virtualized Evolved Packet Core Market Revenue (Million), by Application 2024 & 2032
- Figure 23: Europe Virtualized Evolved Packet Core Market Revenue Share (%), by Application 2024 & 2032
- Figure 24: Europe Virtualized Evolved Packet Core Market Revenue (Million), by Country 2024 & 2032
- Figure 25: Europe Virtualized Evolved Packet Core Market Revenue Share (%), by Country 2024 & 2032
- Figure 26: Asia Pacific Virtualized Evolved Packet Core Market Revenue (Million), by Deployment Mode 2024 & 2032
- Figure 27: Asia Pacific Virtualized Evolved Packet Core Market Revenue Share (%), by Deployment Mode 2024 & 2032
- Figure 28: Asia Pacific Virtualized Evolved Packet Core Market Revenue (Million), by Application 2024 & 2032
- Figure 29: Asia Pacific Virtualized Evolved Packet Core Market Revenue Share (%), by Application 2024 & 2032
- Figure 30: Asia Pacific Virtualized Evolved Packet Core Market Revenue (Million), by Country 2024 & 2032
- Figure 31: Asia Pacific Virtualized Evolved Packet Core Market Revenue Share (%), by Country 2024 & 2032
- Figure 32: Latin America Virtualized Evolved Packet Core Market Revenue (Million), by Deployment Mode 2024 & 2032
- Figure 33: Latin America Virtualized Evolved Packet Core Market Revenue Share (%), by Deployment Mode 2024 & 2032
- Figure 34: Latin America Virtualized Evolved Packet Core Market Revenue (Million), by Application 2024 & 2032
- Figure 35: Latin America Virtualized Evolved Packet Core Market Revenue Share (%), by Application 2024 & 2032
- Figure 36: Latin America Virtualized Evolved Packet Core Market Revenue (Million), by Country 2024 & 2032
- Figure 37: Latin America Virtualized Evolved Packet Core Market Revenue Share (%), by Country 2024 & 2032
- Figure 38: Middle East Virtualized Evolved Packet Core Market Revenue (Million), by Deployment Mode 2024 & 2032
- Figure 39: Middle East Virtualized Evolved Packet Core Market Revenue Share (%), by Deployment Mode 2024 & 2032
- Figure 40: Middle East Virtualized Evolved Packet Core Market Revenue (Million), by Application 2024 & 2032
- Figure 41: Middle East Virtualized Evolved Packet Core Market Revenue Share (%), by Application 2024 & 2032
- Figure 42: Middle East Virtualized Evolved Packet Core Market Revenue (Million), by Country 2024 & 2032
- Figure 43: Middle East Virtualized Evolved Packet Core Market Revenue Share (%), by Country 2024 & 2032
List of Tables
- Table 1: Global Virtualized Evolved Packet Core Market Revenue Million Forecast, by Region 2019 & 2032
- Table 2: Global Virtualized Evolved Packet Core Market Revenue Million Forecast, by Deployment Mode 2019 & 2032
- Table 3: Global Virtualized Evolved Packet Core Market Revenue Million Forecast, by Application 2019 & 2032
- Table 4: Global Virtualized Evolved Packet Core Market Revenue Million Forecast, by Region 2019 & 2032
- Table 5: Global Virtualized Evolved Packet Core Market Revenue Million Forecast, by Country 2019 & 2032
- Table 6: United States Virtualized Evolved Packet Core Market Revenue (Million) Forecast, by Application 2019 & 2032
- Table 7: Canada Virtualized Evolved Packet Core Market Revenue (Million) Forecast, by Application 2019 & 2032
- Table 8: Mexico Virtualized Evolved Packet Core Market Revenue (Million) Forecast, by Application 2019 & 2032
- Table 9: Global Virtualized Evolved Packet Core Market Revenue Million Forecast, by Country 2019 & 2032
- Table 10: Germany Virtualized Evolved Packet Core Market Revenue (Million) Forecast, by Application 2019 & 2032
- Table 11: United Kingdom Virtualized Evolved Packet Core Market Revenue (Million) Forecast, by Application 2019 & 2032
- Table 12: France Virtualized Evolved Packet Core Market Revenue (Million) Forecast, by Application 2019 & 2032
- Table 13: Spain Virtualized Evolved Packet Core Market Revenue (Million) Forecast, by Application 2019 & 2032
- Table 14: Italy Virtualized Evolved Packet Core Market Revenue (Million) Forecast, by Application 2019 & 2032
- Table 15: Spain Virtualized Evolved Packet Core Market Revenue (Million) Forecast, by Application 2019 & 2032
- Table 16: Belgium Virtualized Evolved Packet Core Market Revenue (Million) Forecast, by Application 2019 & 2032
- Table 17: Netherland Virtualized Evolved Packet Core Market Revenue (Million) Forecast, by Application 2019 & 2032
- Table 18: Nordics Virtualized Evolved Packet Core Market Revenue (Million) Forecast, by Application 2019 & 2032
- Table 19: Rest of Europe Virtualized Evolved Packet Core Market Revenue (Million) Forecast, by Application 2019 & 2032
- Table 20: Global Virtualized Evolved Packet Core Market Revenue Million Forecast, by Country 2019 & 2032
- Table 21: China Virtualized Evolved Packet Core Market Revenue (Million) Forecast, by Application 2019 & 2032
- Table 22: Japan Virtualized Evolved Packet Core Market Revenue (Million) Forecast, by Application 2019 & 2032
- Table 23: India Virtualized Evolved Packet Core Market Revenue (Million) Forecast, by Application 2019 & 2032
- Table 24: South Korea Virtualized Evolved Packet Core Market Revenue (Million) Forecast, by Application 2019 & 2032
- Table 25: Southeast Asia Virtualized Evolved Packet Core Market Revenue (Million) Forecast, by Application 2019 & 2032
- Table 26: Australia Virtualized Evolved Packet Core Market Revenue (Million) Forecast, by Application 2019 & 2032
- Table 27: Indonesia Virtualized Evolved Packet Core Market Revenue (Million) Forecast, by Application 2019 & 2032
- Table 28: Phillipes Virtualized Evolved Packet Core Market Revenue (Million) Forecast, by Application 2019 & 2032
- Table 29: Singapore Virtualized Evolved Packet Core Market Revenue (Million) Forecast, by Application 2019 & 2032
- Table 30: Thailandc Virtualized Evolved Packet Core Market Revenue (Million) Forecast, by Application 2019 & 2032
- Table 31: Rest of Asia Pacific Virtualized Evolved Packet Core Market Revenue (Million) Forecast, by Application 2019 & 2032
- Table 32: Global Virtualized Evolved Packet Core Market Revenue Million Forecast, by Country 2019 & 2032
- Table 33: Brazil Virtualized Evolved Packet Core Market Revenue (Million) Forecast, by Application 2019 & 2032
- Table 34: Argentina Virtualized Evolved Packet Core Market Revenue (Million) Forecast, by Application 2019 & 2032
- Table 35: Peru Virtualized Evolved Packet Core Market Revenue (Million) Forecast, by Application 2019 & 2032
- Table 36: Chile Virtualized Evolved Packet Core Market Revenue (Million) Forecast, by Application 2019 & 2032
- Table 37: Colombia Virtualized Evolved Packet Core Market Revenue (Million) Forecast, by Application 2019 & 2032
- Table 38: Ecuador Virtualized Evolved Packet Core Market Revenue (Million) Forecast, by Application 2019 & 2032
- Table 39: Venezuela Virtualized Evolved Packet Core Market Revenue (Million) Forecast, by Application 2019 & 2032
- Table 40: Rest of South America Virtualized Evolved Packet Core Market Revenue (Million) Forecast, by Application 2019 & 2032
- Table 41: Global Virtualized Evolved Packet Core Market Revenue Million Forecast, by Country 2019 & 2032
- Table 42: United States Virtualized Evolved Packet Core Market Revenue (Million) Forecast, by Application 2019 & 2032
- Table 43: Canada Virtualized Evolved Packet Core Market Revenue (Million) Forecast, by Application 2019 & 2032
- Table 44: Mexico Virtualized Evolved Packet Core Market Revenue (Million) Forecast, by Application 2019 & 2032
- Table 45: Global Virtualized Evolved Packet Core Market Revenue Million Forecast, by Country 2019 & 2032
- Table 46: United Arab Emirates Virtualized Evolved Packet Core Market Revenue (Million) Forecast, by Application 2019 & 2032
- Table 47: Saudi Arabia Virtualized Evolved Packet Core Market Revenue (Million) Forecast, by Application 2019 & 2032
- Table 48: South Africa Virtualized Evolved Packet Core Market Revenue (Million) Forecast, by Application 2019 & 2032
- Table 49: Rest of Middle East and Africa Virtualized Evolved Packet Core Market Revenue (Million) Forecast, by Application 2019 & 2032
- Table 50: Global Virtualized Evolved Packet Core Market Revenue Million Forecast, by Deployment Mode 2019 & 2032
- Table 51: Global Virtualized Evolved Packet Core Market Revenue Million Forecast, by Application 2019 & 2032
- Table 52: Global Virtualized Evolved Packet Core Market Revenue Million Forecast, by Country 2019 & 2032
- Table 53: Global Virtualized Evolved Packet Core Market Revenue Million Forecast, by Deployment Mode 2019 & 2032
- Table 54: Global Virtualized Evolved Packet Core Market Revenue Million Forecast, by Application 2019 & 2032
- Table 55: Global Virtualized Evolved Packet Core Market Revenue Million Forecast, by Country 2019 & 2032
- Table 56: Global Virtualized Evolved Packet Core Market Revenue Million Forecast, by Deployment Mode 2019 & 2032
- Table 57: Global Virtualized Evolved Packet Core Market Revenue Million Forecast, by Application 2019 & 2032
- Table 58: Global Virtualized Evolved Packet Core Market Revenue Million Forecast, by Country 2019 & 2032
- Table 59: Global Virtualized Evolved Packet Core Market Revenue Million Forecast, by Deployment Mode 2019 & 2032
- Table 60: Global Virtualized Evolved Packet Core Market Revenue Million Forecast, by Application 2019 & 2032
- Table 61: Global Virtualized Evolved Packet Core Market Revenue Million Forecast, by Country 2019 & 2032
- Table 62: Global Virtualized Evolved Packet Core Market Revenue Million Forecast, by Deployment Mode 2019 & 2032
- Table 63: Global Virtualized Evolved Packet Core Market Revenue Million Forecast, by Application 2019 & 2032
- Table 64: Global Virtualized Evolved Packet Core Market Revenue Million Forecast, by Country 2019 & 2032
Frequently Asked Questions
1. What is the projected Compound Annual Growth Rate (CAGR) of the Virtualized Evolved Packet Core Market?
The projected CAGR is approximately 52.00%.
2. Which companies are prominent players in the Virtualized Evolved Packet Core Market?
Key companies in the market include Samsung Electronics Co Ltd, Affirmed Solutions Inc, Cisco Systems Inc, Core Network Dynamics Inc , Ericsson India Pvt Ltd, NEC Corporation, Athonet Srl, Mavenir Inc, Huawei Technologies Co Ltd, ZTE Corporation, Nokia Corporation, Telad Networks Ltd.
3. What are the main segments of the Virtualized Evolved Packet Core Market?
The market segments include Deployment Mode, Application.
4. Can you provide details about the market size?
The market size is estimated to be USD XX Million as of 2022.
5. What are some drivers contributing to market growth?
; Increasing Number of Mobile LTE Subscribers; Development of 5G Infrastructure.
6. What are the notable trends driving market growth?
IoT & M2M Expected to Have Significant Growth.
7. Are there any restraints impacting market growth?
; Reluctance in Transiting From Legacy Infrastructure to Virtualization.
8. Can you provide examples of recent developments in the market?
N/A
9. What pricing options are available for accessing the report?
Pricing options include single-user, multi-user, and enterprise licenses priced at USD 4750, USD 5250, and USD 8750 respectively.
10. Is the market size provided in terms of value or volume?
The market size is provided in terms of value, measured in Million.
11. Are there any specific market keywords associated with the report?
Yes, the market keyword associated with the report is "Virtualized Evolved Packet Core Market," which aids in identifying and referencing the specific market segment covered.
12. How do I determine which pricing option suits my needs best?
The pricing options vary based on user requirements and access needs. Individual users may opt for single-user licenses, while businesses requiring broader access may choose multi-user or enterprise licenses for cost-effective access to the report.
13. Are there any additional resources or data provided in the Virtualized Evolved Packet Core Market report?
While the report offers comprehensive insights, it's advisable to review the specific contents or supplementary materials provided to ascertain if additional resources or data are available.
14. How can I stay updated on further developments or reports in the Virtualized Evolved Packet Core Market?
To stay informed about further developments, trends, and reports in the Virtualized Evolved Packet Core Market, consider subscribing to industry newsletters, following relevant companies and organizations, or regularly checking reputable industry news sources and publications.
Methodology
Step 1 - Identification of Relevant Samples Size from Population Database


Step 2 - Approaches for Defining Global Market Size (Value, Volume* & Price*)

Note*: In applicable scenarios
Step 3 - Data Sources
Primary Research
- Web Analytics
- Survey Reports
- Research Institute
- Latest Research Reports
- Opinion Leaders
Secondary Research
- Annual Reports
- White Paper
- Latest Press Release
- Industry Association
- Paid Database
- Investor Presentations

Step 4 - Data Triangulation
Involves using different sources of information in order to increase the validity of a study
These sources are likely to be stakeholders in a program - participants, other researchers, program staff, other community members, and so on.
Then we put all data in single framework & apply various statistical tools to find out the dynamic on the market.
During the analysis stage, feedback from the stakeholder groups would be compared to determine areas of agreement as well as areas of divergence


