
Key Insights
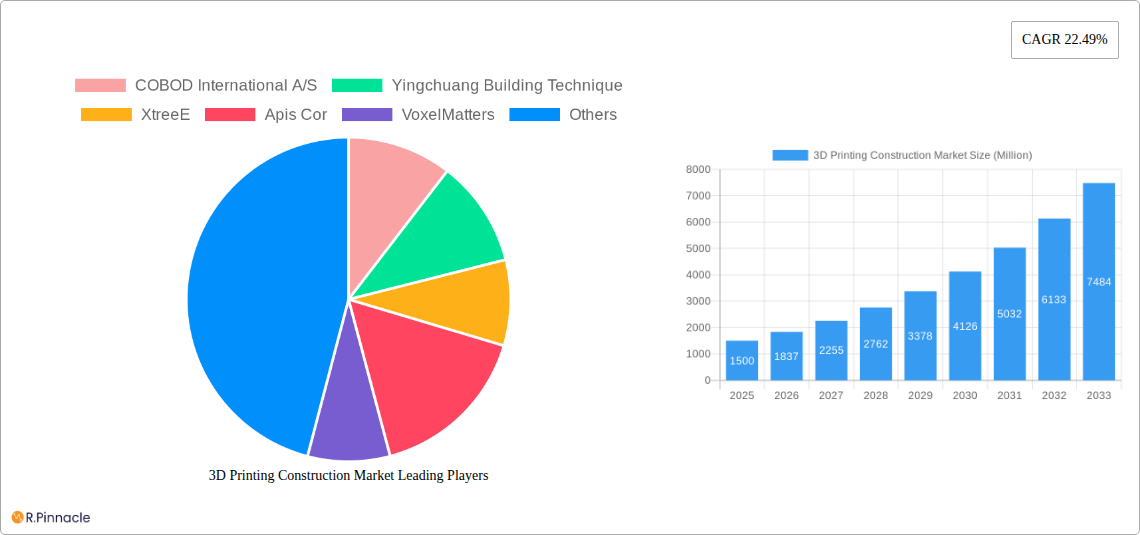
The 3D printing construction market is experiencing rapid growth, projected to reach a market size of $1.5 billion in 2025 and exhibiting a Compound Annual Growth Rate (CAGR) of 22.49% from 2025 to 2033. This expansion is driven by several key factors. Firstly, increasing demand for faster construction timelines and reduced labor costs is fueling adoption. 3D printing offers significant advantages in speed and efficiency compared to traditional methods, minimizing construction time and labor expenses. Secondly, the ability to create complex and customized designs with 3D printing is attracting architects and builders seeking unique and innovative structural solutions. This allows for the creation of intricate building designs previously impossible with conventional techniques, opening up new possibilities in architectural design and construction. Finally, advancements in 3D printing technology, including the development of new materials and printing processes, are further enhancing the capabilities and applications of this technology within the construction sector. This technological progress is constantly improving the efficiency, precision, and sustainability of 3D-printed structures.
Despite the significant growth potential, several challenges remain. High initial investment costs associated with 3D printing equipment and skilled labor can act as a barrier to entry for smaller construction companies. Furthermore, regulatory hurdles and building codes that are not yet fully adapted to 3D printed structures pose obstacles to widespread adoption. However, as technology matures and regulations evolve, these constraints are likely to ease, further fueling market expansion. The leading companies in this space, including COBOD International A/S, Yingchuang Building Technique, and XtreeE, are actively driving innovation and market penetration, shaping the future of construction. The market is segmented by various factors including material type, technology, application, and region, which will contribute to its varied growth trajectory across geographical locations over the forecast period.
3D Printing Construction Market Report: 2019-2033
This comprehensive report provides a detailed analysis of the 3D printing construction market, offering invaluable insights for industry professionals, investors, and researchers. Covering the period from 2019 to 2033, with a focus on 2025, this report meticulously examines market dynamics, technological advancements, key players, and future growth potential. Expect in-depth analysis of market size, segmentation, competitive landscape, and emerging trends, supported by robust data and forecasting.
3D Printing Construction Market Structure & Innovation Trends
The 3D printing construction market is characterized by a moderately concentrated structure with several key players vying for market share. While the market is still relatively nascent, the presence of established construction materials companies like Holcim and Sika, alongside specialized 3D printing firms like COBOD International A/S, Yingchuang Building Technique, and XtreeE, indicates a dynamic competitive landscape. Market share data for 2025 suggests COBOD holds approximately xx% market share, followed by Yingchuang with xx%, and XtreeE with xx%. The remaining share is distributed amongst other players, including Apis Cor, VoxelMatters, Make3d in, AJAX Engineering, and RIC Technology.
Innovation is a primary driver of growth, fueled by advancements in printing materials, software, and robotic systems. Regulatory frameworks, while still evolving, are increasingly supportive of 3D printing technologies, particularly in areas focused on sustainable construction practices. Significant M&A activity is anticipated, with deal values projected to reach xx Million in 2025. Several key factors influence this market:
- High Market Concentration: A few large players dominate the market, signifying potential for consolidation.
- Innovation-driven Growth: Continuous advancements in printing technologies are propelling market expansion.
- Evolving Regulations: Government support for sustainable construction methods is fostering adoption.
- Product Substitutes: Traditional construction methods pose a competitive challenge.
- End-User Demographics: The focus on affordable housing and infrastructure projects drives demand.
- Strategic M&A: Mergers and acquisitions are expected to reshape the competitive landscape.
3D Printing Construction Market Dynamics & Trends
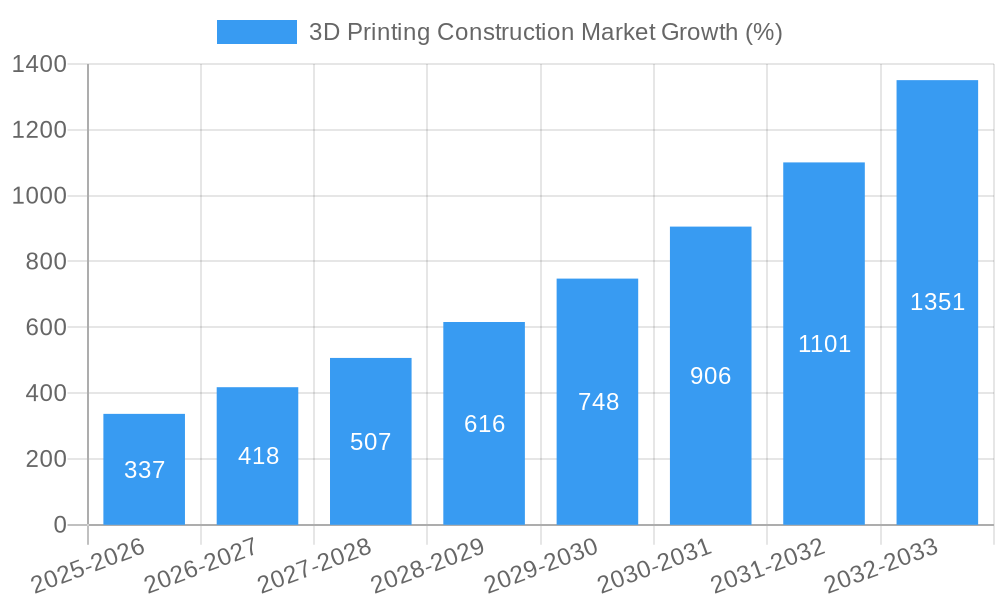
The 3D printing construction market is experiencing robust growth, projected to achieve a CAGR of xx% during the forecast period (2025-2033). Several key factors contribute to this expansion:
- Technological Disruptions: Advancements in materials science and robotic automation are significantly improving printing speed, accuracy, and material versatility. This increased efficiency is reducing construction times and lowering overall costs.
- Market Growth Drivers: The growing need for affordable and sustainable housing, coupled with rising infrastructure development projects globally, significantly fuels market demand. Furthermore, the ability of 3D printing to create complex geometries opens up possibilities for architectural innovation and personalized designs.
- Consumer Preferences: Increasing awareness of sustainable building practices and the desire for unique architectural designs are driving consumer preference for 3D-printed structures.
- Competitive Dynamics: The market is characterized by intense competition among established players and emerging startups, leading to continuous product innovation and price optimization. Market penetration is expected to reach xx% by 2033.
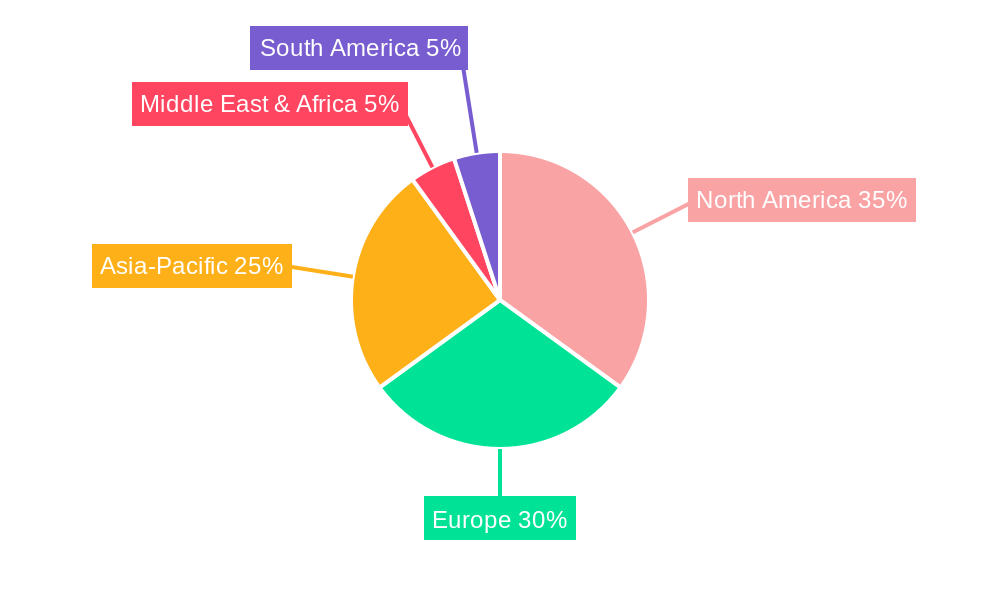
Dominant Regions & Segments in 3D Printing Construction Market
The North American region currently holds the largest market share, followed by Europe and Asia-Pacific. This dominance is largely attributed to several key factors:
North America:
- Stronger economic conditions enabling greater investment in advanced construction technologies.
- Developed infrastructure providing a supportive environment for innovation and adoption.
- High adoption rates of advanced technologies in the construction industry.
- Government support for sustainable construction initiatives.
Europe:
- Significant government funding for research and development in construction technologies.
- Focus on sustainability leading to increased demand for eco-friendly construction materials and methods.
- Presence of several key players driving competition and innovation.
Asia-Pacific: Rapid infrastructure development and urbanization are driving increasing demand. However, regulatory hurdles and lower adoption rates of advanced technologies currently limit market penetration compared to North America and Europe.
3D Printing Construction Market Product Innovations
Recent advancements focus on improving the speed and efficiency of 3D printing processes, expanding material options (including sustainable and low-carbon materials), and enhancing software capabilities for design and construction management. This includes the development of more robust and versatile robotic printing systems capable of handling complex geometries and larger-scale projects. Innovations in materials science are also yielding stronger, lighter, and more sustainable building components, improving the overall performance and environmental footprint of 3D-printed structures. This market shift caters to the growing demands for faster construction, sustainable practices, and cost-effectiveness within the construction industry.
Report Scope & Segmentation Analysis
This report segments the 3D printing construction market by various parameters, including:
By Technology: This segment analyzes the market based on the different 3D printing technologies used in construction (e.g., extrusion-based, binder jetting). Growth projections for each segment are based on technology advancements and market adoption. The extrusion-based segment is projected to dominate due to its cost-effectiveness and versatility.
By Material: This analysis includes concrete, polymers, and other emerging materials used in 3D construction printing. Growth projections for each material type are linked to their application and market demand. Concrete currently holds the largest share due to its widespread use in traditional construction.
By Application: This segment focuses on various applications such as residential, commercial, and infrastructure projects. Market size and growth projections for each application are evaluated according to industry needs and investment trends. Residential construction is expected to witness the most significant growth in the coming years.
By Region: This segment covers market analysis across different regions globally. Growth projections for each region are influenced by economic conditions, regulatory landscapes, and technology adoption.
Key Drivers of 3D Printing Construction Market Growth
Several factors are propelling the growth of the 3D printing construction market:
- Technological Advancements: Continuous improvements in printing technologies, materials, and software are enhancing efficiency, speed, and design flexibility.
- Cost Reduction: 3D printing offers the potential for significant cost savings compared to traditional construction methods.
- Sustainability: The use of sustainable materials and reduced waste generation contributes to environmentally friendly construction practices.
- Increased Efficiency: Faster construction times and reduced labor costs increase overall project efficiency.
- Design Flexibility: 3D printing allows for the creation of complex and customized designs that would be impossible with traditional methods.
Challenges in the 3D Printing Construction Market Sector
Despite the market's growth potential, several challenges persist:
- Regulatory Hurdles: The lack of standardized regulations and building codes for 3D-printed structures can hinder market adoption. Regulatory uncertainty adds to project risk, potentially delaying or even preventing project initiation.
- Supply Chain Issues: The availability of specialized 3D printing materials and equipment can pose a challenge, especially in regions with limited infrastructure.
- Competitive Pressure: The market is becoming increasingly competitive, with established construction companies and technology firms vying for market share. This competition pressures pricing and profit margins.
- Skilled Labor Shortages: The technology requires specialized training and expertise, creating a need for skilled labor which is currently in short supply.
Emerging Opportunities in 3D Printing Construction Market
Emerging opportunities abound in this rapidly evolving market:
- New Materials Development: The development of innovative, sustainable, and high-performance materials will further enhance the capabilities of 3D printing in construction.
- Integration with IoT: Integrating 3D printing with the Internet of Things (IoT) can enable remote monitoring and control of construction processes.
- Prefabrication and Modular Construction: 3D printing is ideally suited for creating prefabricated components and modules, improving efficiency and quality control.
- Expansion into Developing Markets: Significant opportunities exist in developing nations where there's a high demand for affordable housing and infrastructure.
Leading Players in the 3D Printing Construction Market Market
- COBOD International A/S
- Yingchuang Building Technique
- XtreeE
- Apis Cor
- VoxelMatters
- Make3d in
- AJAX Engineering
- RIC Technology
- Holcim
- Sika
Key Developments in 3D Printing Construction Market Industry
- July 2024: Tvasta Manufacturing Solutions launched Kerala's first Concrete 3D Printer Lab in collaboration with Saintgits College of Engineering, boosting research and innovation in 3D printing construction.
- March 2024: ICON unveiled a range of innovative products, including a multi-story robotic printer, a new low-carbon building material, and an AI Architect, significantly advancing automation and sustainability in large-scale 3D printing construction.
Future Outlook for 3D Printing Construction Market Market
The future of the 3D printing construction market is bright, with significant growth potential driven by technological advancements, increasing demand for sustainable building solutions, and ongoing infrastructure development globally. Strategic partnerships between technology providers and established construction companies will play a crucial role in accelerating market adoption. The integration of automation, AI, and advanced materials will further enhance the efficiency, speed, and sustainability of 3D printing in construction, leading to a more efficient and environmentally responsible built environment. The market is poised for significant expansion, particularly in developing economies and regions with a focus on sustainable development.
3D Printing Construction Market Segmentation
-
1. Method
- 1.1. Extrusion
- 1.2. Powder Bonding
- 1.3. Other Methods
-
2. Material Type
- 2.1. Concrete
- 2.2. Metal
- 2.3. Composite
-
3. End User Industry
- 3.1. Commercial
- 3.2. Residential
- 3.3. Industrial
3D Printing Construction Market Segmentation By Geography
- 1. North America
- 2. Europe
- 3. Asia
- 4. Australia and New Zealand
- 5. Latin America
- 6. Middle East and Africa
3D Printing Construction Market REPORT HIGHLIGHTS
| Aspects | Details |
|---|---|
| Study Period | 2019-2033 |
| Base Year | 2024 |
| Estimated Year | 2025 |
| Forecast Period | 2025-2033 |
| Historical Period | 2019-2024 |
| Growth Rate | CAGR of 22.49% from 2019-2033 |
| Segmentation |
|
Table of Contents
- 1. Introduction
- 1.1. Research Scope
- 1.2. Market Segmentation
- 1.3. Research Methodology
- 1.4. Definitions and Assumptions
- 2. Executive Summary
- 2.1. Introduction
- 3. Market Dynamics
- 3.1. Introduction
- 3.2. Market Drivers
- 3.2.1. Rising Demand for Affordable Housing; Growing Shift Towards Sustainable Construction
- 3.3. Market Restrains
- 3.3.1. Rising Demand for Affordable Housing; Growing Shift Towards Sustainable Construction
- 3.4. Market Trends
- 3.4.1. Residential Segment is Expected to Observe Significant Market Share
- 4. Market Factor Analysis
- 4.1. Porters Five Forces
- 4.2. Supply/Value Chain
- 4.3. PESTEL analysis
- 4.4. Market Entropy
- 4.5. Patent/Trademark Analysis
- 5. Global 3D Printing Construction Market Analysis, Insights and Forecast, 2019-2031
- 5.1. Market Analysis, Insights and Forecast - by Method
- 5.1.1. Extrusion
- 5.1.2. Powder Bonding
- 5.1.3. Other Methods
- 5.2. Market Analysis, Insights and Forecast - by Material Type
- 5.2.1. Concrete
- 5.2.2. Metal
- 5.2.3. Composite
- 5.3. Market Analysis, Insights and Forecast - by End User Industry
- 5.3.1. Commercial
- 5.3.2. Residential
- 5.3.3. Industrial
- 5.4. Market Analysis, Insights and Forecast - by Region
- 5.4.1. North America
- 5.4.2. Europe
- 5.4.3. Asia
- 5.4.4. Australia and New Zealand
- 5.4.5. Latin America
- 5.4.6. Middle East and Africa
- 5.1. Market Analysis, Insights and Forecast - by Method
- 6. North America 3D Printing Construction Market Analysis, Insights and Forecast, 2019-2031
- 6.1. Market Analysis, Insights and Forecast - by Method
- 6.1.1. Extrusion
- 6.1.2. Powder Bonding
- 6.1.3. Other Methods
- 6.2. Market Analysis, Insights and Forecast - by Material Type
- 6.2.1. Concrete
- 6.2.2. Metal
- 6.2.3. Composite
- 6.3. Market Analysis, Insights and Forecast - by End User Industry
- 6.3.1. Commercial
- 6.3.2. Residential
- 6.3.3. Industrial
- 6.1. Market Analysis, Insights and Forecast - by Method
- 7. Europe 3D Printing Construction Market Analysis, Insights and Forecast, 2019-2031
- 7.1. Market Analysis, Insights and Forecast - by Method
- 7.1.1. Extrusion
- 7.1.2. Powder Bonding
- 7.1.3. Other Methods
- 7.2. Market Analysis, Insights and Forecast - by Material Type
- 7.2.1. Concrete
- 7.2.2. Metal
- 7.2.3. Composite
- 7.3. Market Analysis, Insights and Forecast - by End User Industry
- 7.3.1. Commercial
- 7.3.2. Residential
- 7.3.3. Industrial
- 7.1. Market Analysis, Insights and Forecast - by Method
- 8. Asia 3D Printing Construction Market Analysis, Insights and Forecast, 2019-2031
- 8.1. Market Analysis, Insights and Forecast - by Method
- 8.1.1. Extrusion
- 8.1.2. Powder Bonding
- 8.1.3. Other Methods
- 8.2. Market Analysis, Insights and Forecast - by Material Type
- 8.2.1. Concrete
- 8.2.2. Metal
- 8.2.3. Composite
- 8.3. Market Analysis, Insights and Forecast - by End User Industry
- 8.3.1. Commercial
- 8.3.2. Residential
- 8.3.3. Industrial
- 8.1. Market Analysis, Insights and Forecast - by Method
- 9. Australia and New Zealand 3D Printing Construction Market Analysis, Insights and Forecast, 2019-2031
- 9.1. Market Analysis, Insights and Forecast - by Method
- 9.1.1. Extrusion
- 9.1.2. Powder Bonding
- 9.1.3. Other Methods
- 9.2. Market Analysis, Insights and Forecast - by Material Type
- 9.2.1. Concrete
- 9.2.2. Metal
- 9.2.3. Composite
- 9.3. Market Analysis, Insights and Forecast - by End User Industry
- 9.3.1. Commercial
- 9.3.2. Residential
- 9.3.3. Industrial
- 9.1. Market Analysis, Insights and Forecast - by Method
- 10. Latin America 3D Printing Construction Market Analysis, Insights and Forecast, 2019-2031
- 10.1. Market Analysis, Insights and Forecast - by Method
- 10.1.1. Extrusion
- 10.1.2. Powder Bonding
- 10.1.3. Other Methods
- 10.2. Market Analysis, Insights and Forecast - by Material Type
- 10.2.1. Concrete
- 10.2.2. Metal
- 10.2.3. Composite
- 10.3. Market Analysis, Insights and Forecast - by End User Industry
- 10.3.1. Commercial
- 10.3.2. Residential
- 10.3.3. Industrial
- 10.1. Market Analysis, Insights and Forecast - by Method
- 11. Middle East and Africa 3D Printing Construction Market Analysis, Insights and Forecast, 2019-2031
- 11.1. Market Analysis, Insights and Forecast - by Method
- 11.1.1. Extrusion
- 11.1.2. Powder Bonding
- 11.1.3. Other Methods
- 11.2. Market Analysis, Insights and Forecast - by Material Type
- 11.2.1. Concrete
- 11.2.2. Metal
- 11.2.3. Composite
- 11.3. Market Analysis, Insights and Forecast - by End User Industry
- 11.3.1. Commercial
- 11.3.2. Residential
- 11.3.3. Industrial
- 11.1. Market Analysis, Insights and Forecast - by Method
- 12. Competitive Analysis
- 12.1. Global Market Share Analysis 2024
- 12.2. Company Profiles
- 12.2.1 COBOD International A/S
- 12.2.1.1. Overview
- 12.2.1.2. Products
- 12.2.1.3. SWOT Analysis
- 12.2.1.4. Recent Developments
- 12.2.1.5. Financials (Based on Availability)
- 12.2.2 Yingchuang Building Technique
- 12.2.2.1. Overview
- 12.2.2.2. Products
- 12.2.2.3. SWOT Analysis
- 12.2.2.4. Recent Developments
- 12.2.2.5. Financials (Based on Availability)
- 12.2.3 XtreeE
- 12.2.3.1. Overview
- 12.2.3.2. Products
- 12.2.3.3. SWOT Analysis
- 12.2.3.4. Recent Developments
- 12.2.3.5. Financials (Based on Availability)
- 12.2.4 Apis Cor
- 12.2.4.1. Overview
- 12.2.4.2. Products
- 12.2.4.3. SWOT Analysis
- 12.2.4.4. Recent Developments
- 12.2.4.5. Financials (Based on Availability)
- 12.2.5 VoxelMatters
- 12.2.5.1. Overview
- 12.2.5.2. Products
- 12.2.5.3. SWOT Analysis
- 12.2.5.4. Recent Developments
- 12.2.5.5. Financials (Based on Availability)
- 12.2.6 Make3d in
- 12.2.6.1. Overview
- 12.2.6.2. Products
- 12.2.6.3. SWOT Analysis
- 12.2.6.4. Recent Developments
- 12.2.6.5. Financials (Based on Availability)
- 12.2.7 AJAX Engineering
- 12.2.7.1. Overview
- 12.2.7.2. Products
- 12.2.7.3. SWOT Analysis
- 12.2.7.4. Recent Developments
- 12.2.7.5. Financials (Based on Availability)
- 12.2.8 RIC Technology
- 12.2.8.1. Overview
- 12.2.8.2. Products
- 12.2.8.3. SWOT Analysis
- 12.2.8.4. Recent Developments
- 12.2.8.5. Financials (Based on Availability)
- 12.2.9 Holcim
- 12.2.9.1. Overview
- 12.2.9.2. Products
- 12.2.9.3. SWOT Analysis
- 12.2.9.4. Recent Developments
- 12.2.9.5. Financials (Based on Availability)
- 12.2.10 Sika*List Not Exhaustive
- 12.2.10.1. Overview
- 12.2.10.2. Products
- 12.2.10.3. SWOT Analysis
- 12.2.10.4. Recent Developments
- 12.2.10.5. Financials (Based on Availability)
- 12.2.1 COBOD International A/S
List of Figures
- Figure 1: Global 3D Printing Construction Market Revenue Breakdown (Million, %) by Region 2024 & 2032
- Figure 2: Global 3D Printing Construction Market Volume Breakdown (Billion, %) by Region 2024 & 2032
- Figure 3: North America 3D Printing Construction Market Revenue (Million), by Method 2024 & 2032
- Figure 4: North America 3D Printing Construction Market Volume (Billion), by Method 2024 & 2032
- Figure 5: North America 3D Printing Construction Market Revenue Share (%), by Method 2024 & 2032
- Figure 6: North America 3D Printing Construction Market Volume Share (%), by Method 2024 & 2032
- Figure 7: North America 3D Printing Construction Market Revenue (Million), by Material Type 2024 & 2032
- Figure 8: North America 3D Printing Construction Market Volume (Billion), by Material Type 2024 & 2032
- Figure 9: North America 3D Printing Construction Market Revenue Share (%), by Material Type 2024 & 2032
- Figure 10: North America 3D Printing Construction Market Volume Share (%), by Material Type 2024 & 2032
- Figure 11: North America 3D Printing Construction Market Revenue (Million), by End User Industry 2024 & 2032
- Figure 12: North America 3D Printing Construction Market Volume (Billion), by End User Industry 2024 & 2032
- Figure 13: North America 3D Printing Construction Market Revenue Share (%), by End User Industry 2024 & 2032
- Figure 14: North America 3D Printing Construction Market Volume Share (%), by End User Industry 2024 & 2032
- Figure 15: North America 3D Printing Construction Market Revenue (Million), by Country 2024 & 2032
- Figure 16: North America 3D Printing Construction Market Volume (Billion), by Country 2024 & 2032
- Figure 17: North America 3D Printing Construction Market Revenue Share (%), by Country 2024 & 2032
- Figure 18: North America 3D Printing Construction Market Volume Share (%), by Country 2024 & 2032
- Figure 19: Europe 3D Printing Construction Market Revenue (Million), by Method 2024 & 2032
- Figure 20: Europe 3D Printing Construction Market Volume (Billion), by Method 2024 & 2032
- Figure 21: Europe 3D Printing Construction Market Revenue Share (%), by Method 2024 & 2032
- Figure 22: Europe 3D Printing Construction Market Volume Share (%), by Method 2024 & 2032
- Figure 23: Europe 3D Printing Construction Market Revenue (Million), by Material Type 2024 & 2032
- Figure 24: Europe 3D Printing Construction Market Volume (Billion), by Material Type 2024 & 2032
- Figure 25: Europe 3D Printing Construction Market Revenue Share (%), by Material Type 2024 & 2032
- Figure 26: Europe 3D Printing Construction Market Volume Share (%), by Material Type 2024 & 2032
- Figure 27: Europe 3D Printing Construction Market Revenue (Million), by End User Industry 2024 & 2032
- Figure 28: Europe 3D Printing Construction Market Volume (Billion), by End User Industry 2024 & 2032
- Figure 29: Europe 3D Printing Construction Market Revenue Share (%), by End User Industry 2024 & 2032
- Figure 30: Europe 3D Printing Construction Market Volume Share (%), by End User Industry 2024 & 2032
- Figure 31: Europe 3D Printing Construction Market Revenue (Million), by Country 2024 & 2032
- Figure 32: Europe 3D Printing Construction Market Volume (Billion), by Country 2024 & 2032
- Figure 33: Europe 3D Printing Construction Market Revenue Share (%), by Country 2024 & 2032
- Figure 34: Europe 3D Printing Construction Market Volume Share (%), by Country 2024 & 2032
- Figure 35: Asia 3D Printing Construction Market Revenue (Million), by Method 2024 & 2032
- Figure 36: Asia 3D Printing Construction Market Volume (Billion), by Method 2024 & 2032
- Figure 37: Asia 3D Printing Construction Market Revenue Share (%), by Method 2024 & 2032
- Figure 38: Asia 3D Printing Construction Market Volume Share (%), by Method 2024 & 2032
- Figure 39: Asia 3D Printing Construction Market Revenue (Million), by Material Type 2024 & 2032
- Figure 40: Asia 3D Printing Construction Market Volume (Billion), by Material Type 2024 & 2032
- Figure 41: Asia 3D Printing Construction Market Revenue Share (%), by Material Type 2024 & 2032
- Figure 42: Asia 3D Printing Construction Market Volume Share (%), by Material Type 2024 & 2032
- Figure 43: Asia 3D Printing Construction Market Revenue (Million), by End User Industry 2024 & 2032
- Figure 44: Asia 3D Printing Construction Market Volume (Billion), by End User Industry 2024 & 2032
- Figure 45: Asia 3D Printing Construction Market Revenue Share (%), by End User Industry 2024 & 2032
- Figure 46: Asia 3D Printing Construction Market Volume Share (%), by End User Industry 2024 & 2032
- Figure 47: Asia 3D Printing Construction Market Revenue (Million), by Country 2024 & 2032
- Figure 48: Asia 3D Printing Construction Market Volume (Billion), by Country 2024 & 2032
- Figure 49: Asia 3D Printing Construction Market Revenue Share (%), by Country 2024 & 2032
- Figure 50: Asia 3D Printing Construction Market Volume Share (%), by Country 2024 & 2032
- Figure 51: Australia and New Zealand 3D Printing Construction Market Revenue (Million), by Method 2024 & 2032
- Figure 52: Australia and New Zealand 3D Printing Construction Market Volume (Billion), by Method 2024 & 2032
- Figure 53: Australia and New Zealand 3D Printing Construction Market Revenue Share (%), by Method 2024 & 2032
- Figure 54: Australia and New Zealand 3D Printing Construction Market Volume Share (%), by Method 2024 & 2032
- Figure 55: Australia and New Zealand 3D Printing Construction Market Revenue (Million), by Material Type 2024 & 2032
- Figure 56: Australia and New Zealand 3D Printing Construction Market Volume (Billion), by Material Type 2024 & 2032
- Figure 57: Australia and New Zealand 3D Printing Construction Market Revenue Share (%), by Material Type 2024 & 2032
- Figure 58: Australia and New Zealand 3D Printing Construction Market Volume Share (%), by Material Type 2024 & 2032
- Figure 59: Australia and New Zealand 3D Printing Construction Market Revenue (Million), by End User Industry 2024 & 2032
- Figure 60: Australia and New Zealand 3D Printing Construction Market Volume (Billion), by End User Industry 2024 & 2032
- Figure 61: Australia and New Zealand 3D Printing Construction Market Revenue Share (%), by End User Industry 2024 & 2032
- Figure 62: Australia and New Zealand 3D Printing Construction Market Volume Share (%), by End User Industry 2024 & 2032
- Figure 63: Australia and New Zealand 3D Printing Construction Market Revenue (Million), by Country 2024 & 2032
- Figure 64: Australia and New Zealand 3D Printing Construction Market Volume (Billion), by Country 2024 & 2032
- Figure 65: Australia and New Zealand 3D Printing Construction Market Revenue Share (%), by Country 2024 & 2032
- Figure 66: Australia and New Zealand 3D Printing Construction Market Volume Share (%), by Country 2024 & 2032
- Figure 67: Latin America 3D Printing Construction Market Revenue (Million), by Method 2024 & 2032
- Figure 68: Latin America 3D Printing Construction Market Volume (Billion), by Method 2024 & 2032
- Figure 69: Latin America 3D Printing Construction Market Revenue Share (%), by Method 2024 & 2032
- Figure 70: Latin America 3D Printing Construction Market Volume Share (%), by Method 2024 & 2032
- Figure 71: Latin America 3D Printing Construction Market Revenue (Million), by Material Type 2024 & 2032
- Figure 72: Latin America 3D Printing Construction Market Volume (Billion), by Material Type 2024 & 2032
- Figure 73: Latin America 3D Printing Construction Market Revenue Share (%), by Material Type 2024 & 2032
- Figure 74: Latin America 3D Printing Construction Market Volume Share (%), by Material Type 2024 & 2032
- Figure 75: Latin America 3D Printing Construction Market Revenue (Million), by End User Industry 2024 & 2032
- Figure 76: Latin America 3D Printing Construction Market Volume (Billion), by End User Industry 2024 & 2032
- Figure 77: Latin America 3D Printing Construction Market Revenue Share (%), by End User Industry 2024 & 2032
- Figure 78: Latin America 3D Printing Construction Market Volume Share (%), by End User Industry 2024 & 2032
- Figure 79: Latin America 3D Printing Construction Market Revenue (Million), by Country 2024 & 2032
- Figure 80: Latin America 3D Printing Construction Market Volume (Billion), by Country 2024 & 2032
- Figure 81: Latin America 3D Printing Construction Market Revenue Share (%), by Country 2024 & 2032
- Figure 82: Latin America 3D Printing Construction Market Volume Share (%), by Country 2024 & 2032
- Figure 83: Middle East and Africa 3D Printing Construction Market Revenue (Million), by Method 2024 & 2032
- Figure 84: Middle East and Africa 3D Printing Construction Market Volume (Billion), by Method 2024 & 2032
- Figure 85: Middle East and Africa 3D Printing Construction Market Revenue Share (%), by Method 2024 & 2032
- Figure 86: Middle East and Africa 3D Printing Construction Market Volume Share (%), by Method 2024 & 2032
- Figure 87: Middle East and Africa 3D Printing Construction Market Revenue (Million), by Material Type 2024 & 2032
- Figure 88: Middle East and Africa 3D Printing Construction Market Volume (Billion), by Material Type 2024 & 2032
- Figure 89: Middle East and Africa 3D Printing Construction Market Revenue Share (%), by Material Type 2024 & 2032
- Figure 90: Middle East and Africa 3D Printing Construction Market Volume Share (%), by Material Type 2024 & 2032
- Figure 91: Middle East and Africa 3D Printing Construction Market Revenue (Million), by End User Industry 2024 & 2032
- Figure 92: Middle East and Africa 3D Printing Construction Market Volume (Billion), by End User Industry 2024 & 2032
- Figure 93: Middle East and Africa 3D Printing Construction Market Revenue Share (%), by End User Industry 2024 & 2032
- Figure 94: Middle East and Africa 3D Printing Construction Market Volume Share (%), by End User Industry 2024 & 2032
- Figure 95: Middle East and Africa 3D Printing Construction Market Revenue (Million), by Country 2024 & 2032
- Figure 96: Middle East and Africa 3D Printing Construction Market Volume (Billion), by Country 2024 & 2032
- Figure 97: Middle East and Africa 3D Printing Construction Market Revenue Share (%), by Country 2024 & 2032
- Figure 98: Middle East and Africa 3D Printing Construction Market Volume Share (%), by Country 2024 & 2032
List of Tables
- Table 1: Global 3D Printing Construction Market Revenue Million Forecast, by Region 2019 & 2032
- Table 2: Global 3D Printing Construction Market Volume Billion Forecast, by Region 2019 & 2032
- Table 3: Global 3D Printing Construction Market Revenue Million Forecast, by Method 2019 & 2032
- Table 4: Global 3D Printing Construction Market Volume Billion Forecast, by Method 2019 & 2032
- Table 5: Global 3D Printing Construction Market Revenue Million Forecast, by Material Type 2019 & 2032
- Table 6: Global 3D Printing Construction Market Volume Billion Forecast, by Material Type 2019 & 2032
- Table 7: Global 3D Printing Construction Market Revenue Million Forecast, by End User Industry 2019 & 2032
- Table 8: Global 3D Printing Construction Market Volume Billion Forecast, by End User Industry 2019 & 2032
- Table 9: Global 3D Printing Construction Market Revenue Million Forecast, by Region 2019 & 2032
- Table 10: Global 3D Printing Construction Market Volume Billion Forecast, by Region 2019 & 2032
- Table 11: Global 3D Printing Construction Market Revenue Million Forecast, by Method 2019 & 2032
- Table 12: Global 3D Printing Construction Market Volume Billion Forecast, by Method 2019 & 2032
- Table 13: Global 3D Printing Construction Market Revenue Million Forecast, by Material Type 2019 & 2032
- Table 14: Global 3D Printing Construction Market Volume Billion Forecast, by Material Type 2019 & 2032
- Table 15: Global 3D Printing Construction Market Revenue Million Forecast, by End User Industry 2019 & 2032
- Table 16: Global 3D Printing Construction Market Volume Billion Forecast, by End User Industry 2019 & 2032
- Table 17: Global 3D Printing Construction Market Revenue Million Forecast, by Country 2019 & 2032
- Table 18: Global 3D Printing Construction Market Volume Billion Forecast, by Country 2019 & 2032
- Table 19: Global 3D Printing Construction Market Revenue Million Forecast, by Method 2019 & 2032
- Table 20: Global 3D Printing Construction Market Volume Billion Forecast, by Method 2019 & 2032
- Table 21: Global 3D Printing Construction Market Revenue Million Forecast, by Material Type 2019 & 2032
- Table 22: Global 3D Printing Construction Market Volume Billion Forecast, by Material Type 2019 & 2032
- Table 23: Global 3D Printing Construction Market Revenue Million Forecast, by End User Industry 2019 & 2032
- Table 24: Global 3D Printing Construction Market Volume Billion Forecast, by End User Industry 2019 & 2032
- Table 25: Global 3D Printing Construction Market Revenue Million Forecast, by Country 2019 & 2032
- Table 26: Global 3D Printing Construction Market Volume Billion Forecast, by Country 2019 & 2032
- Table 27: Global 3D Printing Construction Market Revenue Million Forecast, by Method 2019 & 2032
- Table 28: Global 3D Printing Construction Market Volume Billion Forecast, by Method 2019 & 2032
- Table 29: Global 3D Printing Construction Market Revenue Million Forecast, by Material Type 2019 & 2032
- Table 30: Global 3D Printing Construction Market Volume Billion Forecast, by Material Type 2019 & 2032
- Table 31: Global 3D Printing Construction Market Revenue Million Forecast, by End User Industry 2019 & 2032
- Table 32: Global 3D Printing Construction Market Volume Billion Forecast, by End User Industry 2019 & 2032
- Table 33: Global 3D Printing Construction Market Revenue Million Forecast, by Country 2019 & 2032
- Table 34: Global 3D Printing Construction Market Volume Billion Forecast, by Country 2019 & 2032
- Table 35: Global 3D Printing Construction Market Revenue Million Forecast, by Method 2019 & 2032
- Table 36: Global 3D Printing Construction Market Volume Billion Forecast, by Method 2019 & 2032
- Table 37: Global 3D Printing Construction Market Revenue Million Forecast, by Material Type 2019 & 2032
- Table 38: Global 3D Printing Construction Market Volume Billion Forecast, by Material Type 2019 & 2032
- Table 39: Global 3D Printing Construction Market Revenue Million Forecast, by End User Industry 2019 & 2032
- Table 40: Global 3D Printing Construction Market Volume Billion Forecast, by End User Industry 2019 & 2032
- Table 41: Global 3D Printing Construction Market Revenue Million Forecast, by Country 2019 & 2032
- Table 42: Global 3D Printing Construction Market Volume Billion Forecast, by Country 2019 & 2032
- Table 43: Global 3D Printing Construction Market Revenue Million Forecast, by Method 2019 & 2032
- Table 44: Global 3D Printing Construction Market Volume Billion Forecast, by Method 2019 & 2032
- Table 45: Global 3D Printing Construction Market Revenue Million Forecast, by Material Type 2019 & 2032
- Table 46: Global 3D Printing Construction Market Volume Billion Forecast, by Material Type 2019 & 2032
- Table 47: Global 3D Printing Construction Market Revenue Million Forecast, by End User Industry 2019 & 2032
- Table 48: Global 3D Printing Construction Market Volume Billion Forecast, by End User Industry 2019 & 2032
- Table 49: Global 3D Printing Construction Market Revenue Million Forecast, by Country 2019 & 2032
- Table 50: Global 3D Printing Construction Market Volume Billion Forecast, by Country 2019 & 2032
- Table 51: Global 3D Printing Construction Market Revenue Million Forecast, by Method 2019 & 2032
- Table 52: Global 3D Printing Construction Market Volume Billion Forecast, by Method 2019 & 2032
- Table 53: Global 3D Printing Construction Market Revenue Million Forecast, by Material Type 2019 & 2032
- Table 54: Global 3D Printing Construction Market Volume Billion Forecast, by Material Type 2019 & 2032
- Table 55: Global 3D Printing Construction Market Revenue Million Forecast, by End User Industry 2019 & 2032
- Table 56: Global 3D Printing Construction Market Volume Billion Forecast, by End User Industry 2019 & 2032
- Table 57: Global 3D Printing Construction Market Revenue Million Forecast, by Country 2019 & 2032
- Table 58: Global 3D Printing Construction Market Volume Billion Forecast, by Country 2019 & 2032
Frequently Asked Questions
1. What is the projected Compound Annual Growth Rate (CAGR) of the 3D Printing Construction Market?
The projected CAGR is approximately 22.49%.
2. Which companies are prominent players in the 3D Printing Construction Market?
Key companies in the market include COBOD International A/S, Yingchuang Building Technique, XtreeE, Apis Cor, VoxelMatters, Make3d in, AJAX Engineering, RIC Technology, Holcim, Sika*List Not Exhaustive.
3. What are the main segments of the 3D Printing Construction Market?
The market segments include Method, Material Type, End User Industry.
4. Can you provide details about the market size?
The market size is estimated to be USD 1.5 Million as of 2022.
5. What are some drivers contributing to market growth?
Rising Demand for Affordable Housing; Growing Shift Towards Sustainable Construction.
6. What are the notable trends driving market growth?
Residential Segment is Expected to Observe Significant Market Share.
7. Are there any restraints impacting market growth?
Rising Demand for Affordable Housing; Growing Shift Towards Sustainable Construction.
8. Can you provide examples of recent developments in the market?
July 2024: In collaboration with Saintgits College of Engineering in Kottayam, Tvasta Manufacturing Solutions, a trailblazing deep-tech startup in Construction 3D Printing, inaugurated Kerala's inaugural Concrete 3D Printer Lab. This state-of-the-art facility is set to enhance research and innovation in the construction sector, leveraging cutting-edge 3D printing methods.March 2024: ICON, known for its pioneering role in advanced construction technologies and large-scale 3D printing, unveiled a suite of innovative products aimed at automating the construction process. Highlights include a groundbreaking robotic printer capable of multi-story constructions, a novel low-carbon building material, a digital catalogue boasting over 60 ready-to-build home designs, and an AI Architect tailored for home design and construction.
9. What pricing options are available for accessing the report?
Pricing options include single-user, multi-user, and enterprise licenses priced at USD 4750, USD 5250, and USD 8750 respectively.
10. Is the market size provided in terms of value or volume?
The market size is provided in terms of value, measured in Million and volume, measured in Billion.
11. Are there any specific market keywords associated with the report?
Yes, the market keyword associated with the report is "3D Printing Construction Market," which aids in identifying and referencing the specific market segment covered.
12. How do I determine which pricing option suits my needs best?
The pricing options vary based on user requirements and access needs. Individual users may opt for single-user licenses, while businesses requiring broader access may choose multi-user or enterprise licenses for cost-effective access to the report.
13. Are there any additional resources or data provided in the 3D Printing Construction Market report?
While the report offers comprehensive insights, it's advisable to review the specific contents or supplementary materials provided to ascertain if additional resources or data are available.
14. How can I stay updated on further developments or reports in the 3D Printing Construction Market?
To stay informed about further developments, trends, and reports in the 3D Printing Construction Market, consider subscribing to industry newsletters, following relevant companies and organizations, or regularly checking reputable industry news sources and publications.
Methodology
Step 1 - Identification of Relevant Samples Size from Population Database


Step 2 - Approaches for Defining Global Market Size (Value, Volume* & Price*)

Note*: In applicable scenarios
Step 3 - Data Sources
Primary Research
- Web Analytics
- Survey Reports
- Research Institute
- Latest Research Reports
- Opinion Leaders
Secondary Research
- Annual Reports
- White Paper
- Latest Press Release
- Industry Association
- Paid Database
- Investor Presentations

Step 4 - Data Triangulation
Involves using different sources of information in order to increase the validity of a study
These sources are likely to be stakeholders in a program - participants, other researchers, program staff, other community members, and so on.
Then we put all data in single framework & apply various statistical tools to find out the dynamic on the market.
During the analysis stage, feedback from the stakeholder groups would be compared to determine areas of agreement as well as areas of divergence


