
Key Insights
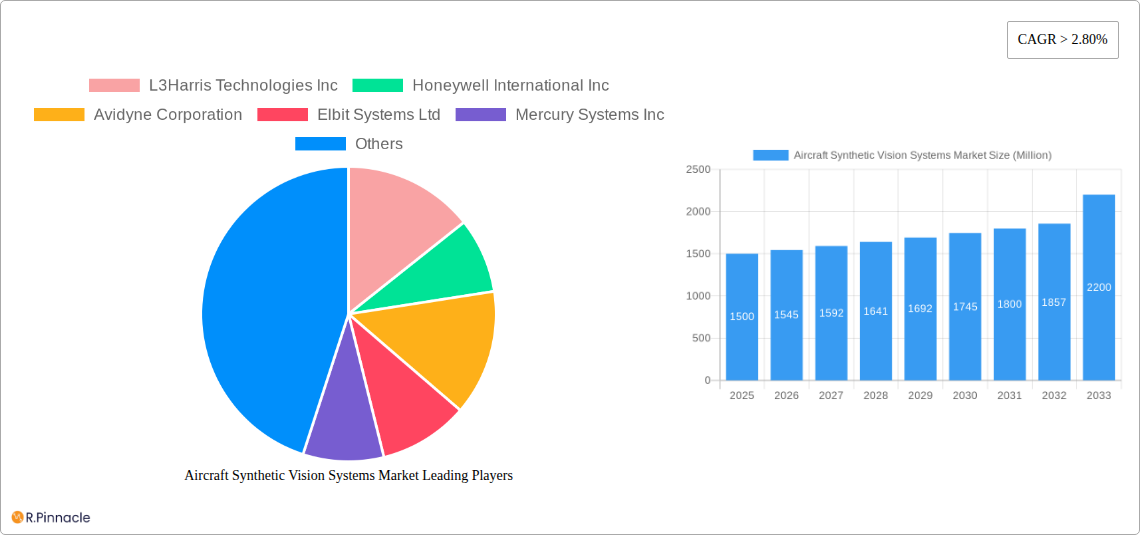
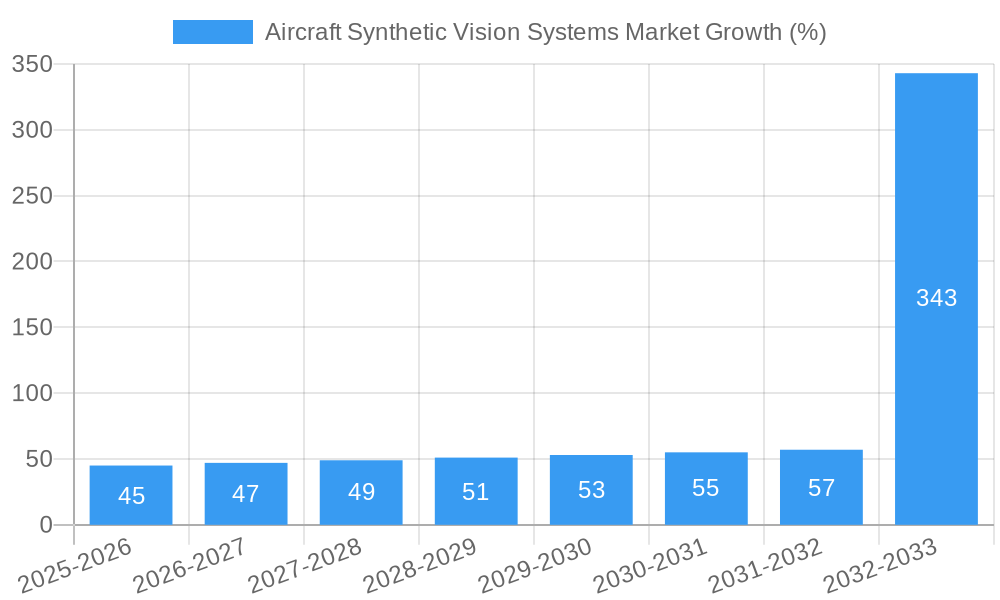
The Aircraft Synthetic Vision Systems (SVS) market is experiencing robust growth, driven by increasing demand for enhanced safety and situational awareness in aviation. The market, valued at approximately $1.5 billion in 2025, is projected to exhibit a Compound Annual Growth Rate (CAGR) exceeding 2.80% from 2025 to 2033, reaching an estimated market size of over $2.2 billion by 2033. This growth is fueled by several key factors. Firstly, stringent regulatory mandates enforcing SVS integration in new aircraft designs and retrofits to older models are significantly boosting market adoption. Secondly, technological advancements leading to improved display resolution, enhanced processing power, and more sophisticated algorithms are resulting in systems offering greater realism and accuracy, increasing their appeal among pilots and airlines. Furthermore, the rising adoption of SVS in general aviation, driven by the need for improved safety in challenging weather conditions and improved navigation capabilities, is contributing to market expansion. The integration of SVS with other advanced avionics systems further adds to the attractiveness of this technology.
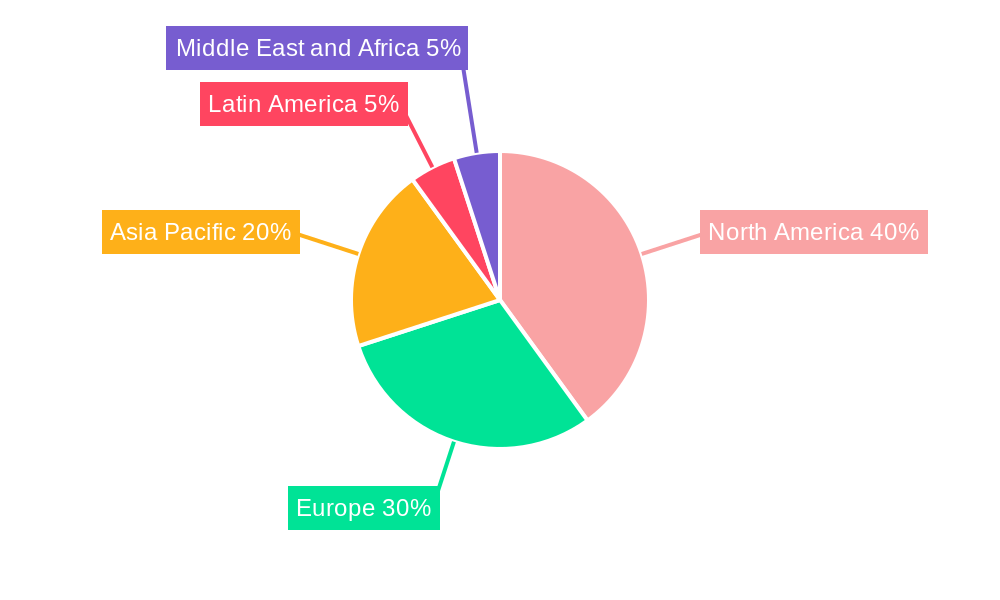
The market segmentation reveals a strong focus on primary flight displays and navigation displays, which together constitute a significant share of overall market value. The military segment currently dominates the end-user market, but commercial aviation is witnessing rapid growth due to investments in safety improvements and operational efficiency. Geographic analysis shows strong market presence in North America and Europe, owing to mature aviation infrastructure and stringent regulatory frameworks. However, the Asia-Pacific region, particularly China and India, is projected to experience the fastest growth over the forecast period due to rapid expansion of their commercial aviation sectors. Competitive intensity within the market is high, with leading players such as L3Harris Technologies, Honeywell International, and others constantly innovating to maintain their market share and meet the growing demand for advanced SVS capabilities. Challenges include the high initial investment costs of SVS integration and the ongoing need for skilled maintenance personnel.
Aircraft Synthetic Vision Systems Market: A Comprehensive Report (2019-2033)
This in-depth report provides a comprehensive analysis of the Aircraft Synthetic Vision Systems Market, offering valuable insights for industry professionals, investors, and strategic decision-makers. Covering the period from 2019 to 2033, with a focus on 2025, this report meticulously examines market dynamics, competitive landscapes, and future growth prospects. The global market size is projected to reach xx Million by 2033, exhibiting a healthy CAGR of xx% during the forecast period (2025-2033).
Aircraft Synthetic Vision Systems Market Structure & Innovation Trends
This section analyzes the competitive landscape, innovation drivers, and regulatory factors shaping the Aircraft Synthetic Vision Systems market. The market exhibits a moderately concentrated structure, with key players like L3Harris Technologies Inc, Honeywell International Inc, and Garmin Ltd holding significant market share. However, the presence of several smaller, specialized players fosters innovation and competition.
- Market Concentration: The top 5 players account for approximately xx% of the market share in 2025.
- Innovation Drivers: Advancements in display technology, improved sensor integration, and the increasing demand for enhanced situational awareness are key innovation drivers.
- Regulatory Frameworks: Stringent safety regulations and certification processes, particularly from bodies like the FAA, significantly influence market growth and product development.
- Product Substitutes: While no direct substitutes exist, traditional navigation systems and pilot experience partially offset the need for advanced synthetic vision systems.
- End-User Demographics: The market is segmented by end-user type, including military, commercial, and general aviation, each with unique needs and growth trajectories. The commercial aviation segment is anticipated to drive significant growth.
- M&A Activities: The industry has witnessed several mergers and acquisitions in recent years, primarily aimed at expanding product portfolios and technological capabilities. Total M&A deal value between 2019 and 2024 is estimated at xx Million.
Aircraft Synthetic Vision Systems Market Dynamics & Trends
The Aircraft Synthetic Vision Systems market is experiencing robust growth driven by several key factors. The increasing demand for enhanced safety features in aviation, particularly in challenging weather conditions, is a primary driver. Technological advancements, such as improved sensor fusion and the integration of artificial intelligence, are further propelling market expansion. Growing air traffic and the increasing adoption of advanced avionics systems contribute to market expansion.
The market penetration of synthetic vision systems is increasing steadily, particularly within the commercial aviation segment, driven by regulatory mandates and safety concerns. The market is also witnessing a shift towards more integrated and sophisticated systems offering enhanced functionalities. Competitive dynamics are intense, with established players focusing on innovation and expansion while newer entrants bring fresh technological solutions to the market.
Dominant Regions & Segments in Aircraft Synthetic Vision Systems Market
Dominant Region: North America is currently the leading region for Aircraft Synthetic Vision Systems, driven by a robust aviation industry and high adoption rates. Europe follows closely, with significant growth potential in Asia-Pacific.
Dominant Segments:
By Type: The Primary Flight Display segment holds the largest market share due to its wide adoption across various aircraft types. The Heads-up and Helmet-mounted Display segment is experiencing significant growth due to its enhanced situational awareness capabilities.
By End User: The Commercial segment dominates the market owing to the high volume of commercial flights and stringent safety regulations. The Military segment is also a significant contributor, driven by the need for advanced navigation systems in military operations.
Key Drivers: Factors like robust economic growth in key regions, supportive government policies, and investments in airport infrastructure are key drivers of market expansion in North America and Europe.
Aircraft Synthetic Vision Systems Market Product Innovations
Recent years have witnessed significant product innovations in the Aircraft Synthetic Vision Systems market. Companies are focusing on developing more integrated systems with improved resolution, enhanced functionalities such as terrain awareness and obstacle avoidance, and seamless integration with other avionics systems. This focus on integration and advanced features provides significant competitive advantages, attracting customers looking for enhanced safety and operational efficiency.
Report Scope & Segmentation Analysis
This report comprehensively analyzes the Aircraft Synthetic Vision Systems market across various segments:
By Type: Primary Flight Display, Navigation Display, Heads-up and Helmet-mounted Display, Other Types. Each segment shows varying growth rates, with Heads-up and Helmet-mounted Displays showing the fastest growth.
By End User: Military, Commercial, General Aviation. The Commercial segment is expected to dominate due to large-scale adoption.
The report provides detailed market size estimates, growth projections, and competitive analyses for each segment, providing a granular view of market opportunities.
Key Drivers of Aircraft Synthetic Vision Systems Market Growth
Several factors fuel the growth of the Aircraft Synthetic Vision Systems market:
Technological Advancements: The development of advanced sensors, improved display technologies, and enhanced processing capabilities are driving innovation and market expansion.
Stringent Safety Regulations: Increasing safety regulations mandate the adoption of advanced safety systems, fueling demand for synthetic vision systems.
Rising Air Traffic: The global increase in air traffic necessitates improved safety and navigation systems.
Challenges in the Aircraft Synthetic Vision Systems Market Sector
Despite the growth opportunities, the market faces challenges:
High Initial Investment Costs: The high cost of implementation can deter some operators, particularly in the General Aviation sector.
Integration Complexity: Integrating synthetic vision systems with existing aircraft systems can be technically challenging and time-consuming.
Maintenance and Support: Ongoing maintenance and support requirements can represent a significant operational cost.
Emerging Opportunities in Aircraft Synthetic Vision Systems Market
The market presents several emerging opportunities:
Expanding into Emerging Markets: Developing countries with growing aviation sectors present significant market potential.
Integration with Unmanned Aerial Vehicles (UAVs): The application of synthetic vision systems in UAVs offers new opportunities.
Development of Advanced Features: The integration of artificial intelligence and machine learning capabilities is poised to enhance system performance.
Leading Players in the Aircraft Synthetic Vision Systems Market Market
- L3Harris Technologies Inc
- Honeywell International Inc
- Avidyne Corporation
- Elbit Systems Ltd
- Mercury Systems Inc
- Garmin Ltd
- Cobham Limited
- Safran SA
- Thales Group
- ENSCO Inc
- Aspen Avionics Inc
- Collins Aerospace (Raytheon Technologies Corporation)
Key Developments in Aircraft Synthetic Vision Systems Market Industry
- October 2022: Collins Aerospace achieved a technical standard order (TSO) for its combined vision system (CVS) for business aviation aircraft.
- October 2022: Garmin International Inc. announced Supplemental Type Certification (STC) for the GI 275 electronic flight instrument in the Dassault Falcon 7X business jet.
- October 2021: Honeywell unveiled the Anthem flight deck, a new aircraft cockpit system with cloud connectivity.
Future Outlook for Aircraft Synthetic Vision Systems Market Market
The Aircraft Synthetic Vision Systems market is poised for continued growth, driven by ongoing technological advancements, stringent safety regulations, and the increasing demand for enhanced situational awareness in aviation. The market's future success hinges on continued innovation, cost reduction, and seamless integration with existing aircraft systems. Strategic partnerships and collaborations will be crucial for players to maintain a competitive edge and capitalize on emerging opportunities.
Aircraft Synthetic Vision Systems Market Segmentation
-
1. Type
- 1.1. Primary Flight Display
- 1.2. Navigation Display
- 1.3. Heads-up and Helmet-mounted Display
- 1.4. Other Types
-
2. End User
- 2.1. Military
- 2.2. Commercial
- 2.3. General Aviation
Aircraft Synthetic Vision Systems Market Segmentation By Geography
-
1. North America
- 1.1. United States
- 1.2. Canada
-
2. Europe
- 2.1. Germany
- 2.2. United Kingdom
- 2.3. France
- 2.4. Russia
- 2.5. Rest of Europe
-
3. Asia Pacific
- 3.1. China
- 3.2. Japan
- 3.3. India
- 3.4. South Korea
- 3.5. Rest of Asia Pacific
-
4. Latin America
- 4.1. Brazil
- 4.2. Mexico
- 4.3. Rest of Latin America
-
5. Middle East and Africa
- 5.1. United Arab Emirates
- 5.2. Saudi Arabia
- 5.3. Egypt
- 5.4. Rest of Middle East and Africa
Aircraft Synthetic Vision Systems Market REPORT HIGHLIGHTS
| Aspects | Details |
|---|---|
| Study Period | 2019-2033 |
| Base Year | 2024 |
| Estimated Year | 2025 |
| Forecast Period | 2025-2033 |
| Historical Period | 2019-2024 |
| Growth Rate | CAGR of > 2.80% from 2019-2033 |
| Segmentation |
|
Table of Contents
- 1. Introduction
- 1.1. Research Scope
- 1.2. Market Segmentation
- 1.3. Research Methodology
- 1.4. Definitions and Assumptions
- 2. Executive Summary
- 2.1. Introduction
- 3. Market Dynamics
- 3.1. Introduction
- 3.2. Market Drivers
- 3.3. Market Restrains
- 3.4. Market Trends
- 3.4.1. Military End-user to Witness Higher Growth During the Forecast Period
- 4. Market Factor Analysis
- 4.1. Porters Five Forces
- 4.2. Supply/Value Chain
- 4.3. PESTEL analysis
- 4.4. Market Entropy
- 4.5. Patent/Trademark Analysis
- 5. Global Aircraft Synthetic Vision Systems Market Analysis, Insights and Forecast, 2019-2031
- 5.1. Market Analysis, Insights and Forecast - by Type
- 5.1.1. Primary Flight Display
- 5.1.2. Navigation Display
- 5.1.3. Heads-up and Helmet-mounted Display
- 5.1.4. Other Types
- 5.2. Market Analysis, Insights and Forecast - by End User
- 5.2.1. Military
- 5.2.2. Commercial
- 5.2.3. General Aviation
- 5.3. Market Analysis, Insights and Forecast - by Region
- 5.3.1. North America
- 5.3.2. Europe
- 5.3.3. Asia Pacific
- 5.3.4. Latin America
- 5.3.5. Middle East and Africa
- 5.1. Market Analysis, Insights and Forecast - by Type
- 6. North America Aircraft Synthetic Vision Systems Market Analysis, Insights and Forecast, 2019-2031
- 6.1. Market Analysis, Insights and Forecast - by Type
- 6.1.1. Primary Flight Display
- 6.1.2. Navigation Display
- 6.1.3. Heads-up and Helmet-mounted Display
- 6.1.4. Other Types
- 6.2. Market Analysis, Insights and Forecast - by End User
- 6.2.1. Military
- 6.2.2. Commercial
- 6.2.3. General Aviation
- 6.1. Market Analysis, Insights and Forecast - by Type
- 7. Europe Aircraft Synthetic Vision Systems Market Analysis, Insights and Forecast, 2019-2031
- 7.1. Market Analysis, Insights and Forecast - by Type
- 7.1.1. Primary Flight Display
- 7.1.2. Navigation Display
- 7.1.3. Heads-up and Helmet-mounted Display
- 7.1.4. Other Types
- 7.2. Market Analysis, Insights and Forecast - by End User
- 7.2.1. Military
- 7.2.2. Commercial
- 7.2.3. General Aviation
- 7.1. Market Analysis, Insights and Forecast - by Type
- 8. Asia Pacific Aircraft Synthetic Vision Systems Market Analysis, Insights and Forecast, 2019-2031
- 8.1. Market Analysis, Insights and Forecast - by Type
- 8.1.1. Primary Flight Display
- 8.1.2. Navigation Display
- 8.1.3. Heads-up and Helmet-mounted Display
- 8.1.4. Other Types
- 8.2. Market Analysis, Insights and Forecast - by End User
- 8.2.1. Military
- 8.2.2. Commercial
- 8.2.3. General Aviation
- 8.1. Market Analysis, Insights and Forecast - by Type
- 9. Latin America Aircraft Synthetic Vision Systems Market Analysis, Insights and Forecast, 2019-2031
- 9.1. Market Analysis, Insights and Forecast - by Type
- 9.1.1. Primary Flight Display
- 9.1.2. Navigation Display
- 9.1.3. Heads-up and Helmet-mounted Display
- 9.1.4. Other Types
- 9.2. Market Analysis, Insights and Forecast - by End User
- 9.2.1. Military
- 9.2.2. Commercial
- 9.2.3. General Aviation
- 9.1. Market Analysis, Insights and Forecast - by Type
- 10. Middle East and Africa Aircraft Synthetic Vision Systems Market Analysis, Insights and Forecast, 2019-2031
- 10.1. Market Analysis, Insights and Forecast - by Type
- 10.1.1. Primary Flight Display
- 10.1.2. Navigation Display
- 10.1.3. Heads-up and Helmet-mounted Display
- 10.1.4. Other Types
- 10.2. Market Analysis, Insights and Forecast - by End User
- 10.2.1. Military
- 10.2.2. Commercial
- 10.2.3. General Aviation
- 10.1. Market Analysis, Insights and Forecast - by Type
- 11. North America Aircraft Synthetic Vision Systems Market Analysis, Insights and Forecast, 2019-2031
- 11.1. Market Analysis, Insights and Forecast - By Country/Sub-region
- 11.1.1 United States
- 11.1.2 Canada
- 12. Europe Aircraft Synthetic Vision Systems Market Analysis, Insights and Forecast, 2019-2031
- 12.1. Market Analysis, Insights and Forecast - By Country/Sub-region
- 12.1.1 Germany
- 12.1.2 United Kingdom
- 12.1.3 France
- 12.1.4 Russia
- 12.1.5 Rest of Europe
- 13. Asia Pacific Aircraft Synthetic Vision Systems Market Analysis, Insights and Forecast, 2019-2031
- 13.1. Market Analysis, Insights and Forecast - By Country/Sub-region
- 13.1.1 China
- 13.1.2 Japan
- 13.1.3 India
- 13.1.4 South Korea
- 13.1.5 Rest of Asia Pacific
- 14. Latin America Aircraft Synthetic Vision Systems Market Analysis, Insights and Forecast, 2019-2031
- 14.1. Market Analysis, Insights and Forecast - By Country/Sub-region
- 14.1.1 Brazil
- 14.1.2 Mexico
- 14.1.3 Rest of Latin America
- 15. Middle East and Africa Aircraft Synthetic Vision Systems Market Analysis, Insights and Forecast, 2019-2031
- 15.1. Market Analysis, Insights and Forecast - By Country/Sub-region
- 15.1.1 United Arab Emirates
- 15.1.2 Saudi Arabia
- 15.1.3 Egypt
- 15.1.4 Rest of Middle East and Africa
- 16. Competitive Analysis
- 16.1. Global Market Share Analysis 2024
- 16.2. Company Profiles
- 16.2.1 L3Harris Technologies Inc
- 16.2.1.1. Overview
- 16.2.1.2. Products
- 16.2.1.3. SWOT Analysis
- 16.2.1.4. Recent Developments
- 16.2.1.5. Financials (Based on Availability)
- 16.2.2 Honeywell International Inc
- 16.2.2.1. Overview
- 16.2.2.2. Products
- 16.2.2.3. SWOT Analysis
- 16.2.2.4. Recent Developments
- 16.2.2.5. Financials (Based on Availability)
- 16.2.3 Avidyne Corporation
- 16.2.3.1. Overview
- 16.2.3.2. Products
- 16.2.3.3. SWOT Analysis
- 16.2.3.4. Recent Developments
- 16.2.3.5. Financials (Based on Availability)
- 16.2.4 Elbit Systems Ltd
- 16.2.4.1. Overview
- 16.2.4.2. Products
- 16.2.4.3. SWOT Analysis
- 16.2.4.4. Recent Developments
- 16.2.4.5. Financials (Based on Availability)
- 16.2.5 Mercury Systems Inc
- 16.2.5.1. Overview
- 16.2.5.2. Products
- 16.2.5.3. SWOT Analysis
- 16.2.5.4. Recent Developments
- 16.2.5.5. Financials (Based on Availability)
- 16.2.6 Garmin Ltd
- 16.2.6.1. Overview
- 16.2.6.2. Products
- 16.2.6.3. SWOT Analysis
- 16.2.6.4. Recent Developments
- 16.2.6.5. Financials (Based on Availability)
- 16.2.7 Cobham Limited
- 16.2.7.1. Overview
- 16.2.7.2. Products
- 16.2.7.3. SWOT Analysis
- 16.2.7.4. Recent Developments
- 16.2.7.5. Financials (Based on Availability)
- 16.2.8 Safran SA
- 16.2.8.1. Overview
- 16.2.8.2. Products
- 16.2.8.3. SWOT Analysis
- 16.2.8.4. Recent Developments
- 16.2.8.5. Financials (Based on Availability)
- 16.2.9 Thales Group
- 16.2.9.1. Overview
- 16.2.9.2. Products
- 16.2.9.3. SWOT Analysis
- 16.2.9.4. Recent Developments
- 16.2.9.5. Financials (Based on Availability)
- 16.2.10 ENSCO Inc
- 16.2.10.1. Overview
- 16.2.10.2. Products
- 16.2.10.3. SWOT Analysis
- 16.2.10.4. Recent Developments
- 16.2.10.5. Financials (Based on Availability)
- 16.2.11 Aspen Avionics Inc
- 16.2.11.1. Overview
- 16.2.11.2. Products
- 16.2.11.3. SWOT Analysis
- 16.2.11.4. Recent Developments
- 16.2.11.5. Financials (Based on Availability)
- 16.2.12 Collins Aerospace (Raytheon Technologies Corporation)
- 16.2.12.1. Overview
- 16.2.12.2. Products
- 16.2.12.3. SWOT Analysis
- 16.2.12.4. Recent Developments
- 16.2.12.5. Financials (Based on Availability)
- 16.2.1 L3Harris Technologies Inc
List of Figures
- Figure 1: Global Aircraft Synthetic Vision Systems Market Revenue Breakdown (Million, %) by Region 2024 & 2032
- Figure 2: North America Aircraft Synthetic Vision Systems Market Revenue (Million), by Country 2024 & 2032
- Figure 3: North America Aircraft Synthetic Vision Systems Market Revenue Share (%), by Country 2024 & 2032
- Figure 4: Europe Aircraft Synthetic Vision Systems Market Revenue (Million), by Country 2024 & 2032
- Figure 5: Europe Aircraft Synthetic Vision Systems Market Revenue Share (%), by Country 2024 & 2032
- Figure 6: Asia Pacific Aircraft Synthetic Vision Systems Market Revenue (Million), by Country 2024 & 2032
- Figure 7: Asia Pacific Aircraft Synthetic Vision Systems Market Revenue Share (%), by Country 2024 & 2032
- Figure 8: Latin America Aircraft Synthetic Vision Systems Market Revenue (Million), by Country 2024 & 2032
- Figure 9: Latin America Aircraft Synthetic Vision Systems Market Revenue Share (%), by Country 2024 & 2032
- Figure 10: Middle East and Africa Aircraft Synthetic Vision Systems Market Revenue (Million), by Country 2024 & 2032
- Figure 11: Middle East and Africa Aircraft Synthetic Vision Systems Market Revenue Share (%), by Country 2024 & 2032
- Figure 12: North America Aircraft Synthetic Vision Systems Market Revenue (Million), by Type 2024 & 2032
- Figure 13: North America Aircraft Synthetic Vision Systems Market Revenue Share (%), by Type 2024 & 2032
- Figure 14: North America Aircraft Synthetic Vision Systems Market Revenue (Million), by End User 2024 & 2032
- Figure 15: North America Aircraft Synthetic Vision Systems Market Revenue Share (%), by End User 2024 & 2032
- Figure 16: North America Aircraft Synthetic Vision Systems Market Revenue (Million), by Country 2024 & 2032
- Figure 17: North America Aircraft Synthetic Vision Systems Market Revenue Share (%), by Country 2024 & 2032
- Figure 18: Europe Aircraft Synthetic Vision Systems Market Revenue (Million), by Type 2024 & 2032
- Figure 19: Europe Aircraft Synthetic Vision Systems Market Revenue Share (%), by Type 2024 & 2032
- Figure 20: Europe Aircraft Synthetic Vision Systems Market Revenue (Million), by End User 2024 & 2032
- Figure 21: Europe Aircraft Synthetic Vision Systems Market Revenue Share (%), by End User 2024 & 2032
- Figure 22: Europe Aircraft Synthetic Vision Systems Market Revenue (Million), by Country 2024 & 2032
- Figure 23: Europe Aircraft Synthetic Vision Systems Market Revenue Share (%), by Country 2024 & 2032
- Figure 24: Asia Pacific Aircraft Synthetic Vision Systems Market Revenue (Million), by Type 2024 & 2032
- Figure 25: Asia Pacific Aircraft Synthetic Vision Systems Market Revenue Share (%), by Type 2024 & 2032
- Figure 26: Asia Pacific Aircraft Synthetic Vision Systems Market Revenue (Million), by End User 2024 & 2032
- Figure 27: Asia Pacific Aircraft Synthetic Vision Systems Market Revenue Share (%), by End User 2024 & 2032
- Figure 28: Asia Pacific Aircraft Synthetic Vision Systems Market Revenue (Million), by Country 2024 & 2032
- Figure 29: Asia Pacific Aircraft Synthetic Vision Systems Market Revenue Share (%), by Country 2024 & 2032
- Figure 30: Latin America Aircraft Synthetic Vision Systems Market Revenue (Million), by Type 2024 & 2032
- Figure 31: Latin America Aircraft Synthetic Vision Systems Market Revenue Share (%), by Type 2024 & 2032
- Figure 32: Latin America Aircraft Synthetic Vision Systems Market Revenue (Million), by End User 2024 & 2032
- Figure 33: Latin America Aircraft Synthetic Vision Systems Market Revenue Share (%), by End User 2024 & 2032
- Figure 34: Latin America Aircraft Synthetic Vision Systems Market Revenue (Million), by Country 2024 & 2032
- Figure 35: Latin America Aircraft Synthetic Vision Systems Market Revenue Share (%), by Country 2024 & 2032
- Figure 36: Middle East and Africa Aircraft Synthetic Vision Systems Market Revenue (Million), by Type 2024 & 2032
- Figure 37: Middle East and Africa Aircraft Synthetic Vision Systems Market Revenue Share (%), by Type 2024 & 2032
- Figure 38: Middle East and Africa Aircraft Synthetic Vision Systems Market Revenue (Million), by End User 2024 & 2032
- Figure 39: Middle East and Africa Aircraft Synthetic Vision Systems Market Revenue Share (%), by End User 2024 & 2032
- Figure 40: Middle East and Africa Aircraft Synthetic Vision Systems Market Revenue (Million), by Country 2024 & 2032
- Figure 41: Middle East and Africa Aircraft Synthetic Vision Systems Market Revenue Share (%), by Country 2024 & 2032
List of Tables
- Table 1: Global Aircraft Synthetic Vision Systems Market Revenue Million Forecast, by Region 2019 & 2032
- Table 2: Global Aircraft Synthetic Vision Systems Market Revenue Million Forecast, by Type 2019 & 2032
- Table 3: Global Aircraft Synthetic Vision Systems Market Revenue Million Forecast, by End User 2019 & 2032
- Table 4: Global Aircraft Synthetic Vision Systems Market Revenue Million Forecast, by Region 2019 & 2032
- Table 5: Global Aircraft Synthetic Vision Systems Market Revenue Million Forecast, by Country 2019 & 2032
- Table 6: United States Aircraft Synthetic Vision Systems Market Revenue (Million) Forecast, by Application 2019 & 2032
- Table 7: Canada Aircraft Synthetic Vision Systems Market Revenue (Million) Forecast, by Application 2019 & 2032
- Table 8: Global Aircraft Synthetic Vision Systems Market Revenue Million Forecast, by Country 2019 & 2032
- Table 9: Germany Aircraft Synthetic Vision Systems Market Revenue (Million) Forecast, by Application 2019 & 2032
- Table 10: United Kingdom Aircraft Synthetic Vision Systems Market Revenue (Million) Forecast, by Application 2019 & 2032
- Table 11: France Aircraft Synthetic Vision Systems Market Revenue (Million) Forecast, by Application 2019 & 2032
- Table 12: Russia Aircraft Synthetic Vision Systems Market Revenue (Million) Forecast, by Application 2019 & 2032
- Table 13: Rest of Europe Aircraft Synthetic Vision Systems Market Revenue (Million) Forecast, by Application 2019 & 2032
- Table 14: Global Aircraft Synthetic Vision Systems Market Revenue Million Forecast, by Country 2019 & 2032
- Table 15: China Aircraft Synthetic Vision Systems Market Revenue (Million) Forecast, by Application 2019 & 2032
- Table 16: Japan Aircraft Synthetic Vision Systems Market Revenue (Million) Forecast, by Application 2019 & 2032
- Table 17: India Aircraft Synthetic Vision Systems Market Revenue (Million) Forecast, by Application 2019 & 2032
- Table 18: South Korea Aircraft Synthetic Vision Systems Market Revenue (Million) Forecast, by Application 2019 & 2032
- Table 19: Rest of Asia Pacific Aircraft Synthetic Vision Systems Market Revenue (Million) Forecast, by Application 2019 & 2032
- Table 20: Global Aircraft Synthetic Vision Systems Market Revenue Million Forecast, by Country 2019 & 2032
- Table 21: Brazil Aircraft Synthetic Vision Systems Market Revenue (Million) Forecast, by Application 2019 & 2032
- Table 22: Mexico Aircraft Synthetic Vision Systems Market Revenue (Million) Forecast, by Application 2019 & 2032
- Table 23: Rest of Latin America Aircraft Synthetic Vision Systems Market Revenue (Million) Forecast, by Application 2019 & 2032
- Table 24: Global Aircraft Synthetic Vision Systems Market Revenue Million Forecast, by Country 2019 & 2032
- Table 25: United Arab Emirates Aircraft Synthetic Vision Systems Market Revenue (Million) Forecast, by Application 2019 & 2032
- Table 26: Saudi Arabia Aircraft Synthetic Vision Systems Market Revenue (Million) Forecast, by Application 2019 & 2032
- Table 27: Egypt Aircraft Synthetic Vision Systems Market Revenue (Million) Forecast, by Application 2019 & 2032
- Table 28: Rest of Middle East and Africa Aircraft Synthetic Vision Systems Market Revenue (Million) Forecast, by Application 2019 & 2032
- Table 29: Global Aircraft Synthetic Vision Systems Market Revenue Million Forecast, by Type 2019 & 2032
- Table 30: Global Aircraft Synthetic Vision Systems Market Revenue Million Forecast, by End User 2019 & 2032
- Table 31: Global Aircraft Synthetic Vision Systems Market Revenue Million Forecast, by Country 2019 & 2032
- Table 32: United States Aircraft Synthetic Vision Systems Market Revenue (Million) Forecast, by Application 2019 & 2032
- Table 33: Canada Aircraft Synthetic Vision Systems Market Revenue (Million) Forecast, by Application 2019 & 2032
- Table 34: Global Aircraft Synthetic Vision Systems Market Revenue Million Forecast, by Type 2019 & 2032
- Table 35: Global Aircraft Synthetic Vision Systems Market Revenue Million Forecast, by End User 2019 & 2032
- Table 36: Global Aircraft Synthetic Vision Systems Market Revenue Million Forecast, by Country 2019 & 2032
- Table 37: Germany Aircraft Synthetic Vision Systems Market Revenue (Million) Forecast, by Application 2019 & 2032
- Table 38: United Kingdom Aircraft Synthetic Vision Systems Market Revenue (Million) Forecast, by Application 2019 & 2032
- Table 39: France Aircraft Synthetic Vision Systems Market Revenue (Million) Forecast, by Application 2019 & 2032
- Table 40: Russia Aircraft Synthetic Vision Systems Market Revenue (Million) Forecast, by Application 2019 & 2032
- Table 41: Rest of Europe Aircraft Synthetic Vision Systems Market Revenue (Million) Forecast, by Application 2019 & 2032
- Table 42: Global Aircraft Synthetic Vision Systems Market Revenue Million Forecast, by Type 2019 & 2032
- Table 43: Global Aircraft Synthetic Vision Systems Market Revenue Million Forecast, by End User 2019 & 2032
- Table 44: Global Aircraft Synthetic Vision Systems Market Revenue Million Forecast, by Country 2019 & 2032
- Table 45: China Aircraft Synthetic Vision Systems Market Revenue (Million) Forecast, by Application 2019 & 2032
- Table 46: Japan Aircraft Synthetic Vision Systems Market Revenue (Million) Forecast, by Application 2019 & 2032
- Table 47: India Aircraft Synthetic Vision Systems Market Revenue (Million) Forecast, by Application 2019 & 2032
- Table 48: South Korea Aircraft Synthetic Vision Systems Market Revenue (Million) Forecast, by Application 2019 & 2032
- Table 49: Rest of Asia Pacific Aircraft Synthetic Vision Systems Market Revenue (Million) Forecast, by Application 2019 & 2032
- Table 50: Global Aircraft Synthetic Vision Systems Market Revenue Million Forecast, by Type 2019 & 2032
- Table 51: Global Aircraft Synthetic Vision Systems Market Revenue Million Forecast, by End User 2019 & 2032
- Table 52: Global Aircraft Synthetic Vision Systems Market Revenue Million Forecast, by Country 2019 & 2032
- Table 53: Brazil Aircraft Synthetic Vision Systems Market Revenue (Million) Forecast, by Application 2019 & 2032
- Table 54: Mexico Aircraft Synthetic Vision Systems Market Revenue (Million) Forecast, by Application 2019 & 2032
- Table 55: Rest of Latin America Aircraft Synthetic Vision Systems Market Revenue (Million) Forecast, by Application 2019 & 2032
- Table 56: Global Aircraft Synthetic Vision Systems Market Revenue Million Forecast, by Type 2019 & 2032
- Table 57: Global Aircraft Synthetic Vision Systems Market Revenue Million Forecast, by End User 2019 & 2032
- Table 58: Global Aircraft Synthetic Vision Systems Market Revenue Million Forecast, by Country 2019 & 2032
- Table 59: United Arab Emirates Aircraft Synthetic Vision Systems Market Revenue (Million) Forecast, by Application 2019 & 2032
- Table 60: Saudi Arabia Aircraft Synthetic Vision Systems Market Revenue (Million) Forecast, by Application 2019 & 2032
- Table 61: Egypt Aircraft Synthetic Vision Systems Market Revenue (Million) Forecast, by Application 2019 & 2032
- Table 62: Rest of Middle East and Africa Aircraft Synthetic Vision Systems Market Revenue (Million) Forecast, by Application 2019 & 2032
Frequently Asked Questions
1. What is the projected Compound Annual Growth Rate (CAGR) of the Aircraft Synthetic Vision Systems Market?
The projected CAGR is approximately > 2.80%.
2. Which companies are prominent players in the Aircraft Synthetic Vision Systems Market?
Key companies in the market include L3Harris Technologies Inc, Honeywell International Inc, Avidyne Corporation, Elbit Systems Ltd, Mercury Systems Inc, Garmin Ltd, Cobham Limited, Safran SA, Thales Group, ENSCO Inc, Aspen Avionics Inc, Collins Aerospace (Raytheon Technologies Corporation).
3. What are the main segments of the Aircraft Synthetic Vision Systems Market?
The market segments include Type, End User.
4. Can you provide details about the market size?
The market size is estimated to be USD XX Million as of 2022.
5. What are some drivers contributing to market growth?
N/A
6. What are the notable trends driving market growth?
Military End-user to Witness Higher Growth During the Forecast Period.
7. Are there any restraints impacting market growth?
N/A
8. Can you provide examples of recent developments in the market?
In October 2022, Collins Aerospace achieved a technical standard order (TSO) for its combined vision system (CVS) for business aviation aircraft. The CVS provides clarity to pilots in all types of weather to confidently and securely navigate aircraft through low visibility situations.
9. What pricing options are available for accessing the report?
Pricing options include single-user, multi-user, and enterprise licenses priced at USD 4750, USD 5250, and USD 8750 respectively.
10. Is the market size provided in terms of value or volume?
The market size is provided in terms of value, measured in Million.
11. Are there any specific market keywords associated with the report?
Yes, the market keyword associated with the report is "Aircraft Synthetic Vision Systems Market," which aids in identifying and referencing the specific market segment covered.
12. How do I determine which pricing option suits my needs best?
The pricing options vary based on user requirements and access needs. Individual users may opt for single-user licenses, while businesses requiring broader access may choose multi-user or enterprise licenses for cost-effective access to the report.
13. Are there any additional resources or data provided in the Aircraft Synthetic Vision Systems Market report?
While the report offers comprehensive insights, it's advisable to review the specific contents or supplementary materials provided to ascertain if additional resources or data are available.
14. How can I stay updated on further developments or reports in the Aircraft Synthetic Vision Systems Market?
To stay informed about further developments, trends, and reports in the Aircraft Synthetic Vision Systems Market, consider subscribing to industry newsletters, following relevant companies and organizations, or regularly checking reputable industry news sources and publications.
Methodology
Step 1 - Identification of Relevant Samples Size from Population Database


Step 2 - Approaches for Defining Global Market Size (Value, Volume* & Price*)

Note*: In applicable scenarios
Step 3 - Data Sources
Primary Research
- Web Analytics
- Survey Reports
- Research Institute
- Latest Research Reports
- Opinion Leaders
Secondary Research
- Annual Reports
- White Paper
- Latest Press Release
- Industry Association
- Paid Database
- Investor Presentations

Step 4 - Data Triangulation
Involves using different sources of information in order to increase the validity of a study
These sources are likely to be stakeholders in a program - participants, other researchers, program staff, other community members, and so on.
Then we put all data in single framework & apply various statistical tools to find out the dynamic on the market.
During the analysis stage, feedback from the stakeholder groups would be compared to determine areas of agreement as well as areas of divergence


